XDIV invests in Canadian stocks with strong financials. The companies selected pay above-average dividend yields and have either paid steady or increasing dividends.
XDIV is an index ETF that holds the constituents of the MSCI Canada High Dividend Yield. The replicated index is a quality index that includes strict criteria to achieve an equity portfolio of companies with solid fundamentals. Since XDIV is a dividend ETF, the focus is on achieving sustainable and persistent dividend payments.
Find below more details on the selection process:
targets companies with high dividend income
only stocks with higher than average dividend yields
companies with a track record of consistent dividend payments and with the capacity to sustain dividend payouts into the future
additional factos: return on equity (ROE), earnings variability, debt to equity (D/E), and price performance (past 12 months)
10% security capped index
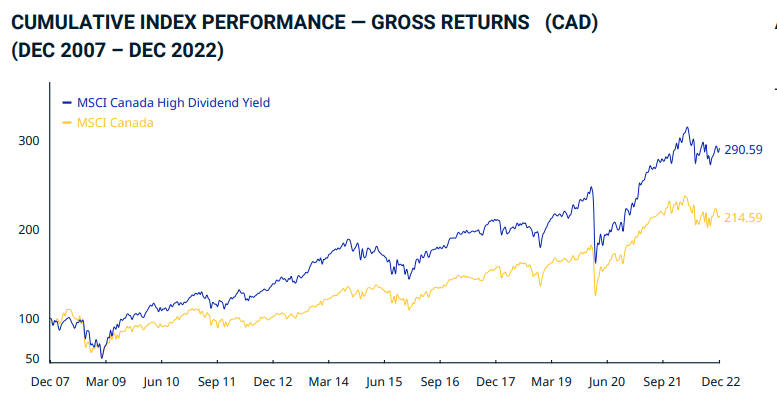
MSCI vs MSCI Canada High Dividend Yield – gross return comparison
– Total return: Though the focus here is on the dividend yield, you have to keep in mind the total return. The profit or loss we make on any investment combines both dividend income and capital gain or loss. Looking at the long-term performance of the fund is crucial. An ETF that provides a good capital appreciation with a high dividend yield is preferable.
–Diversification: A diversified ETF is always a safer option. Some high yield ETFs are sector-specific (Financials, Energy or Gold). The ones focused on Energy and Gold have had an inferior long-term performance and carry high volatility risk.
–Volume and liquidity of the ETF. The higher the asset under management, the lower the trading costs of the ETF (difference between the bid and ask price).
XDIV ETF Dividend distribution
Amount
Ex-Div Date
Record Date
Pay Date
Declare Date
0.1300
3/22/2024
3/25/2024
3/28/2024
3/18/2024
0.1300
2/23/2024
2/26/2024
2/29/2024
2/16/2024
0.1300
1/25/2024
1/26/2024
1/31/2024
1/19/2024
0.1030
12/28/2023
12/29/2023
1/4/2024
12/20/2023
0.1030
11/21/2023
11/22/2023
11/30/2023
11/15/2023
XDIV ETF portfolio
Name
Weight (%)
ROYAL BANK OF CANADA
8.74
SUN LIFE FINANCIAL INC
8.60
MANULIFE FINANCIAL CORP
8.57
BANK OF NOVA SCOTIA
8.56
FORTIS INC
8.15
TORONTO DOMINION
8.00
RESTAURANTS BRANDS INTERNATIONAL I
7.54
ROGERS COMMUNICATIONS NON-VOTING I
6.72
SHAW COMMUNICATIONS INC CLASS B
5.62
EMERA INC
4.44
Sector breakdown
Type
Fund
Financials
50.40
Communication
18.77
Utilities
16.83
Consumer Discretionary
10.05
Energy
1.91
Materials
1.72
Cash and/or Derivatives
0.34
Introduction
For Canadian investors eyeing the growth of the NASDAQ-100 Index similar to the American QQQ ETF, comprehending the intricacies of investing in a U.S.-traded ETF versus opting for a QQQ Canadian equivalent that tracks U.S. equities is essential. We’ll explore the Canadian alternatives to QQQ and discuss the implications for investors in Canada.
Understanding QQQ
The Invesco QQQ Trust (QQQ) is an ETF that tracks the performance of the NASDAQ-100 Index. This a basket of 100 of the largest non-financial companies listed on the NASDAQ stock exchange. Here’s why it stands out:
Low Expense Ratio:
One of the appealing aspects of QQQ is its relatively low expense ratio, making it a cost-effective way to gain exposure to most influential tech companies. The lower fees mean that more of the investment return is passed on to the investors.
Historical Performance:
Historically, QQQ has exhibited strong performance, primarily due to the robust growth of the technology sector. Its concentration in large-cap tech stocks like Apple, Microsoft, and Amazon has allowed it to benefit from the significant gains in this sector. Investors are often attracted to QQQ due to its track record of substantial returns, especially during periods market growth.
Tech-Focused, Growth-Oriented:
QQQ is the a preferred vehicle for investors looking to capitalize on the growth and innovation in the tech sector. As the tech industry has been a leading driver of market performance, QQQ’s focus aligns well with investors’ desire for growth and sector-specific exposure.
Diversification within Tech Dominance:
While technology giants dominate QQQ’s portfolio, it also includes companies from the consumer services, healthcare, and communication sectors, among others. This offers a diversified exposure within the context of a tech-heavy investment. And, it’s appealing to those looking for a balance between specialization and diversification.
In the landscape of ETFs tracking the NASDAQ-100 Index, the performance of QQQ and its Canadian equivalents, particularly ZNQ and ZQQ, are noteworthy. Generally speaking, the performance of QQQ and ZNQ is closely aligned, indicating that ZNQ is effective in mirroring the NASDAQ-100’s performance while being accessible to Canadian investors through the Toronto Stock Exchange.
ZQQ, on the other hand, presents itself as a hedged ETF. This means it aims to minimize the impact of currency fluctuations between the Canadian dollar and the U.S. dollar on its returns. As a result, while it also tracks the NASDAQ-100, its performance may differ from that of QQQ and ZNQ due to this hedging strategy. This difference is not necessarily indicative of better or worse performance but reflects the impact of currency movements on the investment returns. For investors concerned about currency risk, ZQQ offers a way to gain exposure to the NASDAQ-100’s growth while potentially reducing the volatility that can come from fluctuating exchange rates.
In summary, QQQ provides a close performance mirror to the NASDAQ-100 for U.S. investors, while ZNQ offers a similar reflection for Canadians. ZQQ adds an extra layer of currency hedging, which can lead to performance differences, especially beneficial for those looking to mitigate currency risk. Each ETF serves different investor needs based on their investment strategy, risk tolerance, and currency preferences.
The Difference from a Canadian Investor Perspective
Investing in U.S. Traded ETFs (like QQQ)
Currency Exchange: When Canadian investors put money into U.S. traded ETFs such as QQQ, they must deal with currency exchange. Since these investments are denominated in U.S. dollars, Canadians need to convert their CAD to USD. Thus incurring currency exchange fees and exposing themselves to currency risk. The value of their investment may fluctuate not just with the market performance but also with the CAD/USD exchange rate, which can add an unpredictable element to returns.
Tax Considerations: Investing in U.S. ETFs introduces specific tax implications for Canadian investors. Dividends from U.S. securities are subject to withholding taxes, which can diminish the net income received.
Access and Trading: Accessing U.S. traded ETFs means using a brokerage platform that allows trading on U.S. exchanges. While many Canadian brokers offer this service, it might come with higher trading fees compared to domestic trades. Moreover, investors might find the process more cumbersome and the trading hours less convenient, considering the time zone differences between Canada and U.S. market hours.
QQQ Canadian Equivalent (like HXQ or ZNQ)
Best QQQ Equivalent ETFs: ZNQ and ZQQ
Currency Benefits: Opting for Canadian ETFs like ZNQ or ZQQ, which trade in Canadian dollars on the Toronto Stock Exchange, eliminates the need for Canadians to convert funds to USD, avoiding currency conversion fees and risks. This aspect makes investing in U.S. equities more straightforward and potentially more cost-efficient for Canadians.
Tax Advantages: ETFs such as ZNQ and ZQQ are designed with Canadian investors in mind, often employing strategies to reduce withholding taxes on dividends and negate U.S. estate tax implications. This structuring means Canadians may enjoy enhanced tax efficiency, making these ETFs a smarter choice compared to their U.S. counterparts for those concerned with optimizing after-tax returns.
Ease of Trading: Canadian investors benefit from the convenience of trading ZNQ and ZQQ on the TSX, accessible during Canadian market hours. This local listing means investing in a familiar regulatory environment, using Canadian dollars, and enjoying the ease of using local platforms. These factors collectively make ZNQ and ZQQ attractive for those seeking user-friendly access to U.S. markets.
Why These Differences Matter
When deciding between U.S. and Canadian ETFs, investors must consider currency risk and costs, tax implications, and accessibility. Direct investment in U.S. ETFs like QQQ exposes Canadians to currency fluctuations and conversion fees, whereas Canadian ETFs trading in CAD, like HXQ or ZNQ, offer a more straightforward approach with possible currency hedging. Tax-wise, U.S. ETFs may subject Canadians to withholding taxes on dividends, while Canadian ETFs are often structured for better tax efficiency. As for accessibility, U.S. ETFs require trading on U.S. exchanges, potentially incurring higher fees and complexity, while Canadian ETFs are easily traded on Canadian platforms. These differences significantly affect the overall convenience, cost, and return of investments, making it vital for investors to consider their personal situation and seek advice tailored to their investment goals and tax circumstances.
Conclusion
Canadian investors looking to mirror the tech-heavy and growth-oriented profile of the QQQ have viable options with Canadian ETFs like HXQ and ZNQ. Choosing between investing in a U.S. traded ETF or a Canadian ETF tracking U.S. equities involves weighing factors like currency exchange, tax implications, and trading convenience. Each investor’s situation is unique, and it’s important to consider these aspects in light of personal investment goals and strategies. Consulting with a financial advisor to navigate these choices and understand all implications is always a wise step. Invest wisely and stay informed!
Introduction
In our Harvest ETF reviews, we delve into the diverse array of ETFs offered by Harvest Portfolios Group, each designed to cater to specific sectors and investment strategies. Renowned for their emphasis on generating income, these ETFs have garnered attention from a broad spectrum of investors. Our objective review will dissect the strategies, sector focuses, and overarching methodologies of some of the leading Harvest ETFs, providing clarity on how they may align with your investment goals and portfolio needs.
Covered Call Strategy in Harvest ETFs
Many of Harvest ETFs employ a covered call strategy to enhance income return for investors. This involves holding a portfolio of stocks and selling call options on the same stock. It’s a popular strategy for income-focused funds, including those by Harvest. Understanding how this works, along with its advantages and drawbacks, is crucial for investors considering these ETFs.
How Covered Call Strategy Works in Harvest ETFs
Holding Stocks: Initially, the ETF holds shares of companies, often in specific sectors like healthcare, technology, or energy.
Selling Call Options: The fund then sells call options on these stocks. Essentially, they’re giving someone else the right to buy the stock at a predetermined price within a specific period.
Generating Income: The fund earns income from selling these options, which is then distributed to shareholders, typically resulting in higher yield distributions.
Advantages of Covered Call Strategy
Enhanced Income: The primary advantage is the generation of additional income from the premiums received from selling the call options, which can be especially attractive in low yield environments.
Downside Protection: Premiums received can offer some downside protection. In a falling market, the income from the options can offset some of the capital losses from the underlying stock.
Portfolio Stability: This strategy can potentially reduce volatility in the ETF’s returns, as income is generated consistently from the option premiums.
Drawbacks of Covered Call Strategy
Capped Upside: When a call option is sold, the maximum profit from the underlying stock is capped. If the stock surges past the strike price of the option, the ETF doesn’t benefit from those additional gains, as the stock might be called away.
Complexity and Costs: Implementing a covered call strategy adds complexity to fund management, which can lead to higher costs. These might include transaction fees and the need for more active management.
Underperformance in Bull Markets: In strong bull markets, the covered call strategy might lead to underperformance relative to the market or similar ETFs without such a strategy. This is because the potential high returns from the stocks are limited due to the sold call options.
Covered Call Strategy in Context of Harvest ETFs
Harvest ETFs, such as HHL, HTA, HPF, HBF, and HRIF, utilize this strategy aiming to provide a mix of income generation and growth. Each ETF applies the covered call strategy in line with its sector focus and investment objectives. For example, an ETF focusing on tech might sell calls against a portion of its holdings in high-growth tech stocks, aiming to balance income with growth potential.
While the covered call strategy can enhance income and provide some level of protection in down markets, it’s important for investors to be aware of the trade-offs, especially the capped upside potential and the possibility of underperformance during strong market rallies. Investors interested in Harvest ETFs should consider how these strategies align with their income needs, risk tolerance, and investment horizon.
SYMBOL
NAME
FUND INCEPTION DATE
HHL.TO
Harvest Healthcare Leaders Income ETF
Mar 9, 2020
HTA.TO
Harvest Tech Achievers Growth & Income ETF
May 25, 2015
HPF.TO
Harvest Energy Leaders Plus Income ETF
Oct 20, 2014
HBF.TO
Harvest Brand Leaders Plus Income ETF
Mar 9, 2020
HRIF.TO
Harvest Diversified Equity Income ETF
Apr 12, 2023
HUTL.TO
Harvest Equal Weight Global Utilities Income
Harvest Healthcare Leaders Income ETF (HHL)
Strategy & Holdings: HHL invests in 20 leading healthcare companies globally, aiming for equal weight distribution. The sector’s resilience and growth prospects make it attractive.
Performance & Risks: While healthcare is seen as a defensive sector, regulatory changes and rapid innovation can impact performance. Reviewing past performance and sector trends is key.
Name
Weight
Country
Agilent Technologies, Inc.
5.6%
United States
Boston Scientific Corporation
5.3%
United States
Danaher Corporation
5.3%
United States
Abbott Laboratories
5.2%
United States
Medtronic PLC
5.2%
United States
Thermo Fisher Scientific Inc.
5.2%
United States
UnitedHealth Group Incorporated
5.0%
United States
HTA – Harvest Tech Achievers Growth & Income ETF
Strategy & Holdings: Focusing on large-cap technology firms, HTA seeks growth and income. The technology sector offers high growth potential but comes with higher volatility.
Performance & Risks: The fast-paced nature of tech means quick gains but also significant risks. Investors should consider their appetite for risk and sector cycles.
Name
Weight
Country
CrowdStrike Holdings, Inc.
5.9%
United States
Salesforce, Inc.
5.6%
United States
ServiceNow, Inc.
5.3%
United States
Intuit Inc.
5.2%
United States
Motorola Solutions, Inc.
5.2%
United States
Synopsys, Inc.
5.2%
United States
Micron Technology, Inc.
5.0%
United States
Oracle Corporation
5.0%
United States
HPF – Harvest Energy Leaders Plus Income ETF
Strategy & Holdings: By investing in a diversified portfolio of the world’s largest energy companies, HPF aims for regular income and capital appreciation.
Performance & Risks: Energy markets are often volatile, influenced by geopolitical and environmental factors. While the sector can offer high returns, it can also present significant risks.
Name
Weight
Country
Phillips 66
5.7%
United States
Enbridge Inc.
5.5%
Canada
Pembina Pipeline Corporation
5.5%
Canada
TC Energy Corporation
5.5%
Canada
Canadian Natural Resources Limited
5.1%
Canada
Eni S.p.A.
5.1%
United States
TotalEnergies SE
5.1%
United States
HBF – Harvest Brand Leaders Plus Income ETF
Strategy & Holdings: HBF targets globally recognized brands, aiming for steady income and growth by investing in companies with strong brand value.
Performance & Risks: Well-known brands can provide stability, but shifts in consumer preferences and global economic conditions can affect performance.
Name
Weight
Country
JPMorgan Chase & Co.
5.2%
United States
Verizon Communications Inc.
5.2%
United States
Morgan Stanley
5.1%
United States
NIKE, Inc.
5.1%
United States
Alphabet Inc.
5.0%
United States
Costco Wholesale Corporation
5.0%
United States
United Parcel Service, Inc.
5.0%
United States
HRIF – Harvest Retirement Income ETF
Strategy & Holdings: Designed for retirement income, HRIF focuses on equities known for dividends and stability. It’s diversified across sectors to manage risk.
Performance & Risks: HRIF’s focus on income may appeal to retirees, but like all investments, it’s subject to market fluctuations and specific sector risks.
ETF Name
Weight
Sector
Harvest Brand Leaders Plus Income (HBF)
14.4%
Diversified
Harvest Equal Weight Global Utilities Income (HUTL)
14.3%
Utilities
Harvest Canadian Equity Income Leaders (HLIF)
14.0%
Diversified
Harvest Tech Achievers Growth & Income (HTA)
13.9%
Information Technology
Harvest US Bank Leaders Income (HUBL)
13.7%
US Banks
Harvest Healthcare Leaders Income (HHL)
13.4%
Health Care
Harvest Travel & Leisure Income (TRVI)
13.3%
Diversified
Harvest Premium Yield Treasury (HPYT)
2.7%
Government Bonds
HUTL – Harvest Equal Weight Global Utilities Income
The investment objective of the Harvest Equal Weight Global Utilities Income ETF is to provide investors with exposure to the defensive and income-generating characteristics typically associated with utility companies, while also seeking to minimize concentration risk and provide broader exposure to the global utility sector.
In simpler terms, the ETF aims to provide investors with a way to potentially make money by investing in a diversified portfolio of utility companies from around the world. Because utility companies provide essential services and are generally seen as stable and reliable, the ETF may be attractive to investors looking for a way to generate steady income and potentially reduce their investment risk.
The Harvest Equal Weight Global Utilities Income ETF is an investment fund that aims to help investors make money by investing in a diversified portfolio of utility companies from around the world, including Canada, the United States, Europe, and Asia.
Utility companies are businesses that provide essential services like electricity, water, and gas to homes and businesses. They are generally seen as stable and reliable because people need these services no matter what’s happening in the economy.
The ETF invests in a portfolio of utility stocks that is equally weighted. This helps to spread out the risk and make sure that no one company has too much influence over the performance.
Conclusion
When considering Harvest ETFs, it’s crucial to look at individual investment goals, risk tolerance, and the ETFs’ expense ratios and performance history. While Harvest’s offerings provide opportunities for income and sector-specific exposure, investors should be mindful of the inherent risks and market fluctuations. Diversification, even within a portfolio of ETFs, can help manage risk. Always consider consulting with a financial advisor to ensure that any investment aligns with your long-term financial objectives. Whether you’re drawn to the potential stability of healthcare, the rapid growth of technology, the dynamics of energy, or the resilience of global brands, understanding each sector’s nuances will guide you to make informed decisions. Happy and informed investing!
If you’re looking for stable income and a degree of capital preservation, chances are you’ve considered Canadian utility-focused Exchange Traded Funds (ETFs). Two popular options are ZWU and UMAX. Each offers exposure to this essential sector, but there are notable differences you’ll want to understand before investing.
What are ZWU and UMAX?
ZWU (BMO Covered Call Utilities ETF): ZWU seeks to mirror the Solactive Equal Weight Canada Utilities Index while using a covered call options strategy to enhance income. Its holdings comprise Canadian utility companies involved in power generation, transmission, and distribution.
UMAX (Hamilton Enhanced Utilities Yield Maximizer ETF): UMAX aims to give investors higher monthly income by investing in Canadian and US utilities and employing a similar covered call strategy. Unlike ZWU, UMAX also includes telecoms, pipelines, and railways within its ‘utilities’ definition.
Key Differences
Sector Exposure: The most significant difference is ZWU’s exclusive focus on traditional utilities, while UMAX broadens its scope. This broader exposure means UMAX may potentially offer slightly more diversification, but the flip side is greater volatility due to pipeline and railway companies being more sensitive to economic cycles.
Holdings: Because of their different focuses, the top holdings within ZWU and UMAX differ. ZWU’s top holdings are typically large, established Canadian power companies. In contrast, UMAX’s top stocks may include a mix of utilities and telecom companies.
Covered Call Strategy: UMAX vs ZWU
Both ETFs use covered calls to boost income, but their approaches differ slightly.
UMAX: This ETF allocates 50% of its portfolio and uses at-the-money (ATM) options. It offers a dividend yield of approximately 13%* and does not employ leverage.
ZWU: Similar to UMAX, ZWU also allocates 50% of its portfolio, but it utilizes out-of-the-money (OTM) options. It has a dividend yield of approximately 8.6% and does not employ leverage.
% potfolio
Option strategy
Divdend Yield approx
Leverage
UMAX
50%
ATM (Medium risk)
13%*
No
ZWU
50%
OTM (Low risk)
8.6%
No
Covered call strategy – ZWU vs UMAX
Table ATM vs OTM
Premium or option price
Risk
Reward
ITM (In the money call option) Stock price > Strike price
High
High
High
OTM (Out of the money call option) Stock price < Strike price
Typical expected result when writing a covered call option
Performance comparison
Historically, the performance of the two ETFs can vary depending on market conditions.
ZWU
UMAX
1M Total Return
1.49%
0.73%
6M Total Return
-0.10%
3.08%
1Y Total Return
-6.87%
3Y Total Return
0.57%
5Y Total Return
6.47%
Source: seeking alpha
VIEW RATINGS
Which Is Right for You?
Choosing the right ETF comes down to your personal preferences. ZWU provides a focused play on Canadian utilities, offering stability and a decent income stream. UMAX takes a broader approach, promising potentially higher income but with slightly increased risk. Consider your risk tolerance, your need for pure utility exposure, and carefully compare the income potential of each ETF before making a decision.
Disclaimer: I’m not a financial advisor. It’s always recommended to do your thorough research and consult a professional before making any investment decisions.
Let me know if you have other areas you want me to focus on or any specific questions about these ETFs!
Executive summary VFV vs XIU
In summary, VFV and XIU, with their distinct features and strengths, can be complementary components in building a diversified investment portfolio that spans both the U.S. and Canadian markets. The combination offers a strategic approach to balancing risk and capitalizing on the opportunities presented by the North American economic landscape. Additionally, XIU’s dividend yield and its inclusion of Dividend Aristocrat stocks further enhance its appeal for income-focused investors.
VFV:
Objective: VFV focuses on mirroring the performance of the S&P 500 Index, providing exposure to the 500 largest U.S. companies.
Low Fees: VFV is known for its cost-effectiveness, boasting a management expense ratio (MER) of just 0.08%. With $6.5 billion in assets under management (AUM) and high daily trading volume, VFV is a highly liquid and widely traded ETF.
Currency Fluctuations: As a Canadian-domiciled U.S. ETF, VFV is not currency hedged. This means its value can fluctuate based on the CAD-USD exchange rate. When the USD appreciates vs. the CAD, VFV gains additional value, and vice versa. Over time, these fluctuations tend to even out.
Global Diversification: VFV provides global diversification through its exposure to U.S. large-cap stocks, including technology giants like Apple, Microsoft, and Amazon.
Buffett’s Favorite Index: It’s worth noting that the S&P 500 is Warren Buffett’s favorite index, reflecting its significance and reputation as a key indicator of the U.S. stock market.
XIU:
Objective: XIU seeks long-term capital growth by replicating the performance of the S&P/TSX 60 Index, net of expenses. It offers exposure to the 60 largest and most liquid stocks on the Toronto Stock Exchange (TSX), with a focus on established Canadian companies.
Pioneer Status: XIU holds historical significance as the oldest ETF in Canada, starting trading in 1990. With $11 billion in AUM and high liquidity, XIU remains a widely traded ETF in the Canadian market.
Sector Composition: The S&P/TSX 60, tracked by XIU, is more heavily weighted towards the financial and energy sectors compared to the S&P 500. This provides investors with a unique sectoral exposure, including major Canadian banks and energy companies.
Dividend Yield: XIU pays a respectable yield, thanks to its many underlying Dividend Aristocrat stocks in the energy, banking, telecom, and utilities sectors. The 12-month trailing yield currently stands at 2.41%, paid quarterly. Reinvesting this dividend can significantly boost your returns.
Investing in both VFV and XIU allows investors to create a balanced North American equity portfolio. VFV offers exposure to the dynamic U.S. market, while XIU provides stability through Canadian blue-chip stocks.
VFV’s global diversification and XIU’s sectoral focus on the Canadian market complement each other, contributing to a well-rounded and diversified investment strategy.
Diversified Portfolio:
Combining VFV and XIU leverages the strengths of both economies and markets, providing investors with a diversified portfolio that spans North America.
Investors can benefit from VFV’s low-cost structure and global exposure, along with XIU’s historical significance, liquidity, and focused exposure to the Canadian market.
Portfolio holdings
VFV
Holding Name
% of Market Value
Sector
Apple Inc.
6.94%
Computer Hardware
Microsoft Corp.
6.47%
Software
Amazon.com Inc.
3.19%
Diversified Retailers
NVIDIA Corp.
2.97%
Semiconductors
Alphabet Inc.
2.14%
Consumer Digital Services
Tesla Inc.
1.91%
Automobiles
Meta Platforms Inc.
1.84%
Consumer Digital Services
Alphabet Inc.
1.84%
Consumer Digital Services
Berkshire Hathaway Inc.
1.76%
Diversified Financial Services
Exxon Mobil Corp.
1.3%
Integrated Oil and Gas
XIU
Symbol
Name
Weight
RY
ROYAL BANK OF CANADA
6,90
TD
TORONTO DOMINION
6,40
CNQ
CANADIAN NATURAL RESOURCES LTD
4,39
ENB
ENBRIDGE INC
4,26
CP
CANADIAN PACIFIC KANSAS CITY LTD
4,06
CNR
CANADIAN NATIONAL RAILWAY
3,92
SHOP
SHOPIFY SUBORDINATE VOTING INC CLA
3,63
BMO
BANK OF MONTREAL
3,39
BNS
BANK OF NOVA SCOTIA
3,04
SU
SUNCOR ENERGY INC
2,72
In this post, we will discuss a popular ETF: XIT iShares S&P/TSX Capped Information Technology Index, offered by Blackrock. XIT is an exchange-traded fund that focuses on the Canadian tech sector. We will review: investment objective, MER and Holdings. we will finally try to answer the question if XIT is the right fund for you.
Many investors are interested in the tech sector, but unless you are tech-savvy, it’s tough to understand the industry and pick your stocks. A safer way is to invest in a technology-focused exchange-traded fund. By doing this, you will:
reduce your overall risk,
save on fees as ETFs are an excellent substitute for mutual funds, which usually carry higher fees,
XIT seeks long-term capital growth by replicating the performance of the S&P/TSX Capped Information Technology Index, net of expenses. The index tracked includes exclusively Canadian companies. In total, this ETF invest in 24 Canadian technology stocks. There is a 25% cap put in place to avoid over exposure to a particular stock.
XIT MER and Asset under management
Management Fee
0.55%
Management Expense Ratio (MER)
0.61%
The management expense ratio for XIT is 0.61%. This is the total of all fees including management fees and administration fees.
XIT ETF asset under management:
Symbol
AUM in M
XIT
643
In millions
XIT Dividends
XIT is an ETF focused on capital growth. The dividend yield is 0.02%. It’s not ideal for investors looking to build a dividend portfolio.
Thanks to Shopify, XIT had a great run in the past years. However, since the beginning of the year, the tech sector was hit hard by recent market volatility.
As you can see above, Shopify and Constellation software make up to 50% of XIT. Even with the cap in place, the fund does not offer true diversification.
XIT Sector allocation
Sector
Weight %
Application Software
49.09
Internet Services & Infrastructure
25.34
IT Consulting & Other Services
13.60
Data Processing & Outsourced Services
6.01
Systems Software
4.39
Communications Equip.
0.81
Electronic Manufacturing Sces
0.71
Cash and/or Derivatives
0.03
Conclusion
Choosing if XIT is the right ETF for you comes to answering the questions below:
Am I looking for an ETF that invests exclusively in Canadian tech stocks? If the answer is Yes, then XIT is a good fit for your portfolio. If you are open to investing in US companies, then other options are available. I would recommend particularly ETFs that track the Nasdaq 100. These ETFs offer better diversification and include some household names in the tech industry.
If you are looking for an ETF that invests in various sectors, then I would recommend a global index ETF or an all in one ETF. See below some suggestions:
Are you comfortable with the medium to a high level of volatility? Tech stock offers significant growth opportunities but also carries some risk and inherent fluctuations. In all cases, your portfolio should be diversified across various sectors. Putting all your money in the tech industry is risky.
Are you a big fan of Shopify and Constellation software? Shopify and constellation software make up to 50% of XIT’s fund. So, buying XIT is in a sense investing mainly in these two stocks.
Introduction:
In the ever-evolving landscape of real estate investment, Residential Real Estate Investment Trusts (REITs) in Canada have emerged as a lucrative avenue for investors seeking stability and returns. As the demand for quality housing continues to rise, identifying the best residential REIT becomes crucial. In this comprehensive guide, we delve into the intricacies of financial ratios to help investors make informed decisions and spotlight the top contenders in the Canadian residential REIT sector.
Understanding Residential REITs:
Residential REITs, also known as apartment or multifamily REITs, specialize in owning and managing residential properties. Their revenue streams primarily come from rental income, making them an attractive option for investors looking for steady cash flow. When evaluating the best residential REITs in Canada, it’s essential to consider key financial ratios that provide insights into their financial health and potential for growth.
Morguard North American Residential REIT (MRG-UN.TO) has the highest trailing annual dividend yield at 5.37%, followed closely by European Residential REIT (ERE-UN.TO) at 5.38%. A higher dividend yield can be attractive for income-focused investors.
Market Cap:
Canadian Apartment Properties REIT (CAR-UN.TO) has the largest market cap at $7.69B, indicating its significant size and stability in the market.
Boardwalk REIT (BEI-UN.TO) and Morguard North American Residential REIT (MRG-UN.TO) have positive and relatively high free cash flows, indicating their ability to generate cash from core operations.
Debt/Equity Ratio:
InterRent REIT (IIP-UN.TO) and Canadian Apartment Properties REIT (CAR-UN.TO) have comparatively lower Debt/Equity Ratios, suggesting a more balanced capital structure. On the other hand, European Residential REIT (ERE-UN.TO) has a significantly higher ratio, indicating higher financial leverage.
Total Cash per Share:
Boardwalk REIT (BEI-UN.TO) and Morguard North American Residential REIT (MRG-UN.TO) stand out with higher total cash per share, indicating a stronger liquidity position.
Top Residential REITs in Canada:
Canadian Apartment Properties REIT (CAR-UN): CAPREIT has garnered attention for its impressive dividend yield and stable occupancy rates. The REIT’s strategic focus on urban centers and commitment to property enhancements positions it as a strong contender in the residential REIT landscape.
Boardwalk REIT (BEI-UN): BRE’s emphasis on community-building and tenant satisfaction has contributed to its sustained success. With a well-balanced debt-to-equity ratio and a history of prudent financial management, BRE offers investors a combination of stability and growth potential.
Exploring Financial Ratios:
Funds from Operations (FFO): FFO is a critical metric for evaluating the performance of REITs. It represents the cash generated by a REIT’s core operations and is a reliable indicator of its ability to sustain and grow dividends. Investors should prioritize REITs with a consistent and growing FFO.
Price-to-Earnings (P/E) Ratio: The P/E ratio compares a REIT’s share price to its earnings per share. A lower P/E ratio may indicate that a REIT is undervalued, presenting an opportunity for investors. However, it’s essential to consider other factors alongside the P/E ratio for a comprehensive analysis.
Dividend Yield: For income-focused investors, the dividend yield is a crucial metric. It represents the annual dividend income as a percentage of the REIT’s current share price. A sustainable and growing dividend yield reflects the REIT’s ability to provide consistent returns to investors.
Debt-to-Equity Ratio: Assessing a REIT’s leverage is vital for understanding its financial risk. A lower debt-to-equity ratio suggests a healthier balance between debt and equity, indicating a more secure financial position.
Occupancy Rates: High occupancy rates are indicative of a strong demand for a REIT’s residential properties. Investors should look for REITs with consistently high occupancy rates, as this directly influences rental income and overall financial performance.
Conclusion:
Choosing the best residential REIT in Canada requires a meticulous examination of financial ratios and a deep understanding of market dynamics. Investors should prioritize REITs with a proven track record of financial prudence, sustainable dividend growth, and a strategic approach to property management. By focusing on key metrics like FFO, P/E ratio, dividend yield, debt-to-equity ratio, and occupancy rates, investors can make informed decisions to optimize their real estate investment portfolios and unlock long-term success in the Canadian residential REIT sector.
In this article, we will review the best Canadian index ETFs. I have only selected the most popular ETFs in Canada with a minimum asset under management of 3 billion dollars. First, we will go over some definitions, the pros and cons of holding an index ETF. After that, we will compare the selected ETFs to help you identify the best ETF in 2024 that meets your expectations. Note: if you are looking for the best index ETFs that replicate the performance of the American stock exchanges, please refer to this article: Best S&P 500 Index ETFs in Canada.
Is an index ETF the best choice for investors?
Index funds are a popular choice for investors due to their simplicity, low cost, and overall solid performance. Here are a few reasons why investors often choose to invest in index funds:
Diversification: Index funds are designed to track a specific market index, such as the S&P 500 or the Dow Jones Industrial Average. This means the fund’s portfolio is diversified and includes stocks from many different companies, spread across various sectors and industries.
Low management fees: Index funds are generally cheaper to manage than actively managed funds, as they require less research and analysis. This results in lower management fees, meaning investors can keep a larger portion of their returns.
Solid performance: Although index funds don’t necessarily beat the market, they tend to closely follow the performance of the index they track. Therefore, investors can benefit from market growth without having to worry about picking the right individual stocks. It’s also worth mentioning that it’s rare for active fund managers to beat the index!
Accessibility: Index funds are easily accessible to investors of all levels, from beginners to experienced investors. They can be purchased through an online broker, a financial advisor, or even directly from the fund management company.
Does a TSX Index fund pay dividend?
Yes they do. Since Index ETFs holds all shares of companies part of the index, if these companies pay dividends then a dividend will be distributed. See below the performance table, the dividend yield is included.
Index definition
The S&P/TSX Capped Composite Index
is a comprehensive measure of the Canadian equities market, encompassing over 200 of Canada’s highest-ranking stocks. This wide-ranging index covers approximately 95% of the nation’s equity market by capitalization. To be included and remain in the Index, constituent securities must meet specific criteria, including minimum requirements for float-adjusted market capitalization and liquidity. To ensure diversification and minimize concentration risk, individual stock weights are limited to a maximum of 10% of the Index’s total float-adjusted market capitalization. These weightings are evaluated and adjusted on a quarterly basis to reflect market changes.
The S&P/TSX 60 Index
focuses on the 60 largest and most influential companies listed on the Toronto Stock Exchange (TSX). By including only the top-tier companies, the S&P/TSX 60 offers investors a snapshot of the health and performance of Canada’s leading corporate entities, spanning various industries.
The FTSE Canada All Cap Index
provides a broad perspective on the Canadian market by including large-, mid-, and small-cap companies. As a market-capitalization-weighted index, it reflects the performance of a wide spectrum of Canadian businesses, offering a comprehensive view of the country’s economic landscape. This inclusivity makes the FTSE Canada All Cap Index a valuable tool for investors seeking exposure to the entire Canadian equity market, from the largest conglomerates to emerging enterprises.
Given that these are index ETFs, it’s understandable that their performance figures are closely aligned. Index ETFs are designed to mirror the performance of a specific market index, which means their returns are often similar, especially when they track indices within the same market, such as the Canadian equity market. This tight performance range reflects the inherent nature of index ETFs to replicate the movements of their respective indices, resulting in similar growth patterns and returns for investors. The slight variations in their performance can be attributed to differences in their specific index targets, expense ratios, and the efficiency of their tracking mechanisms. This characteristic of index ETFs makes them a favored choice for investors seeking diversified exposure to a particular market segment with the expectation of returns that closely follow the market’s overall performance.
The notable aspect of HXT.TO, an index ETF, lies in its appeal to investors who prioritize capital appreciation over direct dividend payouts. Unlike traditional ETFs that distribute dividends to shareholders, HXT.TO automatically reinvests these dividends back into the fund. This feature is particularly advantageous for investors looking for a compounding effect on their investments without the immediate income from dividends.
-Low MER: Because Index ETFs are a passive style of investment, they do not require an active manager. This is why the cost to operate an Index ETF is cheaper than say an Actively managed ETF. Low MER means you will benefit more from the returns the funds makes;
-Investing in a index fund has proven to be a great strategy in the long term (if you have more than 5 years horizon).
Cons:
-Index ETFs are volatile since they are tied directly to the performance of a stock exchange. Exchanges tend to rally quickly on a glimpse of good economic news but also fall sharply when investors are pessimistic about the near term. This is why it’s important when you buy an index ETF to keep it for the long run and not short term.
-Some investors prefer to have control over their investments and cherry pick stocks. Obviously, this is not possible under an index fund which basically holds all stocks part of the index without any pre-selection process.
Ishares S&P TSX 60 Index ETF (XIU.TO)
iShares S&P/TSX 60 Index ETF as its’ name implies, it’s a fund that invests in 60 largest companies that are members of the TSX. It’s the most popular ETF in Canada with 10 Billion dollars in Assets. This ETF is representative of the Canadian economy which is dominated by the Energy and Financial sector as you can see below n the sector allocation table.
The number of holdings for the ETF is 60. It has the highest MER in the list but this did not really impact its long term performance in comparison with the other funds.
XIU Holdings
Name
Weight %
ROYAL BANK OF CANADA
7.94
SHOPIFY SUBORDINATE VOTING INC CLA
7.37
TORONTO DOMINION
7.07
BANK OF NOVA SCOTIA
4.35
ENBRIDGE INC
4.28
CANADIAN NATIONAL RAILWAY
4.22
BROOKFIELD ASSET MANAGEMENT INC CL
3.76
BANK OF MONTREAL
3.68
CANADIAN IMPERIAL BANK OF COMMERCE
2.87
CANADIAN PACIFIC RAILWAY LTD
2.86
Please consult issuers’ website for up-to-date data / best etf canada 2024
XIC Sector allocation
Sector
Weight %
Financials
35.90
Energy
14.30
Materials
10.70
Information Technology
10.69
Industrials
9.89
Communication
5.84
Consumer Discretionary
4.16
Consumer Staples
3.61
Utilities
3.16
Health Care
0.84
Please consult issuers’ website for up-to-date data / Best Canada ETF 2023
Ishares Core S&P TSX Capped Comp ETF (XIC.TO)
Seeks long-term capital growth by replicating the performance of the S&P®/TSX® Capped Composite Index, net of expenses. While XIU has 60 holdings in total, XIC is much larger with 219 Canadian companies. In terms of performance both XIU and XIC are quite close. XIC has a lower MER 0.06% in comparison to XIU at 0.18%. This fund is dominated by Energy and Financial companies which is the same case for XIU.
XIC Ishares Core S&P TSX Capped Comp ETF Holdings
Name
Weight %
ROYAL BANK OF CANADA
6,24
SHOPIFY SUBORDINATE VOTING INC CLA
5,79
TORONTO DOMINION
5,55
BANK OF NOVA SCOTIA
3,42
ENBRIDGE INC
3,36
CANADIAN NATIONAL RAILWAY
3,31
BROOKFIELD ASSET MANAGEMENT INC CL
2,95
BANK OF MONTREAL
2,89
CANADIAN IMPERIAL BANK OF COMMERCE
2,26
CANADIAN PACIFIC RAILWAY LTD
2,24
Please consult issuers’ website for up-to-date data / best etf canada 2024
Please consult issuers’ website for up-to-date data
BMO S&P TSX Capped Comp ETF (ZCN.TO)
ZCN is the third contender in this list of Best Index ETFs in Canada. The BMO S&P/TSX Capped Composite Index ETF (ZCN) has been designed to replicate, to the extent possible, the performance of the S&P/TSX Capped Composite Index (Index), net of expenses. Both ZCN and XIC are quite similar. They both track the S&P/TSX Capped Composite index.
ZCN BMO S&P TSX Capped Comp ETF Holdings
Weight (%)
Name
6.23%
ROYAL BANK OF CANADA
5.79%
SHOPIFY INC
5.55%
TORONTO-DOMINION BANK/THE
3.42%
BANK OF NOVA SCOTIA/THE
3.36%
ENBRIDGE INC
3.31%
CANADIAN NATIONAL RAILWAY CO
2.95%
BROOKFIELD ASSET MANAGEMENT INC
2.89%
BANK OF MONTREAL
2.26%
CANADIAN IMPERIAL BANK OF COMMERCE
2.24%
CANADIAN PACIFIC RAILWAY LTD
Please consult issuers’ website for up-to-date data
Please consult issuers’ website for up-to-date data
Vanguard FTSE Canada All Cap ETF (VCN)
Vanguard FTSE Canada All Cap Index ETF seeks to track the performance of a broad Canadian equity index that measures the investment return of large-, mid- and small-capitalization, publicly traded securities in the Canadian market.
VCN Vanguard FTSE Canada All Cap ETF Holdings
Name
Weight
Royal Bank of Canada(RY)
6.37%
Shopify Inc. Class A(SHOP)
6.13%
Toronto-Dominion Bank(TD)
5.82%
Enbridge Inc.(ENB)
3.66%
Bank of Nova Scotia(BNS)
3.60%
Canadian National Railway Co.(CNR)
3.59%
Brookfield Asset Management Inc. Class A(BAM.A)
2.84%
Bank of Montreal(BMO)
2.83%
Canadian Pacific Railway Ltd.(CP)
2.37%
TC Energy Corp.(TRP)
2.26%
Please consult issuers’ website for up-to-date data
Horizons S&P/TSX 60™ INDEX – HXT
HXT has the same strategy as XIU, ie to replicate the S & P / TSX 60 index which is made up of the 60 largest Canadian companies.
HXT Holdings
Name
Weight
SHOPIFY INC
8.99%
ROYAL BANK OF CANADA
7.86%
TORONTO-DOMINION BANK/THE
6.95%
ENBRIDGE INC
4.42%
BANK OF NOVA SCOTIA/THE
4.30%
CANADIAN NATIONAL RAILWAY CO
4.07%
BROOKFIELD ASSET MANAGEMENT INC
3.90%
BANK OF MONTREAL
3.61%
CANADIAN PACIFIC RAILWAY LTD
2.79%
CANADIAN IMPERIAL BANK OF COMMERCE
2.78%
Please consult issuers’ website for up-to-date data
HXT sector allocation
Financials (35.50%)
Energy (14.13%)
Information Technology (12.49%)
Materials (10.00%)Industrials (9.72%)
Communication Services (5.80%)
Consumer Discretionary (4.06%)
Consumer Staples (3.57%)
Utilities (3.14%)
Health Care (0.81%)
Real Estate (0.77%)
VCN Vanguard FTSE Canada All Cap ETF Sector allocation
Sector
Fund
Financials
33.5%
Energy
13.2%
Basic Materials
11.3%
Technology
10.1%
Industrials
9.4%
Consumer Discretionary
6.3%
Utilities
5.8%
Telecommunications
4.8%
Real Estate
2.3%
Consumer Staples
2.2%
Health Care
1.1%
Please consult issuers’ website for up-to-date data
The data on this website is for your information only. It does not constitute investment advice, or advice on tax or legal matters. Any information provided on this website does not constitute investment advice or investment recommendation nor does it constitute an offer to buy or sell or a solicitation of an offer to buy or sell shares or units in any of the investment funds or other financial instruments described on this website. Should you have any doubts about the meaning of the information provided herein, please contact your financial advisor or any other independent professional advisor.
In the ever-evolving landscape of ETFs, two heavyweights have caught the attention of Canadian investors: iShares NASDAQ 100 Hedged to CAD ETF (TSX:XQQ) and BMO NASDAQ 100 Equity Index ETF (CAD-Hedged) (TSX:ZQQ). Both of these ETFs offer a ticket to the tech-heavy NASDAQ 100 Index, a realm dominated by the giants of the non-financial world. (XQQ vs ZQQ)
Enter XQQ and ZQQ, brought to the stage by BlackRock and BMO Global Asset Management, respectively, both offering low-cost, high-liquidity options for investors seeking NASDAQ 100 exposure.
XQQ vs. ZQQ: Fees – A Stalemate
When it comes to fees, it’s a neck-and-neck race. Both XQQ and ZQQ share an identical management expense ratio (MER) of 0.39%. In the financial realm, this means that for every $10,000 invested, you’re looking at an annual fee of $39, making this category a draw between the two contenders.
Size is a crucial factor in the world of ETFs, influencing liquidity, trading volume, and overall stability. XQQ flaunts assets under management (AUM) totaling $2 billion, outmuscling ZQQ, which stands strong with AUM at $1.4 billion. While both are substantial for the buy-and-hold investor, XQQ takes the lead as the more popular choice among Canadian investors.
Holdings: Tracking the Titans
XQQ and ZQQ share a common mission: tracking the NASDAQ 100 Index, home to the top 100 non-financial companies on the NASDAQ exchange. It’s a playground for mega-cap growth stocks, heavily leaning towards the technology and telecommunications sectors.
Both ETFs implement currency hedging to mitigate the impact of CAD-USD fluctuations. However, the real-world application introduces some tracking error, creating a performance drag compared to the index. With identical MERs and performance, the choice between XQQ and ZQQ boils down to personal preference rather than a significant difference in AUM.
ZQQ and XQQ present nearly identical returns with only a negligible variance. Given that both ETFs closely follow the NASDAQ 100 index, this slight difference is expected. While tracking errors may contribute to this minimal discrepancy, there’s no need for concern. Over the long term, the performance of these two ETFs is anticipated to align closely with that of the NASDAQ 100, ensuring a consistently similar trajectory.
The NASDAQ 100: A Rollercoaster with Rewards
Despite the high volatility of the NASDAQ 100, opportunistic investors view it as a chance to buy high-value stocks at a discount. XQQ and ZQQ serve as gateways to this potentially lucrative market, offering a chance for investors to ride the tech wave when bargains will come by.
In conclusion, whether you opt for XQQ or ZQQ, you’re securing a piece of the tech pie. Both ETFs are well-positioned to capitalize on the NASDAQ 100’s eventual rebound. So, pick the one that resonates with you.
The BMO Covered Call Utilities ETF is an investment fund that aims to provide investors with exposure to a diversified portfolio of Canadian utility companies. The ETF aims to achieve two main goals:
Provide investors with regular income payments every month, similar to receiving rent from a property you own.
Provide investors with the opportunity to grow their investment over time through capital appreciation, which means that the value of their investment can potentially increase.
To achieve these goals, the ETF invests primarily in Canadian utility companies, which are companies that provide essential services like electricity, water, and gas. Additionally, the ETF uses a strategy called “covered call,” which involves selling options on some of the stocks in its portfolio to generate extra income.
What’s unique about this ETF is that it uses covered calls to protect against downside risk. This being said, the covered call strategy provides limited downside protection. Also, when you write a covered call, you give up some of the stock’s potential gains. These ETFs will tend to have a higher yield and a lower performance.
ZWU is an excellent option for conservative investors looking for a steady income, moderate volatility and exposure to the Utility sector.
Summary table Risk vs Benefits of a covered call strategy
Aspect
Description
Strategy
Selling call options on a security already owned in the portfolio
Name
Covered call strategy
Risk
Potential for limited upside if the stock price rises above the strike price
Benefit
Generates additional income through premium payments received from selling call options
Goal
To earn income from stock holdings while potentially reducing downside risk
Use
Often used by investors who are willing to sell their stock at a certain price if it reaches that level
Outcome
If the stock price stays below the strike price, the option expires worthless, and the investor keeps the premium payment. If the stock price rises above the strike price, the option buyer may exercise their right to buy the stock, and the investor must sell the stock at the strike price, but still keeps the premium payment.
– Total return: Though the focus here is on the dividend yield, you have to keep in mind the total return. The profit or loss we make on any investment combines both dividend income and capital gain or loss. Looking at the long-term performance of the fund is crucial. An ETF that provides a good capital appreciation with a high dividend yield is preferable.
–Diversification: A diversified ETF is always a safer option. Some high yield ETFs are sector-specific (Financials, Energy or Gold). The ones focused on Energy and Gold have had an inferior long-term performance and carry high volatility risk.
–Volume and liquidity of the ETF. The higher the asset under management, the lower the trading costs of the ETF (difference between the bid and ask price).
ZWU Dividend history
Distrib Period
Ex-Div Date
Pay Date
Total Distrib
January 2023
January 27, 2023
February 02, 2023
0.080000
February 2023
February 24, 2023
March 02, 2023
0.080000
March 2023
March 29, 2023
April 04, 2023
0.080000
April 2023
April 26, 2023
May 02, 2023
0.080000
May 2023
May 30, 2023
June 05, 2023
–
ZWU ETF Holdings
Weight (%)
Name
Ticker
5.51%
FORTIS INC/CANADA
FTS
5.51%
BMO EQUAL WEIGHT UTILITIES INDEX ETF
ZUT
5.49%
BCE INC
BCE
5.13%
ENBRIDGE INC
ENB
5.09%
PEMBINA PIPELINE CORP
PPL
4.98%
PPL CORP
PPL
4.90%
DUKE ENERGY CORP
DUK
4.86%
TC ENERGY CORP
TRP
Consult issuers’ website for up-to-date data
ZWU Sector and geographic allocation
Sector
Allocation
Utilities
55.60%
Communication Services
23.42%
Energy
20.98%
This table shows that the ETF has the highest allocation of its investments (55.60%) in the utilities sector, followed by communication services (23.42%), and energy (20.98%).
Country
Allocation
Canada
65.52%
United States
34.41%
This table shows that the ETF has a majority of its investments (65.52%) in Canadian utility companies, while also holding investments (34.41%) in utility companies located in the United States.