
VEE ETF Investment objective
For Canadian investors seeking to diversify their portfolio, the Vanguard FTSE Emerging Markets All Cap Index ETF offers a valuable opportunity. This ETF aims to mirror the performance of a comprehensive emerging markets index, including the rapidly growing Chinese A Inclusion market. It provides exposure to a wide spectrum of companies, encompassing large, mid-sized, and small-cap stocks, all within emerging markets. By investing directly or indirectly in these assets, Canadian investors can enhance their portfolio’s diversification and tap into the potential growth opportunities presented by emerging markets.


FTSE Emerging Markets All Cap China A Inclusion Index
The FTSE Emerging Markets All Cap China A Inclusion Index is a market-capitalization weighted index that tracks the performance of stocks across various market segments, including large, mid, and small-cap stocks within emerging markets.
The FTSE Emerging Markets All Cap China A Inclusion Index encompasses a diverse set of attributes, making it a compelling option for investors. With a substantial number of constituents totaling 4,535, this index provides broad exposure to emerging market opportunities. The impressive Net Market Capitalization (USDm) of 7,051,011 demonstrates the significant market value represented within the index.
Moreover, the index showcases an attractive dividend yield of 2.78%, offering the potential for income generation. When examining constituent sizes, the index maintains a healthy level of diversity. The average constituent size, at 1,555 USDm, signifies a well-rounded mix of companies, while the largest constituent, at 413,744 USDm, adds stability without overwhelming the index. Even the smallest constituent at 3 USDm contributes to the index’s inclusivity.
The median size of 298 USDm further emphasizes the balanced nature of the index’s constituents. Additionally, the weight of the largest constituent, comprising 5.87% of the index, remains reasonable, preventing an excessive concentration of risk.
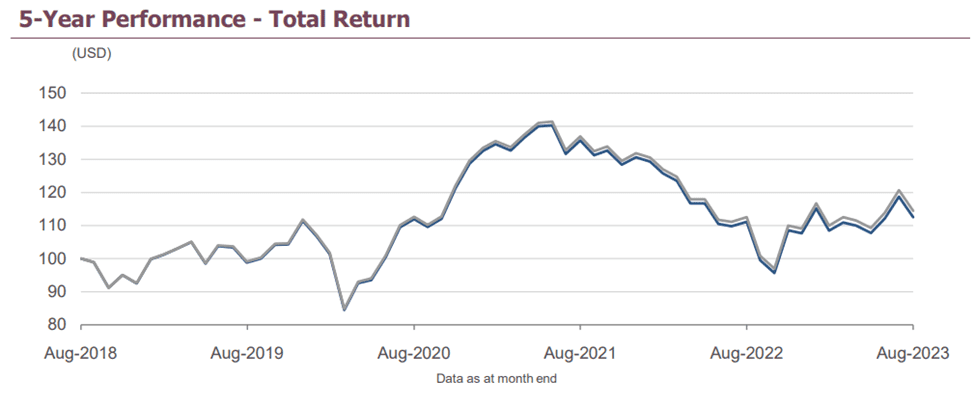
Performance comparison with similar ETFs
[stock_market_widget type=”table-quotes” template=”color-header-border” color=”#5679FF” assets=”VEE.TO,XEC.TO,ZEM.TO” fields=”symbol,ytd_return,three_year_average_return,five_year_average_return” links=”{‘VEE.TO’:{},’XEC.TO’:{},’ZEM.TO’:{}}” display_header=”true” display_chart=”false” display_currency_symbol=”true” pagination=”true” search=”false” rows_per_page=”5″ sort_field=”logo_name_symbol” sort_direction=”asc” alignment=”left” api=”yf”]
[stock_market_widget type=”table-quotes” template=”color-header-border” color=”#5679FF” assets=”VEE.TO,XEC.TO,ZEM.TO” fields=”symbol,name,fund_inception_date” links=”{‘VEE.TO’:{},’XEC.TO’:{},’ZEM.TO’:{}}” display_header=”true” display_chart=”false” display_currency_symbol=”true” pagination=”true” search=”false” rows_per_page=”5″ sort_field=”logo_name_symbol” sort_direction=”asc” alignment=”left” api=”yf”]
Comparing VDY vs XEI: Unraveling the Superior High Dividend ETF for Canadian Investors
Portfolio by Size (VEE ETF)
| Captalization | Fund | Benchmark | +/- Weight |
| Large | 54.38% | 23.50% | + 30.88% |
| Medium/Large | 5.94% | 17.30% | − 11.36% |
| Medium | 18.09% | 26.00% | − 7.91% |
| Medium/Small | 8.76% | 23.30% | − 14.54% |
| Small | 11.16% | 9.00% | + 2.16% |
Sector allocation
| Sector | Fund | Benchmark | +/- Weight |
| Technology | 22.8% | 22.42% | |
| Financials | 20.72% | 20.8% | |
| Consumer Discretionary | 13.72% | 13.68% | |
| Industrials | 8.71% | 9.05% | |
| Basic Materials | 7.39% | 7.43% | |
| Consumer Staples | 6.22% | 6.25% | |
| Energy | 6.08% | 5.95% | |
| Health Care | 4.25% | 4.26% | |
| Telecommunications | 3.87% | 3.9% | |
| Utilities | 3.28% | 3.28% | |
| Real Estate | 2.97% | 2.93% | |
| Other | 0.0% | 0.07% | |
| Total | 100.0% | 100.0% |
Portfolio of holding VEE ETF
| Holding Name | % of Market Value | Sector | Market Allocation | Market Value | Shares |
| Taiwan Semiconductor Manufacturing Co. Ltd. | 4.86% | Semiconductors | TW | $80,644,477.88 | 3,473,418 |
| Tencent Holdings Ltd. | 3.52% | Consumer Digital Services | KY | $58,318,056.15 | 1,041,501 |
| Alibaba Group Holding Ltd. | 2.72% | Diversified Retailers | KY | $45,117,442.08 | 2,876,980 |
| MKTLIQ | 1.52% | — | US | $25,147,482.10 | 186,131 |
| SLBBH1142 | 1.42% | — | US | $23,491,343.76 | 173,873 |
| Reliance Industries Ltd. | 1.33% | Oil Refining and Marketing | IN | $21,980,769.27 | 559,966 |
| Meituan | 1.2% | Consumer Digital Services | KY | $19,941,283.74 | 891,780 |
- Best Canadian Bank ETFs for Monthly Income: A Complete 2026 Comparison
- SPXE: Harvest SpaceX Enhanced High Income Shares ETF — Complete Review
- MSTE ETF Explained: What Every Investor Should Understand Before Chasing a 70% Yield
- QDTE ETF Explained: Is Roundhill’s 0DTE Covered Call Strategy Right for Your Portfolio?
- Beyond Nvidia: 10 AI Stocks Powering the Artificial Intelligence Revolution
- ZWB ETF Review 2026: Is BMO’s Covered Call Bank ETF Still Worth Buying?
- The 10 Best Growth ETFs (Canada/USA)
- Top 7 Weekly-Paying ETFs Ranked for 2026 (Full Comparison)