

Investment objective
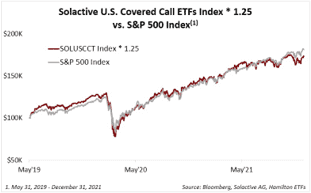
HYLD is a passive index ETF that uses a covered call strategy to enhance yield. It seeks to replicate a 1.25 times multiple of the Solactive U.S. Covered Call ETFs Index TR (SOLUSCCT), comprised of 7 higher-yielding U.S.-focused covered call ETFs.

List of funds that make up HYLD
| TICKER | NAME |
| JEPQ | JPMorgan Nasdaq Equity Premium Income ETF |
| JEPI | JPMorgan Equity Premium Income ETF |
| QQCC | Horizons NASDAQ-100 Covered Call ETF |
| USCC | Horizons US Large Cap Equity Covered Call ETF |
| HHL | Harvest Healthcare Leaders Income ETF |
| XYLD | Global X S&P 500 Covered Call ETF |
| QYLD | Global X NASDAQ 100 Covered Call ETF |
| RYLD | Global X Russell 2000 Covered Call ETF |
| GLCC | Horizons Gold Producer Equity Covered Call ETF |
| NXF | CI Energy Giants Covered Call ETF |
The fund is available for purchase in CAD-Hedged (HYLD) and USD-Unhedged (HYLD.U). The main idea behind HYLD ETF is to offer investors a higher yielding alternative to the S&P 500 with similar volatility (as per Hamilton’s website). It’s important to note we are talking here about ‘higher yielding’ alternative and not similar or higher performance that the S&P 500.
Covered call ETF usually protect against downside risk. This being said, the covered call strategy provides limited downside protection. Also, when you write a covered call, you give up some of the stock’s potential gains. Covered call ETFs will tend to have a higher yield and a lower performance that the portfolio they track.
Why covered call ETFs are popular?
Covered call ETFs are very popular with Canadian investors. Some of these ETFs managers have billions of dollars under management. Two reasons push investors towards covered call ETFs:
High dividend yield: thanks to the premiums earned when writing call options, the manager under certain conditions can earn premiums and enhance distributions;
Low volatility. Writing a call option is a conservative strategy aimed at reducing volatility;
Great for passive income: if you’re main objective is to achieve high dividend yields and build passive income, then covered call ETFs are a good option. But, remember the high dividend yield comes at a price which very low growth potential.
Summary table Risk vs Benefits of a covered call strategy
| Aspect | Description |
|---|---|
| Strategy | Selling call options on a security already owned in the portfolio |
| Name | Covered call strategy |
| Risk | Potential for limited upside if the stock price rises above the strike price |
| Benefit | Generates additional income through premium payments received from selling call options |
| Goal | To earn income from stock holdings while potentially reducing downside risk |
| Use | Often used by investors who are willing to sell their stock at a certain price if it reaches that level |
| Outcome | If the stock price stays below the strike price, the option expires worthless, and the investor keeps the premium payment. If the stock price rises above the strike price, the option buyer may exercise their right to buy the stock, and the investor must sell the stock at the strike price, but still keeps the premium payment. |
Best US Dividend ETFs in Canada!
MER and AUM: HYLD vs ZWH and ZWK
In the table below, we will compare HYLD with 2 strong competitors ZWH BMO US High Dividend Covered Call and ZWK ZWK -BMO Covered Call US Banks. Both ZWH and ZWK write call options to enhance yield and they are both invested in US markets.
| Name-Ticker | AUM | Manag fee |
|---|---|---|
| HYLD – Hamilton Enhanced U.S. Covered Call ETF | 145 | 0.65 |
| ZWH –BMO US High Dividend Covered Call | 918 | 0.65 |
| ZWK -BMO Covered Call US Banks | 697 | 0.65 |
Source: Barchart
All three ETFs have similar MER. However, I believe that HYLD is more expensive considering it’s ‘an index’ ETF, while ZWK and ZWH from BMO are actively managed.
Performance: HYLD vs ZWH and ZWK
[stock_market_widget type=”table-quotes” template=”color-header-border” color=”#5679FF” assets=”HYLD.TO,ZWH.TO,ZWK.TO” fields=”symbol,ytd_return,three_year_average_return,five_year_average_return” links=”{‘HYLD.TO’:{},’ZWH.TO’:{},’ZWK.TO’:{}}” display_header=”true” display_chart=”false” display_currency_symbol=”true” pagination=”true” search=”false” rows_per_page=”5″ sort_field=”logo_name_symbol” sort_direction=”asc” alignment=”left” api=”yf”]
updated daily
| ETF | Div Yield |
|---|---|
| HYLD | 11.76 |
| ZWH | 5.81 |
| ZWK | 7.56 |
Source: Yahoo Finance
[stock_market_widget type=”table-quotes” template=”basic” assets=”HYLD.TO” fields=”name,symbol,price,change_pct,52_week_low,52_week_high” links=”{‘HYLD.TO’:{}}” display_header=”true” display_chart=”true” display_currency_symbol=”true” pagination=”true” search=”false” rows_per_page=”5″ sort_field=”logo_name_symbol” sort_direction=”asc” alignment=”left” api=”yf”]
HYLD Monthly Dividend distribution
| Amount | Frequency | Ex-Div Date | Record Date | Pay Date | Declare Date |
|---|---|---|---|---|---|
| 0.1310 | Monthly | 3/27/2024 | 3/28/2024 | 4/5/2024 | 3/21/2024 |
| 0.1310 | Monthly | 2/28/2024 | 2/29/2024 | 3/7/2024 | 2/22/2024 |
| 0.1210 | Monthly | 1/30/2024 | 1/31/2024 | 2/9/2024 | 1/23/2024 |
HYLD ETF Holdings
| TICKER | NAME | WEIGHT |
| JEPQ | JPMorgan Nasdaq Equity Premium Income ETF | 15.1% |
| JEPI | JPMorgan Equity Premium Income ETF | 14.2% |
| QQCC | Horizons NASDAQ-100 Covered Call ETF | 13.5% |
| USCC | Horizons US Large Cap Equity Covered Call ETF | 13.5% |
| HHL | Harvest Healthcare Leaders Income ETF | 10.4% |
| XYLD | Global X S&P 500 Covered Call ETF | 9.9% |
| QYLD | Global X NASDAQ 100 Covered Call ETF | 7.5% |
| RYLD | Global X Russell 2000 Covered Call ETF | 7.5% |
| GLCC | Horizons Gold Producer Equity Covered Call ETF | 6.3% |
| NXF | CI Energy Giants Covered Call ETF | 2.1% |
HYLD stock: Sector Allocation
█ Technology 23.5%
█ Health Care 18.7%
█ Consumer Discretionary 8.8%
█ Financials 5.8%
█ Communications 7.6%
█ Industrials 6.6%
█ Consumer Staples 5.5%
█ Energy 4.6%
█ Utilities 2.6%
█ Real Estate 2.0%
█ Materials 13.4%
Practice example: covered call strategy
An investor has 100 shares of Company A in his portfolio. Company A’s share is worth $ 30. He anticipates a stagnation or a slight drop in its price and he is ready to sell them at the price of 26 $. He decides to sell a call with the following characteristics:
• Exercise price: $ 26; Maturity: April; Option price: $ 4; Quantity: 100
He collects the following amount: 4 x 100 or 400 $ (premium)
Two cases should be distinguished:
CASE 1
Company A’s share price rose above the breakeven point of $ 30.
Break-even point = exercise price + premium = 26 + 4 = 30
The buyer of the option will choose to exercise his right to buy and, as the seller of the call, the seller will have to sell the shares at the strike price.
During this operation:
- the seller sold his shares for $ 26, which constitutes an acceptable loss for him.
- the seller collected the amount of the premium of $ 4, which helped boost the performance of his investments (yield).
CASE 2
Company A’s share price has fallen below the breakeven point of $ 30.
The buyer of the option will choose not to exercise his right to buy and the seller will not have to sell his shares.
Thanks to this operation, the seller keeps his shares in the portfolio and he collected the amount of the premium which generated an additional return.