In this article, we’ll conduct a comprehensive review of the Best 10 dividend ETFs in the United States for the year 2023. Our analysis will revolve around key metrics such as dividend yield, performance over a five-year span, and volatility. Within each ETF’s profile, we will offer insights into their investment objectives and holdings, providing you with a well-rounded perspective on these investment options.
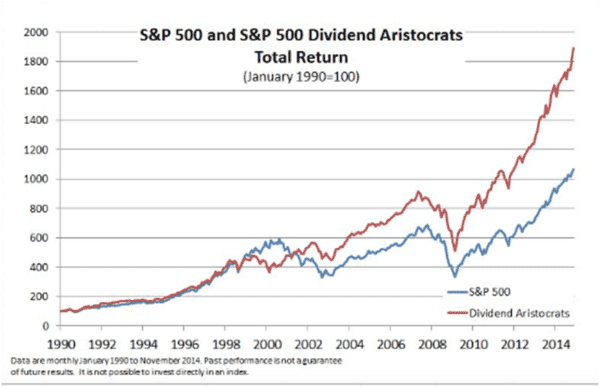
Best dividend stocks to buy – Dividend aristocrats 2023
Full list of ‘Dividend Kings’ stocks by sector – 2023
Best Dividend ETF 2023 (Top 10)
| Symbol | Name | Mgmnt Fee | AUM in B |
|---|---|---|---|
| VIG | Dividend Appreciation Vanguard | 0.06% | 66 |
| VYM | High Dividend Yield Vanguard | 0.06% | 45 |
| SCHD | Schwab US Dividend Equity | 0.06% | 34 |
| DGRO | Dividend Growth Ishares Core | 0.08% | 23 |
| DVY | Select Dividend Ishares | 0.38% | 22 |
| SDY | S&P Dividend SPDR | 0.35% | 21 |
| FVD | Value Line Dividend Idx FT | 0.70% | 12 |
| NOBL | S&P 500 Dividend Aristocrats | 0.35% | 10 |
| HDV | High Dividend Ishares Core | 0.08% | 9 |
| RDVY | Rising Dividend Achievers FT | 0.50% | 9 |
Performance comparison
[stock_market_widget type=”table-quotes” template=”color-header-border” color=”#5679FF” assets=”VIG,VYM,SCHD,DGRO,DVY,SDY,FVD,NOBL,HDV,RDVY” fields=”symbol,ytd_return,three_year_average_return,five_year_average_return” links=”{‘VIG’:{},’VYM’:{},’SCHD’:{},’DGRO’:{},’DVY’:{},’SDY’:{},’FVD’:{},’NOBL’:{},’HDV’:{},’RDVY’:{}}” display_header=”true” display_chart=”false” display_currency_symbol=”true” pagination=”true” search=”false” rows_per_page=”12″ sort_field=”logo_name_symbol” sort_direction=”asc” alignment=”left” api=”yf”]
Among the 10 dividend ETFs compared, let’s take a closer look at the three best-performing ones based on their 5-year average returns:
RDVY (6.56% YTD, 14.89% 3-year avg, 9.61% 5-year avg): RDVY stands out as a top performer, delivering an impressive 9.61% average return over the past 5 years. This ETF has also shown robust performance year-to-date. Investors seeking consistent growth and dividend income may find RDVY particularly attractive.
VIG (5.29% YTD, 9.79% 3-year avg, 9.12% 5-year avg): VIG is another strong contender, offering a competitive 9.12% average return over the past 5 years. Despite a slightly lower YTD return compared to RDVY, VIG has demonstrated stability and a solid track record, making it a reliable choice for income-focused investors.
SCHD (-2.89% YTD, 13.12% 3-year avg, 9.50% 5-year avg): Despite a negative YTD return, SCHD has posted an impressive 9.50% average return over the last 5 years. This ETF’s 3-year average return of 13.12% is particularly noteworthy, suggesting resilience and strong dividend performance over the medium term.

Dividend yield comparison
| Symbol | Div Yield |
|---|---|
| VIG | 1.78% |
| VYM | 2.76% |
| SCHD | 2.88% |
| DGRO | 2.04% |
| DVY | 2.91% |
| SDY | 2.59% |
| FVD | 1.81% |
| NOBL | 1.92% |
| HDV | 3.14% |
| RDVY | 1.21% |
HDV offers the highest dividend yield among the top 10 Dividend ETFs selected.
VIG – Dividend Appreciation Vanguard
VIG, short for the Vanguard Dividend Appreciation ETF, is strategically designed to invest in businesses with a strong track record of consistently increasing dividends over time. This impressive exchange-traded fund (ETF) meticulously tracks the S&P U.S. Dividend Growers Index, which is renowned for featuring companies committed to shareholder value through consistent dividend growth.
One noteworthy characteristic of VIG is its emphasis on large-cap stocks. The ETF predominantly allocates its investments to established, industry-leading companies with substantial market capitalization. This focus on large-cap stocks not only provides stability and reliability but also aligns with the fund’s core objective of delivering long-term dividend growth to its investors. Furthermore, VIG’s comprehensive portfolio is curated to capture the potential for sustained income and capital appreciation, making it an attractive choice for investors seeking a blend of stability and income potential in their portfolios.
VIG Holdings
| HOLDINGS | % OF FUNDS |
|---|---|
| Microsoft Corp. (MSFT) | 4.09% |
| UnitedHealth Group Inc. (UNH) | 3.69% |
| Johnson & Johnson (JNJ) | 3.58% |
| JPMorgan Chase & Co. (JPM) | 3.09% |
| Procter & Gamble Co. (PG) | 2.84% |
VYM – High Dividend Yield Vanguard
VYM, the Vanguard High Dividend Yield ETF, is an investment option that focuses on common stocks of companies known for their relatively high dividend yields. It tracks the FTSE High Dividend Yield Index, which includes companies recognized for their consistent dividend payouts.
Primarily, VYM invests in large-cap equities, emphasizing stability within its portfolio. This approach aims to align with investors seeking well-established companies with substantial market capitalization. Additionally, VYM places an emphasis on selecting stocks with above-average dividend yields. This approach may appeal to investors looking to enhance their income potential while maintaining exposure to the typically stable large-cap equity segment. In summary, VYM offers a diversified approach to achieve financial goals, striking a balance between capital appreciation and income generation.
VYM Holdings
| HOLDINGS | % OF FUNDS |
|---|---|
| Johnson & Johnson (JNJ) | 3.13% |
| JPMorgan Chase & Co. (JPM) | 2.68% |
| Procter & Gamble Co. (PG) | 2.47% |
| Exxon Mobil Corp. (XOM) | 2.35% |
| Chevron Corp. (CVX) | 2.11% |
SCHD – Schwab US Dividend Equity
VYM, or the Vanguard High Dividend Yield ETF, is an investment option that focuses on common stocks of companies recognized for their relatively high dividend yields. It closely tracks the performance of the FTSE High Dividend Yield Index, known for including companies with a history of consistent dividend distributions.
The primary strategy of VYM is to invest in large-cap equities, which can provide stability and reliability within its portfolio. This approach caters to investors who value well-established companies with substantial market capitalization.
Additionally, VYM places an emphasis on selecting stocks with above-average dividend yields, making it potentially attractive to investors seeking to enhance their income potential. This balanced approach, offering a mix of capital appreciation and income generation, positions VYM as a diversified tool for pursuing various financial objectives.
SCHD holdings
| Symbol | Name | Percent of Assets (%) |
|---|---|---|
| MRK | MERCK & CO INC | 4.26% |
| PEP | PEPSICO INC | 4.23% |
| KO | COCA-COLA | 4.22% |
| AMGN | AMGEN INC | 4.21% |
| PFE | PFIZER INC | 4.19% |
DGRO – Dividend Growth Ishares Core
DGRO invests in U.S. equities with a history of consistently growing dividends. The fund manager aims also to provide a diversified investments across various sectors. Also, the sustainability of the dividendes is a key factor in the selection process.
DGRO Holdings
| Ticker | Name | Weight % |
|---|---|---|
| JNJ | JOHNSON & JOHNSON | 2.86 |
| PFE | PFIZER INC | 2.86 |
| MSFT | MICROSOFT CORP | 2.84 |
| AAPL | APPLE INC | 2.81 |
| PG | PROCTER & GAMBLE | 2.62 |
| JPM | JPMORGAN CHASE & CO | 2.56 |
| MRK | MERCK & CO INC | 2.28 |
| KO | COCA-COLA | 2.10 |
| HD | HOME DEPOT INC | 1.95 |
| PEP | PEPSICO INC | 1.90 |
DVY – Select Dividend Ishares
DVY invests in high dividend paying U.S. equities. Most of the portfolio is made of large cap stocks. The investment approach used the following conditions:
- Consistent history of dividends
- At least 5-year records of paying dividends
DVY Holdings
| Ticker | Name | Weight % |
|---|---|---|
| MO | ALTRIA GROUP INC | 2.51 |
| OKE | ONEOK INC | 2.03 |
| VLO | VALERO ENERGY CORP | 1.87 |
| IBM | INTERNATIONAL BUSINESS MACHINES CO | 1.78 |
| PM | PHILIP MORRIS INTERNATIONAL INC | 1.78 |
SDY – S&P Dividend SPDR
SDY invests in companies that have consistently increased their dividend for at least 20 consecutive years. The aim is to provide not only income but also growth. The stocks are weighted within the portfolio by yield.
SDY Holdings
| Name | Weight |
|---|---|
| Exxon Mobil Corporation | 2.82% |
| Chevron Corporation | 2.50% |
| AbbVie Inc. | 2.08% |
| International Business Machines Corporation | 1.96% |
| South Jersey Industries Inc. | 1.93% |
FVD – Value Line Dividend Idx FT
FVD is an index ETF that tracks the Value Line® Dividend Index. Value Line® selects companies with a higher than average dividend yield. There is a mimimum market capitalization of less than $1 billion for any stock selected.
As you can see below, each equity part of this ETF has the same weight (around 0.53%).
FVD Holdings
| Holding | Percent |
| Entergy Corporation | 0.54% |
| Exelon Corporation | 0.54% |
| General Mills, Inc. | 0.54% |
| Archer-Daniels-Midland Company | 0.53% |
| AT&T Inc. | 0.53% |
| Crown Castle International Corp. | 0.53% |
| Kellogg Company | 0.53% |
| Merck & Co., Inc. | 0.53% |
| Public Storage | 0.53% |
| Rogers Communications Inc. (Class B) | 0.53% |
NOBL – S&P 500 Dividend Aristocrats
NOBL invests in the S&P 500® Dividend Aristocrats® Index. The index includes businesses that have raised dividends for at least 25 consecutive years.
NOBL Holdings
| Weight | Ticker | Description |
|---|---|---|
| 2.66% | NUE | NUCOR CORP |
| 2.16% | ADM | ARCHER-DANIELS-MIDLAND CO |
| 2.07% | CVX | CHEVRON CORP |
| 1.90% | CAH | CARDINAL HEALTH INC |
| 1.88% | ABBV | ABBVIE INC |
| 1.85% | XOM | EXXON MOBIL CORP |
| 1.83% | ED | CONSOLIDATED EDISON INC |
| 1.81% | CINF | CINCINNATI FINANCIAL CORP |
HDV – High Dividend Ishares Core
HDV invests in high dividend paying U.S. equities. The stocks part of the portfolio have been screened for financial health.
HDV Holdings
| Ticker | Name | Weight % |
|---|---|---|
| XOM | EXXON MOBIL CORP | 7.77 |
| ABBV | ABBVIE INC | 6.74 |
| JNJ | JOHNSON & JOHNSON | 5.83 |
| CVX | CHEVRON CORP | 5.55 |
| JPM | JPMORGAN CHASE & CO | 5.49 |
| VZ | VERIZON COMMUNICATIONS INC | 5.28 |
| PG | PROCTER & GAMBLE | 4.41 |
| PM | PHILIP MORRIS INTERNATIONAL INC | 4.15 |
RDVY – Rising Dividend Achievers FT
RDVY is an index ETF that meticulously tracks the NASDAQ US Rising Dividend Achievers Index (the “Index”). The underlying index adheres to a distinctive approach, which can be summarized as follows:
Firstly, it excludes Real Estate Investment Trusts (REITs), aiming to focus on a diversified selection of companies from various sectors.
To be considered for inclusion, a stock must meet specific criteria, including a minimum trading volume of $5 million, a track record of paying growing dividends, and a history of increasing earnings. Additionally, these selected companies should have a low pay-out-ratio, not exceeding 65%, indicating that they retain a significant portion of their earnings for growth and stability. Furthermore, a high Cash to Debt ratio, greater than 50%, is required, underscoring the importance of financial health and liquidity. Lastly, to ensure diversification, the index limits exposure to any single sector to a maximum of 30%, promoting a well-balanced investment approach across various industries and reducing sector-specific risks.
RDVY Holdings
| Holding | Percent |
| Archer-Daniels-Midland Company | 2.41% |
| Corteva Inc. | 2.29% |
| Anthem, Inc. | 2.26% |
| Cincinnati Financial Corporation | 2.26% |
| EOG Resources, Inc. | 2.22% |
| Pioneer Natural Resources Company | 2.22% |
| The Allstate Corporation | 2.21% |
| UnitedHealth Group Incorporated | 2.21% |
| Humana Inc. | 2.19% |
| Aflac Incorporated | 2.17% |