Since its launch in 2021, HDIV has become one of Canada’s most talked-about income ETFs. Its promise: deliver stable monthly income with lower volatility than the Canadian market, while giving investors access to multiple key sectors through an actively managed, covered call strategy.

With a distribution yield of around 12%, HDIV is built for investors seeking consistent cash flow rather than maximum capital appreciation. This makes it especially appealing for retirees, income-oriented investors, and anyone looking to balance returns with risk management.
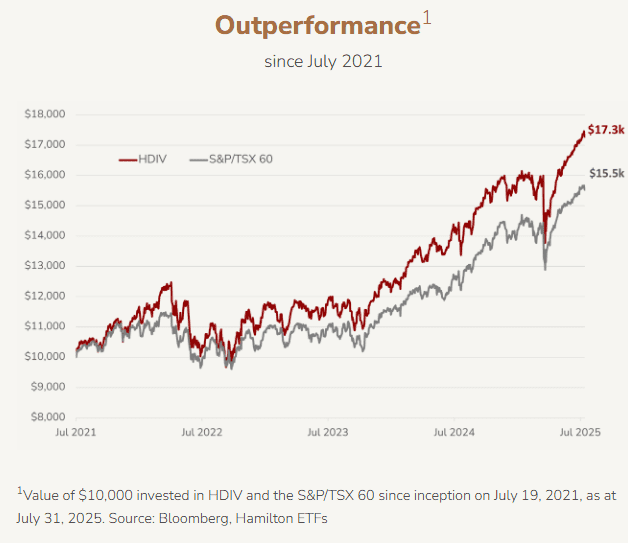
Recent Performance
Since inception, HDIV has outperformed the S&P/TSX 60 Index. For example, between July 2021 and July 2025, a $10,000 investment in HDIV grew to $17,300, compared to $15,500 for the S&P/TSX 60.
This outperformance is largely explained by the ETF’s ability to consistently add option premiums to the dividends already paid by the underlying securities. While HDIV does cap upside during strong bull markets (a natural tradeoff with covered call strategies), it has shown resilience in volatile periods, providing investors with steady income even in challenging environments.
Structure and Strategy
HDIV is a fund of funds: it doesn’t buy stocks directly but invests in a suite of Hamilton ETFs, each of which applies a covered call strategy.
Covered calls generate option premiums on top of dividends, significantly boosting income.
Sector diversification spans Canadian banks, energy, utilities, gold, technology, and healthcare — giving broader exposure than the traditional Canadian market, which is heavily concentrated in financials and energy.
Leverage (25%) is used to enhance yields. The fund’s leverage is capped at 125% of NAV, keeping it within a moderate range.
Monthly distributions are a core feature, providing reliable cash flow.
Sector Allocation (July 2025)
Financials: 36%
Technology: 17%
Energy: 13%
Gold: 12%
Utilities: 14%
Healthcare & others: ~8%
This allocation blends defensive sectors (banks, utilities, gold) with growth engines (technology, healthcare), creating a balanced income-oriented portfolio.
Fees (MER)
As of July 2025, HDIV’s Management Expense Ratio (MER) is 2.55%.
It’s important to note that the fund itself charges no direct management fee. The MER reflects operating expenses + the fees of the underlying Hamilton ETFs.
While this is high compared to traditional index ETFs, it is in line with other derivative-based income strategies and justified by the complexity of managing covered call positions and sector exposure.
✅ Advantages of HDIV
High and stable monthly income: with a 12% yield, it meets the needs of retirees and cash flow-focused investors.
Broader diversification: exposure to sectors like technology and healthcare helps reduce Canada’s natural concentration in banks and energy.
Lower volatility: option premiums cushion downturns, reducing overall volatility compared to the market.
Moderate leverage: enhances yield while remaining controlled.
Reliable cash flow: monthly payouts align with investors’ income needs.
Turnkey solution: instead of managing multiple sector-specific covered call ETFs, investors can access them all through HDIV.
⚠️ Risks and Limitations
Capped upside: in strong bull markets, HDIV will underperform broad indices due to options limiting gains.
Leverage risk: while moderate, the 25% leverage amplifies both gains and losses.
Sector concentration: despite diversification, exposure to banks and energy remains significant.
High fees (2.55% MER): part of the income goes to covering costs.
Market risk: covered calls cushion declines but don’t eliminate losses in prolonged downturns.
Interest rate sensitivity: like many income products, HDIV may face pressure when rates rise.
Reinvesting vs. Taking Distributions (DRIP or Cash)
Income-oriented investors (e.g., retirees) may prefer taking cash distributions to fund expenses.
Growth-focused investors may choose to reinvest via a Dividend Reinvestment Plan (DRIP), compounding returns over time.
The choice depends on your goals: immediate income or long-term wealth building.
🎯 Conclusion
HDIV is a unique Canadian ETF that combines high income, sector diversification, and covered call strategies into a single product. It is best suited for conservative and income-focused investors who value stability and cash flow over growth.
That said, investors must be aware of its tradeoffs: capped upside in bull markets, higher fees, and modest leverage risks.
👉 In short: HDIV is an excellent passive income tool, ideal for generating monthly cash flow and stabilizing a portfolio, but less suitable for maximizing long-term capital growth.