The Vanguard FTSE Developed All Cap ex North America Index ETF (ticker: VIU.TO) is a popular choice for investors seeking broad exposure to developed markets outside of North America. This ETF, offered by Vanguard Canada, is designed for investors looking to diversify their portfolios internationally. Let’s delve into what makes VIU.TO a noteworthy option.
VIU.TO aims to track the performance of the FTSE Developed All Cap ex North America Index. It provides exposure to large-, mid-, and small-cap companies in developed markets, excluding the United States and Canada.
Investment Strategy
VIU.TO employs a passive management strategy, aiming to replicate the performance of its benchmark index. This includes investments across Europe, Asia, and Australia, providing a diversified international exposure. The strategy is suitable for investors looking to complement their North American holdings.
Performance Analysis
The performance of VIU.TO, compared to similar ETFs like XEC.TO, ZEA.TO, and VEE.TO, shows a strong and consistent pattern:
VIU.TO has shown a respectable performance with a YTD return of 13.54%, a 3-year average return of 4.42%, and a 5-year average return of 6.85%. This indicates steady growth and resilience over varying market conditions.
With a Management Expense Ratio of 0.23%, VIU.TO is competitively priced compared to similar ETFs. It’s important to consider these fees, as they can impact long-term returns. There are no significant transaction costs outside of the usual brokerage fees.
Actual Management Fee
0.20%
Actual Mgmt. Expense Ratio (MER)
0.23%
Holdings and Sector Allocation
VIU.TO’s top holdings typically include major companies in sectors like financials, healthcare, and technology. The ETF’s broad sector allocation aligns with its strategy to provide diversified exposure across various industries in developed markets.
Country
Fund
Japan
23.9%
United Kingdom
14.6%
France
9.8%
Switzerland
8.5%
Germany
7.4%
Australia
7.3%
Holding Name
% of Market Value
Sector
Novo Nordisk A/S
1.72%
Pharmaceuticals
Nestle SA
1.65%
Food Products
ASML Holding NV
1.35%
Production Technology Equipment
Samsung Electronics Co. Ltd.
1.35%
Telecommunications Equipment
Shell plc
1.24%
Integrated Oil and Gas
Tax Considerations
For Canadian investors, foreign dividend income from VIU.TO is subject to withholding tax. However, this can be partially offset in taxable accounts. It’s advisable to consult with a tax professional for personalized advice.
Liquidity and Trading
VIU.TO is characterized by a high trading volume and a narrow bid-ask spread, making it easily tradable. This liquidity is a plus for investors looking for flexibility and ease in managing their investments.
Pros and Cons
Pros:
Diversification across developed international markets
Low fees compared to actively managed international funds
Strong liquidity
Cons:
Exposure to currency risk and geopolitical uncertainties
Potentially lower growth compared to emerging markets
Who Should Consider This ETF?
VIU.TO is ideal for long-term investors seeking international diversification in developed markets. It can complement a portfolio heavily weighted in North American stocks, offering a balance and potentially reducing overall portfolio risk.
Conclusion
Vanguard’s VIU.TO offers a cost-effective and diversified way to invest in international developed markets. While it comes with its set of risks, its advantages make it an attractive option for suitable investors. As always, it’s crucial to align any investment with your overall portfolio strategy and risk tolerance.
BMO Canadian Dividend ZDV ETF focuses on companies that demonstrate a track record of dividend growth. With a diversified portfolio, the fund maintains a large number of holdings while allocating a maximum of 5% per position. This investment strategy aims to capture the potential for consistent dividend payments and capital appreciation.
Source: TD Market research, Beta is measure of volatility over 5 years period. The higher the Beta / The higher the volatility. A beta of 1 means the stock or ETF is as volatile as the TSX.
– Total return: Though the focus here is on the dividend yield, you have to keep in mind the total return. The profit or loss we make on any investment combines both dividend income and capital gain or loss. Looking at the long-term performance of the fund is crucial. An ETF that provides a good capital appreciation with a high dividend yield is preferable.
–Diversification: A diversified ETF is always a safer option. Some high yield ETFs are sector-specific (Financials, Energy or Gold). The ones focused on Energy and Gold have had an inferior long-term performance and carry high volatility risk.
–Volume and liquidity of the ETF. The higher the asset under management, the lower the trading costs of the ETF (difference between the bid and ask price).
–Management expense ratio.
Is HTA a good investment?
Investors seeking consistent monthly income with exposure to the dynamic tech sector may find Harvest Tech Achievers Growth & Income (HTA ETF) appealing. This investment suits income-oriented individuals who value the monthly dividend payouts, especially with an attractive yield of around 10%. The covered call strategy employed by HTA, while enhancing income potential, may have shortcomings. Investors who prioritize capital appreciation over income may find the strategy limiting, as it involves selling call options on underlying stocks, capping potential gains in exchange for premium income. Additionally, during periods of rapid market ascent, the covered call strategy may result in missed opportunities for substantial profit participation. Therefore, while HTA caters to income-focused investors, those seeking aggressive capital growth might explore alternative strategies.
How had Covered call ETF’s performed historically?
In historical contexts characterized by bear markets, range-bound markets, and moderate bull markets, a covered call strategy has typically demonstrated the ability to outperform its underlying securities. However, during robust bull markets, when the underlying securities experience frequent rises beyond their strike prices, covered call strategies have historically exhibited slower growth. Nevertheless, even in these bullish phases, investors typically realize moderate capital appreciation alongside the accrual of dividends and call premiums.
One of the most popular high interest ETFs in Canada is CSAV CI High Interest Savings ETF. In this post, we will discuss CSAV’s objective, Fees and historical performance. We will also compare CSAV with similar ETFs.
What’s a High interest savings ETF?
High interest savings ETF are financial instruments designed to give investors a means to save capital while earning a competitive interest rate. Furthermore, they can provide investors with better returns than typical savings accounts or money market funds (while maintaining a high level of liquidity and safety, one of their main benefits).
High interest savings ETFs are often seen as relatively low-risk investments, in contrast to stocks or other types of investments.
CSAV investment objective
CSAV is relatively low risk investment suitable for investors looking for an alternative to high interest deposit accounts.
You can click on the ticker of each ETF to visit the issuer’s website. Please note the dividend yield shown on the issuers’ websites corresponds to the forward dividend yield. The latter is a projection based on the last dividend paid.
The trailing dividend yield shown in the table above is the dividend yield calculated using the dividend paid in the last 350 days.
GIC vs High interest saving ETFs
Investment Option
GIC
High-Interest Savings ETF
Type of Investment
Low-risk
Low to moderate risk
Return
Guaranteed fixed rate of return
Potentially higher rate of return
Term
Typically 1 to 5 years
No fixed term
Interest Rate
Typically higher than savings accounts
Varies depending on market conditions
Risk
Very low risk
Higher risk than GICs
Guarantee
Guaranteed by the issuing institution
No guarantee of return
Suitability
Suitable for risk-averse investors
Suitable for those seeking higher returns with moderate risk toleranc
Difference between Forward and Trailing dividend yield
Forward dividend yield and trailing dividend yield are both measures of a company’s dividend payout to its shareholders, but they differ in the time period used to calculate them.
Trailing dividend yield is calculated based on the dividends paid over the past 12 months, divided by the current stock price. It provides an indication of how much a company has paid out in dividends over the past year, relative to its current stock price.
Forward dividend yield, on the other hand, is calculated based on the expected dividends that will be paid out in the future, divided by the current stock price. It provides an indication of how much a company is expected to pay out in dividends over the next 12 months, relative to its current stock price.
The main difference between the two is that forward dividend yield is a projection of what is expected to happen in the future, whereas trailing dividend yield is based on actual historical data. As a result, forward dividend yield can be more speculative and less reliable than trailing dividend yield.
Investors may use both measures in combination to get a more complete picture of a company’s dividend payout.
Technology plays a fundamental role in driving innovation and transforming industries in today’s rapidly evolving world. Capitalizing on the technology sector’s growth potential can be a prudent strategy for an investor. One way to achieve this exposure is by allocating a portion of your portfolio to Technology Exchange-Traded Funds (ETFs). This article discusses the best Technology focused ETFs available in Canada. We will also cover two of the most popular Technology ETF in the US.
Advantages of owning a Technology ETF
Diversification and Risk Mitigation
Allocating to Technology ETFs provides diversification benefits, as they typically hold a basket of tech stocks from various sub-sectors. By spreading your investments across multiple companies, you reduce the impact of any stock’s performance on your portfolio. The tech industry encompasses various sectors, such as software, hardware, e-commerce, and biotechnology, offering diverse growth opportunities. This diversification helps mitigate risk and shields your portfolio from potential volatility in individual technology stocks.
Capitalizing on Growth Potential
Technology ETFs offer an opportunity to tap into the growth potential of the tech sector. With advancements like artificial intelligence, cloud computing, and the Internet of Things (IoT) driving innovation, technology companies have a strong growth trajectory. By allocating to Technology ETFs, you position yourself to benefit from this growth, as the ETFs hold a diversified portfolio of tech stocks well-positioned to capitalize on industry trends and disruptive technologies.
Access to Expertise and Research
Investing in Technology ETFs allows you to leverage the expertise of professional fund managers and their research capabilities. These managers are responsible for selecting and managing the underlying portfolio of tech stocks within the ETF. They conduct in-depth analysis, monitor industry trends, and make informed investment decisions on behalf of the fund. By investing in a Technology ETF, you gain exposure to their research-driven investment strategies, benefiting from their knowledge and experience in the tech sector.
Convenience and Cost Efficiency
Technology ETFs offer convenience and cost efficiency to investors. This especially true for Index ETFs tracking the Nasdaq 100.
Potential for Dividends and Income
Some Technology ETFs also offer the potential for dividends and income. While the technology sector is often associated with growth stocks, certain companies pay dividends. By investing in dividend-focused Technology ETFs, you can benefit from both capital appreciation and regular income generation, enhancing the total return of your portfolio.
Why most Technology ETFs track the Nasdaq 100?
The NASDAQ-100 is an index that represents the performance of the top 100 non-financial companies listed on the NASDAQ stock exchange. It is one of the most widely followed stock market indices and includes companies from various sectors such as technology, consumer services, healthcare, and more.
The NASDAQ-100 is known for its heavy weighting towards technology companies, which has earned it the reputation of being a technology-focused index. Many of the world’s largest and most innovative technology companies, such as Apple, Microsoft, Amazon, and Alphabet (Google), are included in the index.
The index is market capitalization-weighted, meaning that the companies with the largest market values have a greater influence on its performance. This gives investors exposure to leading companies in the technology and other sectors, making it an attractive benchmark and investment option.
The NASDAQ-100 has historically shown strong growth and has been driven by the rapid advancement of technology and the increasing reliance on technology in various aspects of our lives. However, it’s important to note that investing in the NASDAQ-100 carries risks, especially during times of market volatility or sector-specific downturns.
Overall, the NASDAQ-100 provides investors with an opportunity to track and invest in a diverse range of leading technology and non-financial companies, making it a popular choice for those seeking exposure to the growth potential of the tech sector and other innovative industries.
VGT – Vanguard Information Technology Index Fund (US)
The fund invests in information technology companies.
It invests in growth and value stocks across different market capitalizations.
The goal is to track the performance of the MSCI US Investable Market Index (IMI)/Information Technology 25/50. It aims to replicate the target index, which consists of stocks from large, mid-size, and small U.S. companies in the information technology sector.
The objective of the TEC ETF in Canada is to provide investors with exposure to the performance of the technology sector. By investing in the TEC ETF, investors have the opportunity to participate in the growth and potential returns of technology companies. These companies operate in various areas within the technology sector, including software, hardware, internet, telecommunications, and other related industries.
The TEC ETF seeks to offer investors exposure to both established companies and emerging players in the sector.
TXF invests in an an equal weight basis in a portfolio of equity securities of at least the 25 largest technology companies measured by market capitalization listed on a North American stock exchange. The fund uses a covered call strategy to both:
Lower volatility
Increase distributions. This fund pays a quarterly cash distribution which included both dividends and premiums earned by issuing call options.
The companies included in the portfolio of the ETF may be changed based on the Portfolio Manager’s opinion about how easily their stocks and call options can be bought or sold. The decision is made by considering the market value of these companies.
XIT seeks long-term capital growth by replicating the performance of the S&P/TSX Capped Information Technology Index, net of expenses. The index tracked includes exclusively Canadian companies. In total, this ETF invest in 24 Canadian technology stocks. There is a 25% cap put in place to avoid over exposure to a particular stock.
HTA is an ETF that invests in an equally weighted portfolio of 20 large-cap technology companies (globally). In order to generate an enhanced monthly distribution yield, an active covered call strategy is engaged.
Covered call strategies are great as they generate additional income for investors (in the form of premiums). The strategy is somewhat conservative and aims at preserving the capital invested primarily. On the other hand, the strategy limits potential growth.
The iShares PHLX SemiconductorETF (SOXX) is a popular investment choice for those looking to gain exposure to the semiconductor industry. This ETF aims to track the performance of the PHLX Semiconductor Sector Index, which includes companies primarily involved in the design, distribution, manufacture, and sale of semiconductors. Below, we explore the key aspects of SOXX, its performance, and why it might be a suitable addition to your investment portfolio.
Overview of SOXX
Fund Objective: The primary objective of the iShares Semiconductor ETF (SOXX) is to provide investment results that correspond generally to the price and yield performance, before fees and expenses, of the PHLX Semiconductor Sector Index.
Holdings: The ETF comprises a diversified portfolio of semiconductor companies, including well-known names like NVIDIA, Intel, and Texas Instruments. This broad exposure helps mitigate the risk associated with investing in individual stocks.
Expense Ratio: The expense ratio for SOXX is 0.46%, which is relatively low considering the specialized nature of the fund. This makes it a cost-effective way to invest in the semiconductor sector.
Why Invest in SOXX?
Growth Potential: The semiconductor industry is at the heart of technological advancements. Semiconductors are essential components in a wide range of devices, from smartphones to advanced computing systems. As technology continues to evolve, the demand for semiconductors is expected to rise, driving growth for companies in this sector.
Diversification: Investing in SOXX provides exposure to a broad range of companies within the semiconductor industry. This diversification reduces the risk associated with investing in individual stocks, as the performance of the ETF is not overly reliant on any single company.
Accessibility: ETFs like SOXX offer an easy and cost-effective way for investors to gain exposure to international semiconductor companies. Instead of buying individual stocks, investors can purchase shares of SOXX to gain a diversified exposure to the sector.
Historical Performance: SOXX has demonstrated strong historical performance, reflecting the overall growth of the semiconductor industry. Its past returns indicate its potential for future growth, making it an attractive option for investors looking to capitalize on the semiconductor boom.
The iShares Semiconductor ETF (SOXX) includes several key players in the industry:
NVIDIA (NVDA): A leading designer of GPUs, critical for gaming, AI, and data centers.
Intel Corporation (INTC): A dominant force in the CPU market, providing processors for personal computers and servers.
Texas Instruments (TXN): Known for its analog and embedded processing products, which are vital for various electronic devices.
These holdings represent some of the most innovative and influential companies in the semiconductor sector.
Conclusion
The iShares Semiconductor ETF (SOXX) offers investors a robust and diversified way to invest in the semiconductor industry. With its strong performance, low expense ratio, and exposure to leading semiconductor companies, SOXX is an excellent option for those looking to benefit from the growth of this critical sector. As always, consider your investment goals and risk tolerance before investing.
In this post, we will compare the best Canadian REITsETF available in Canada. First, we will discuss the benefits of owning this type of investments. Then, for each ETF, we will provide the fund’s objective, MER, holdings, historical performance and dividend distribution.
What’s a REIT
Real Estate Investment Trusts (REITs) are specialized companies that engage in owning, operating, or financing properties that generate income. These trusts have a diverse range of investments, encompassing various types of properties. This includes apartment buildings, data centers, hotels, medical facilities, offices, retail centers, cell towers, and warehouses.
While REITs can be privately held, the majority are publicly traded entities. This accessibility allows investors to easily purchase shares of real estate investment trusts on the Toronto Stock Exchange. Canadian REITs have garnered popularity for several compelling reasons.
Firstly, they provide a means of diversification in an investment portfolio. The unique nature of real estate assets typically shows a low correlation with other asset classes, making them a valuable addition. Furthermore, REITs are often seen as a natural hedge against inflation. Lastly, they offer a steady and stable source of income. The bulk of REIT revenues is derived from rent payments from tenants occupying their buildings and properties. This form of income tends to be more stable than revenues from other commercial activities, adding to the attractiveness of REITs as an investment option.
What’s an REIT ETF
It’s an exchange trader fund that invests primarily in a portfolio of REITs. The manager of the ETF can either track a REIT index, pursue an active strategy or a mix of both.
Canadian REITs ETF are great as they offer a low cost way to get exposure to large number of REITs. The holder of a REIT ETF can benefit from diversification which lowers the overall risk.
What to look for in a REIT ETF
When looking for the Best Canadian REITs ETF, please make sure to check for the criteria’s below:
Sector allocation matters in REIT ETF. Investors should check whether the ETF invests in various sectors. The idea is to avoid REITs that are overly exposed to one type of properties. Generally speaking, a mix of industrial, retail and residential is appreciated.
The performance of these ETFs shows a range of outcomes, with some experiencing growth and others witnessing declines, particularly in the short term. ZRE.TO and VRE.TO have demonstrated resilience with stronger returns, positioning them as potentially more stable choices. Conversely, RIT.TO, MREL.TO, and XRE.TO have encountered more significant obstacles, as reflected by their negative YTD returns and subdued average annual returns.
The challenges faced by these ETFs often stem from their sensitivity to interest rates and the specific nature of the assets they hold. Interest rate sensitivity is a crucial factor for REITs; as rates rise, the financing costs for properties can increase, leading to reduced profits and, consequently, lower returns for investors. This sensitivity can particularly impact ETFs like RIT.TO, MREL.TO, and XRE.TO, which have shown negative performance in the short term.
Another challenge is the lack of diversification in the types of assets held by these REITs. Some may concentrate heavily in specific types of properties or geographic locations, making them more vulnerable to sector-specific downturns or regional economic shifts. This lack of diversification can lead to increased volatility and risk, contributing to the challenges and lower returns observed in some of the ETFs. When considering investment, the broader economic environment, interest rate forecasts, and the specific asset composition of the REIT should be carefully evaluated to understand potential performance and risks.
1- VRE – Vanguard FTSE CDN Capped REIT Index ETF
VRE Seeks to track the performance of the FTSE Canada All Cap Real Estate Capped 25% Index (before fees and expenses). It provides exposure to Canadian large-, mid-, and small-cap stocks in the Real Estate industry.
Vanguard FTSE CDN Capped REIT Index ETF has the lowest MER among the ETFs selected for this post.
Please consult issuers’ website for the most up-to-date data
Sector allocation
Sector
Fund
Retail REITs
23.2%
Office REITs
19.6%
Real Estate Services
18.1%
Residential REITs
17.7%
Diversified REITs
9.0%
Industrial REITs
7.7%
Real Estate Holding and Development
4.6%
Total
100.0%
Please consult issuers’ website for the most up-to-date data
VRE ETF Distribution
Distribution frequency: Monthly
Adj. Amount
Ex-Div Date
Record Date
Pay Date
Declare Date
0.0672
12/28/2023
12/29/2023
1/8/2024
12/20/2023
0.0672
11/30/2023
12/1/2023
12/8/2023
11/23/2023
0.0672
10/31/2023
11/1/2023
11/8/2023
10/24/2023
0.0672
9/28/2023
10/2/2023
10/10/2023
9/22/2023
0.0672
8/31/2023
9/1/2023
9/11/2023
8/24/2023
0.0672
7/31/2023
8/1/2023
8/9/2023
7/24/2023
0.0672
6/30/2023
7/4/2023
7/11/2023
6/23/2023
2- ZRE – BMO Equal Weight Reits Index ETF
ZRE is an index fund that tracks the Solactive Equal Weight Canada REIT Index. It invests in Canadian securities that fall within the Real Estate Investment Trust sector. Each security in the Index is allocated a fixed weight rather than a market capitalization weight. This is the largest REITS ETF by asset under management with 1.3 Billion.
Please consult issuers’ website for the most up-to-date data
ZRE ETF Holdings
Weight (%)
Name
4.98%
WPT INDUSTRIAL REAL ESTATE INVESTMENT TRUST
4.96%
SUMMIT INDUSTRIAL INCOME REIT
4.76%
CROMBIE REAL ESTATE INVESTMENT TRUST
4.63%
SMARTCENTRES REAL ESTATE INVESTMENT TRUST
4.63%
RIOCAN REAL ESTATE INVESTMENT TRUST
4.61%
INTERRENT REAL ESTATE INVESTMENT TRUST
4.61%
CHARTWELL RETIREMENT RESIDENCES
4.59%
MINTO APARTMENT REAL ESTATE INVESTMENT TRUST
4.58%
CHOICE PROPERTIES REAL ESTATE INVESTMENT TRUST
4.57%
H&R REAL ESTATE INVESTMENT TRUST
Please consult issuers’ website for the most up-to-date data
MREL – Middlefield REIT Index plus ETF
IDR has been designed to provide investors with low-cost exposure to the global real estate sector through a combination of indexing and active portfolio management.
65% of the funds’ assets are invested in the Canadian market (34% in the United states and 2% International).
Canadian Apartment Properties REIT SmartCentres Real Estate Investment Trust First Service Corp RioCan Real Estate Investment Trust Granite Real Estate Investment Trust Prologis Inc First Capital Real Estate Investment Trust Welltower Inc Colliers International Group Inc WPT Industrial Real Estate Investment Trust
(As of March 31, 2021)
IDR ETF Sector allocation
Name
Weight %
Industrial REITs
24.4
Retail REITs
19.5
Residential REITs
18.6
Real Estate Services
7.9
Specialized REITs
6.9
Healthcare REITs
6.7
Office REITs
5.9
Diversified REITs
4.4
Asset Management & Custody Banks
2.9
Hotels, Resorts & Cruise Lines
2.8
Please consult issuers’ website for the most up-to-date data
RIT – CI First Asset Canadian REIT ETF
RIT is an actively managed portfolio comprised primarily of securities of Canadian real estate investment trusts, real estate operating corporations and entities involved in real estate related services. Up to 30% of the Fund’s assets may be invested in foreign securities.
Please consult issuers’ website for the most up-to-date data
Sector allocation
Type
Fund
Retail REIT’s
32.24
Residential REIT’s
24.26
Industrial REIT’s
18.27
Diversified REIT’s
11.64
Office REIT’s
10.18
Health Care REIT’s
3.26
Cash and/or Derivatives
0.16
Please consult issuers’ website for the most up-to-date data
Disclaimer
The data on this website is for your information only. It does not constitute investment advice, or advice on tax or legal matters. Any information provided on this website does not constitute investment advice or investment recommendation nor does it constitute an offer to buy or sell or a solicitation of an offer to buy or sell shares or units in any of the investment funds or other financial instruments described on this website. Should you have any doubts about the meaning of the information provided herein, please contact your financial advisor or any other independent professional advisor.
HXT Stock: Investment objective
As a Canadian investor evaluating HXT, anticipate an investment strategy meticulously designed to replicate the performance of the S&P/TSX 60™ Index (Total Return), net of expenses. This ETF strategically aligns with the large-cap segment of the Canadian equity market, offering a comprehensive snapshot of its dynamics.
The allure for investors lies in the advantages of an index approach. HXT employs a systematic method, mirroring the Index’s movements, thereby providing a passive investment avenue. This approach brings forth inherent cost efficiencies, as it minimizes the need for active management and associated fees.
Furthermore, by choosing HXT, investors gain exposure to a diversified portfolio of large-cap stocks, mitigating company-specific risks. This diversification aligns with a prudent risk management strategy, particularly pertinent in the ever-evolving landscape of the Canadian equity market.
The S&P/TSX 60™ Index is a benchmark meticulously crafted to gauge the performance of the large-cap segment within the Canadian equity market. Comprising 60 of the most prominent and liquid stocks listed on the Toronto Stock Exchange, this index reflects the pulse of the nation’s corporate giants.
The S&P/TSX 60™ Index, with its focus on the largest and most liquid stocks in the Canadian equity market, offers several distinct advantages that set it apart from other options.
Advantages
Stability through Large Caps: The concentration on large-cap stocks inherently brings a level of stability. These companies are often well-established, with proven track records and financial strength. This can be appealing to investors seeking a degree of reliability and lower volatility in their portfolio.
Quality Stocks: Large-cap stocks in the S&P/TSX 60™ are typically leaders in their respective industries. These companies often exhibit characteristics such as stable earnings, strong fundamentals, and a history of successful performance. This focus on quality can be attractive to investors looking for a long-term, fundamentally sound investment strategy.
Liquidity: Given that the S&P/TSX 60™ Index includes some of the most actively traded stocks on the Toronto Stock Exchange, it ensures high liquidity. This liquidity can be advantageous for investors, as it facilitates ease of buying and selling shares without significantly impacting market prices.
Simplicity: The index’s focus on the top 60 stocks simplifies the investment process for those who prefer a straightforward approach. It’s a concentrated portfolio that allows investors to easily grasp the core holdings without delving into a multitude of smaller companies.
Historical performance – HXT vs XIU, XIC, VCN and ZCN
Examining the net assets of the listed Canadian ETFs provides valuable insights into their scale and investor confidence. XIU.TO stands out with the highest net assets at $10.94B. XIC.TO follows closely with $8.49B, showcasing a robust presence in the market. ZCN.TO holds $7.02B in net assets, indicating a significant investment pool. VCN.TO, with $5.48B, and HXT.TO, with $3.31B, exhibit slightly smaller but still substantial asset bases.
In this post, we’ll go over the best growth ETFs offered by BMO. Our analysis focuses on long-term performance. Only ETFs with a sustained historical performance over a period of 5 years were considered. For each ETF, we will analyze strategy, performance, management fees and volatility.
Source: TD Market research , MER: Management expense ratio is the total charges charged by the fund including administration and management fees. Beta (60 months): is a measure of volatility. The higher the Beta, the more risky the title. A Beta of 1 means the stock has the same volatility as the market.
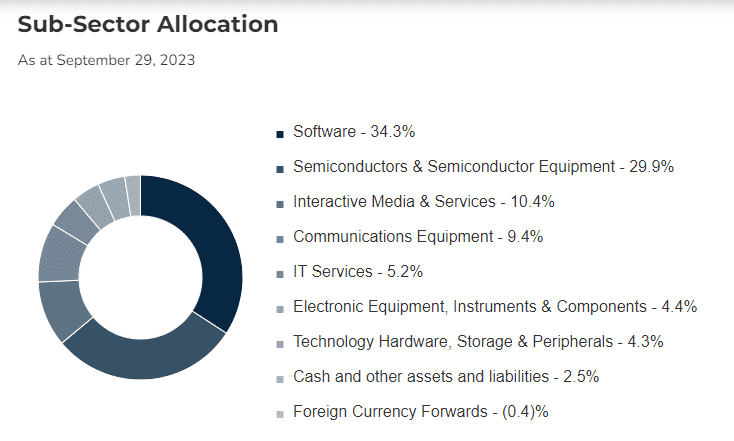
BMO’s Best Equity ETFs highlight ZQQ (BMO Nasdaq 100 Equity) as the top performer over the last decade, primarily attributed to the dominance of FAANG stocks (Facebook, Amazon, Apple, Netflix, and Google), which collectively constitute nearly a third of the Nasdaq 100. ZQQ boasts the highest annualized average performance over a 5-year span, coupled with a modest volatility of 1.28. This makes ZQQ particularly attractive for long-term investors seeking a well-performing portfolio of high-quality securities with substantial growth potential. Notably, ZQQ provides excellent exposure to the technology sector in its sector allocation.
ZQQ has assets under management of $ 1.57 billion. It is one of the most popular funds in Canada.
ZUQ (BMO MSCI US High Quality) and ZGQ (BMO MSCI World High Quality) have showcased strong performances, sharing a common stock selection methodology. Unlike traditional index replication, these funds implement a pre-selection process, specifically choosing securities based on criteria related to yield and liquidity. Both ZUQ and ZGQ are well-suited for long-term equity investments, offering diversified portfolios. Their risk/return ratio is attractive, marked by a Beta of less than 1.
ZSP and ZSP-U (BMO S&P 500 Index ETF) emerge as the top choices for investors seeking low-cost index funds. Tracking the S&P 500 Index, a robust representation of the US economy, these ETFs stand out for their minimal management fees. ZSP is unhedged against currency risk, while ZSP-U is exclusively purchasable in US dollars. The decision between hedged, unhedged, or US dollar funds hinges on individual expectations regarding exchange rates, with long-term impacts on exchange losses or gains typically proving minimal.
ZBK (BMO Equal Weight US Banks) provides exposure to the US banking sector, albeit with a Beta of 1.47 over the past 5 years, indicating a volatility level almost one and a half times higher than the market. With assets under management totaling $880 million, ZBK remains a significant player in this segment.
ZID (BMO Indian Equities) focuses on Indian companies, offering a valuable avenue for diversification within an existing portfolio by tapping into the potential of a promising emerging market. While relatively smaller in size with $107 million in assets under management, ZID provides investors with exposure to the opportunities presented by the Indian market.
BMO Nasdaq 100 Equity Hedged to CAD seeks to replicate, to the extent possible, the performance of an index of securities of companies listed on the NASDAQ, net of expenses. ZQQ ranks first in our ranking of the best BMO ETFs to hold for long term.
The ZQQ is hedged for currency risk.
The Nasdaq-100 is one of the world’s leading large-cap growth indices. It includes 100 of the largest national and international non-financial companies listed on the Nasdaq by market capitalization.
This index is dominated by companies in the technology sector.
The BMO MSCI USA High Quality seeks to replicate, to the extent possible, the performance of the MSCI USA Quality Index, net of expenses. The index is 100% invested in the United States.
The fund selects the securities according to the criteria below:
The BMO MSCI World High Quality ETF seeks to replicate, to the extent possible, the performance of the MSCI All Country World High Quality Index, net of expenses. ZGQ is a global ETF. While ZUQ invests mainly in the American market.
The fund selects the securities according to the criteria below:
The BMO Indian Equity ETF provides exposure to the Indian market which is one of the most promising emerging markets. The fund acquires certificates (ADRs) from major Indian companies listed on the Toronto, London and New York stock exchanges (NYSE and NASDAQ).
The BMO Equal Weight US Banks ETF has been designed to replicate, to the extent possible, the performance of the Solactive Equal Weight US Bank Index, net of expenses. The Fund invests and holds the constituent securities of the index in the same proportion as that reflected in the index.
ZBK’s sector allocation is 100% in the financial sector.
The BMO S&P 500 ETF seeks to replicate, to the extent possible, the performance of the S&P 500 Index, net of expenses. ZSP invests in the constituent securities of the index and holds these securities in a proportion equal to that which they represent in the index.
ZSP-U is a Canadian ETF however it only trades in US $.
ZSP is a Canadian ETF that trades in Canadian $ and is not hedged against currency risk.
ZSP-U vs ZSP which one to choose
If you are uncertain between a hedged, unhedged or US $ ETF, please refer to the table below:
Scenario 1: Value of Canadian $ appreciated
Scenario 2: Value of Canadian $ depreciated
Non hedged ETF
Index return Minus foreign exchange loss
Index return Plus foreign exchange gains
Hedged ETF
Index return
Index return
US $ ETF
Index Return The investor chooses when to convert
Index Return The investor chooses when to convert
S.P. 500 Index
The S&P 500 Index, or the Standard & Poor’s 500 Index, is a market-capitalization-weighted index of the 500 largest publicly-traded companies in the U.S.
The S&P 500 is an excellent index because most of its constituents are large established US corporations. It’s well diversified across various sectors of the US economy. The index is widely regarded as the best gauge of large-cap U.S. equities. It can be easily used to express an opinion on the US economy in general. In other words, if you are bullish on the performance of the American economy in the long term, it’s probably the best index for you.
ZSP-U Portefeuille
Weight (%)
Name
Sector
5.98%
APPLE INC
Information Technology
5.54%
MICROSOFT CORP
Information Technology
2.30%
AMAZON.COM INC
Consumer Discretionary
1.73%
BERKSHIRE HATHAWAY INC
Financials
1.63%
ALPHABET INC
Communication Services
1.57%
UNITEDHEALTH GROUP INC
Health Care
1.46%
JOHNSON & JOHNSON
Health Care
1.45%
ALPHABET INC
Communication Services
1.42%
EXXON MOBIL CORP
Energy
1.23%
JPMORGAN CHASE & CO
Financials
BMO investorline review
BMO Bank of Montreal offers a wide variety of different ETFs. It is in fact one of the largest issuers of exchange-traded funds in Canada. BMO’s brokerage service is offered under the BMO InvestorLine.
According to the Milliondollarjourney website, BMO investorline offers several advantages:
BMO investorline pros
• Best broker / bank;
• One of the best brokerage platform;
• App on phone is one of the best in the market;
• BMO is a major bank in Canada;
• Multiple resources to educate clients;
BMO investorline Cons
• Relatively high transaction costs compared to online brokers such as Questrade and Qtrade
RBNK ETF is a dividend ETF ideal for investors looking for both growth and dividend in the Canadian banking industry. The RBC Canadian Bank Yield Index Exchange seeks to replicate the Solactive Canada Bank Yield Index. The latter is focused only on the Canadian banking industry. This ETF is more suited for long term investors with medium to high risk tolerance.
The Solactive Canada Bank Yield Index follows the price changes of the six biggest Canadian banks. Each company’s weight in the index is based on how much it pays in dividends, which is updated regularly. To be included in the index, a company needs to have a certain value in the stock market. If there aren’t enough qualifying companies, the six largest ones are picked based on their stock market value.
The selected companies are ranked by their indicated dividend yield, and the two companies with the highest yield receive a weight of 1/4. The third and fourth companies each receive a weight of 1/6, and the remaining two companies each receive a weight of 1/12.
– Total return: Though the focus here is on the dividend yield, you have to keep in mind the total return. The profit or loss we make on any investment combines both dividend income and capital gain or loss. Looking at the long-term performance of the fund is crucial. An ETF that provides a good capital appreciation with a high dividend yield is preferable.
–Diversification: A diversified ETF is always a safer option. Some high yield ETFs are sector-specific (Financials, Energy or Gold). The ones focused on Energy and Gold have had an inferior long-term performance and carry high volatility risk.
–Volume and liquidity of the ETF. The higher the asset under management, the lower the trading costs of the ETF (difference between the bid and ask price).