In this post, we will review a popular index ETF on the TSX: the Vanguard S&P500 Canadian Hedge (VSP ETF). We will first explain what’s an index ETF. Then, we will discuss VSP’s historical performance, fees and holdings. Finally, we will compare VSP against similar ETFs.
There are several types of ETFs. Index ETFs are the king of the hill. The first-ever ETF introduced to a North American Exchange was an index ETF. Index ETFs offer exposure to many securities and sometimes to a whole stock exchange at a meager cost. Their main goal is to acquire, on your behalf, all the securities that constitute a specific index to achieve the same return of the tracked index minus the fees.
One significant advantage of owning an index ETF is low fees. The manager is simply replicating the index’s performance either by acquiring directly or indirectly (using derivatives) the constituents of the index. There is no additional effort involved in the selection process, thus no need to generously compensate the portfolio manager. It might also be pertinent to know that empirical studies have consistently shown that active portfolio managers rarely beat the S&P 500 index in the long term. In other words, only a few managers can outguess the market in the long run.
VSP ETF Investment objective
Vanguard S&P 500 Index Canadian Hedge ETF seeks to track the performance of a broad U.S. equity index that measures the investment return of large-capitalization U.S. stocks. The S&P 500 Index, or the Standard & Poor’s 500 Index, is a market-capitalization-weighted index of the 500 largest publicly-traded companies in the U.S.
The S&P 500 is an excellent index because most of its constituents are large, established US corporations. Besides, It’s well-diversified across various sectors of the US economy. The S&P 500 is widely regarded as the best gauge of large-cap U.S. equities. It can be easily used to express an opinion on the US economy in general. In other words, if you are bullish on the performance of the American economy in the long term, it’s probably the best index for you.
What’s a Canadian hedge ETF?
When the manager has to replicate a U.S. index such as the S.P. 500 or the Nasdaq 100. It must acquire these assets in U.S. dollars. So, on a fairly regular basis, the fund has to convert the funds available in Canadian dollars into U.S. dollars. These conversions may be beneficial or have a negative impact depending if the Canadian dollar has appreciated or depreciated.
Many investors want to reduce this risk. To meet their needs, the majority of ETFs that reproduce a U.S. index offer a “hedged” version of their funds and sometimes another version that is traded only in U.S. dollars. Coverage acts as a kind of insurance. See the scenarios presented below:
VSP, ZUE and XSP have very low MER. Considering the quality of the portfolio of securities held by these ETFs, the low MER makes them very attractive to investors.
VSP is slightly ahead in terms of long-term performance. However, since all three ETFs track the same index and it’s understandable they will have very close performance.
VSP ETF: Morningstar rating
Rating: 3 out of 5.
VSP Dividend history
Type
Ex-div Date
Payment Date
Cash Distrib per Unit
Income
29 Jun 2022
08 Jul 2022
$0.207999
Income
24 Mar 2022
01 Apr 2022
$0.176667
Income
30 Dec 2021
10 Jan 2022
$0.247884
Capital Gains (ETFs)
30 Dec 2021
10 Jan 2022
$0.000000
Income
29 Sep 2021
08 Oct 2021
$0.201278
please consult issuers website for up-to-date data
VSP ETF Holdings
Holding Name
% of Market Value
Apple Inc.
6.63%
Microsoft Corp.
6.06%
Amazon.com Inc.
2.93%
Alphabet Inc. Class A
2.06%
Alphabet Inc. Class C
1.90%
Tesla Inc.
1.78%
Berkshire Hathaway Inc. Class B
1.55%
UnitedHealth Group Inc.
1.52%
Johnson & Johnson
1.47%
NVIDIA Corp.
1.19%
please consult issuers website for up-to-date data
please consult issuers website for up-to-date data
An Exchange Traded Fund (ETF) is a financial instrument traded on stock exchanges, managed by professional fund managers. In Canada, various issuers offer ETFs, including prominent banks such as BMO and TD, as well as investment companies like Vanguard and iShares.
With over 1000 ETFs presently accessible in the market, investors have a wide array of options. These funds cater to diverse investment preferences and risk appetites, making them suitable for both active and passive management strategies. Whether an investor seeks broad market exposure or specific sector focus, there’s likely an ETF designed to meet their unique needs within the expansive ETF landscape.
What is an index fund?
There are several types of ETFs. And index ETFs are the most popular in the financial markets. In fact, the first ETF to be launched on the North American stock exchange was an index ETF. Index ETFs offer exposure to a large number of securities and sometimes to a whole stock market at a very low cost. Their main objective is to acquire, on your behalf, all securities that constitute a specific index in order to obtain the same return of the index minus management fees.
S.P. 500 Index
The S&P 500 Index, or the Standard & Poor’s 500 Index, is a market-capitalization-weighted index of the 500 largest publicly-traded companies in the U.S.
The S&P 500 is an excellent index because most of its constituents are large established US corporations. It’s well diversified across various sectors of the US economy. The index is widely regarded as the best gauge of large-cap U.S. equities. It can be easily used to express an opinion on the US economy in general. In other words, if you are bullish on the performance of the American economy in the long term, it’s probably the best index for you.
All ETFs that replicate the performance of the S.P. 500 index will have the same securities in their assets and at about the same proportions as the index itself.
The Nasdaq 100
The Nasdaq-100 is one of the world’s preeminent large-cap growth indexes. It includes 100 of the largest domestic and international non-financial companies listed on the Nasdaq Stock Market based on market capitalization.
This index is dominated by companies in the Information Technology sector.
S&P/TSX 60
An index of the 60 largest companies on the Toronto Stock Exchange. This index is dominated by the energy and finance sectors.
What’s a Dividend ETF?
A Dividend ETF is an Exchange Traded Fund specifically designed to invest in a diversified portfolio of dividend-paying stocks. Dividend-paying stocks are shares of companies that distribute a portion of their profits back to shareholders in the form of dividends.
The primary objective of a Dividend ETF is to provide investors with a steady income stream through the regular payment of dividends. These funds typically focus on selecting stocks of companies that have a history of paying consistent and reliable dividends. Dividend ETFs may include stocks from various sectors and industries, and they often follow an index that emphasizes high dividend-yielding stocks.
Investing in a Dividend ETF can be attractive for income-oriented investors who seek a combination of capital appreciation and a steady flow of income. Additionally, these ETFs may offer diversification benefits by holding a basket of dividend-paying stocks, spreading risk across different sectors and companies.
Dividend: Tax implications for owning ETFs
There are so many possible structures for an ETF. Below, we will discuss mainly three common structures:
if held in an investment account (non registered)
Type 1: Canadian ETFs that invest in US or international stocks directly. There is 15% withholding tax that will impact the fund’s return;
Type 2: Canadian ETFs that invest in US ETFs which invests in US stocks. There is 15% withholding tax that will impact the fund’s return;
Type 3: Canadian ETFs that invest in US listed ETFs which invest in international stock. This is the structure that’s the least interesting for investors from a taxation perspective. 2 Taxes will be applied by the foreign country first and then the US.
if held in registered account: TFSA, RESP, RRSP
Canadian ETF: 1$ dividend scenario
Taxes
Dividend received
1- Holding US or International stocks directly
-0.15$ (withholding tax from US or foreign jurisdiction) Creditable
0.85$
2- Holding US listed ETFs that invest in US stocks
-0.15$ (withholding tax from US or foreign jurisdiction) Creditable
0.85$
3- Holding US listed ETFs that invest in International stocks
-0.15$ (withholding tax from foreign jurisdiction) Non creditable -0.13 (withholding tax from US) Creditable
ZXM.TO : CI Morningstar International Momentum Index Common Units (CAD Hedged)
ZZZD.TO : BMO Tactical Dividend Fund
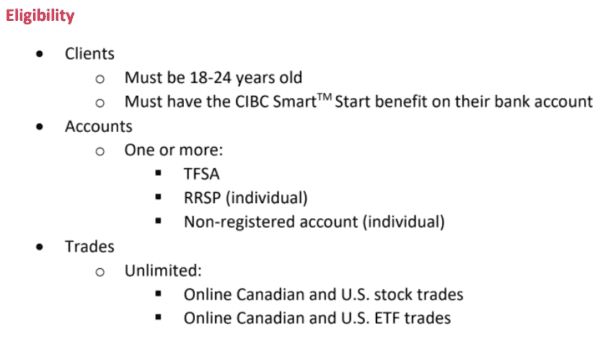
With CIBC’s new investor-friendly offer, you’ll have no more excuses to start building your wealth. Indeed, 18-24 year olds who apply for this offer will be able to benefit from:
Free online trading of Canadian and US stocks and ETFs. Save on the regular price of 6.95;
No administration fees for registered and non-registered accounts. It’s $200 up to that you save;
No minimum balance to maintain.
Summary of the Offer
Visit CIBC’s Investor’s Edge Website to take advantage of this offer
With its exclusive advantages, you can invest with peace of mind knowing that you are dealing with a major Canadian bank. Indeed, CIBC pro-investor is known for:
1 – Free investment research tools!
If you are new to investing or have little investment knowledge, there are several resources available to you within CIBC’s pro-investor brokerage platform. Indeed, the platform hosts a wide range of research, tools and educational resources.
2 – Quick and easy account opening
The process of opening a new account can be done entirely online. They also have agents available by phone, chat, and email if you need help. They guide you through the process of creating an account, transferring money and your first transaction.
3 -Security
CIBC is one of the largest banks in North America and one of the top five in Canada. CIBC Investor’s Edge is a division of CIBC Investor Services Inc., a subsidiary of CIBC. CIBC Investor Services Inc. is a member of the Canadian Investor Protection Fund (CIPF) and the Investment Industry Regulatory Organization of Canada (IIROC).
4 – A quality mobile application
The CIBC Investor ‘s Edge mobile app offers users a convenient way to monitor account balances and trade stocks, ETFs, options and more anytime, from anywhere. Users can also stay informed about important investment news, such as new IPOs, so they can take advantage of new opportunities as they arise.
Users will also have access to charts and tables to help them analyze their entire portfolio in one easy-to-read view, or review different investment accounts separately.
5 -Type of accounts offered
You can open all major investment accounts using CIBC Investor’s Edge, including:
Step 1 – Open a chequing account with CIBC Smart™ Start • Get a bank account with no monthly fees and unlimited transactions • Open an account at the Banking Center (starting April 18) or online (starting May)
Step 2 – Open a CIBC Investor’s Edge account • Choose from TFSA, RRSP and non-registered account • Open an account at the Banking Center or online
Exchange-traded funds (ETFs) that pay monthly dividends are popular with investors. Indeed, it is a way for many to have a relatively stable monthly income. There are a number of ETFs with monthly dividends. However, each ETF has a different objective and a unique investment strategy. For the purposes of this post, we have selected 10 Best Canadian monthly dividend ETFs.
Diversified Canadian Dividend ETFs (example : XDV, XEI, VDY, CDZ)
These ETFs focus on investing in top-performing Canadian companies that offer strong dividend yields and growth potential. They allocate your investments across various sectors of the Canadian economy. However, it’s worth noting that these funds often have a significant presence in the banking and energy sectors, which is reflective of the Canadian economic landscape.
In my assessment, two standout Canadian diversified dividend ETFs are XDV iShares Canadian Select Dividend Index and VDY FTSE Canadian High Dividend Yield Index. These ETFs offer a compelling combination of attributes, including low volatility, attractive returns, and strong overall performance. Notably, VDY boasts an impressive Morningstar rating of 5 Stars and an enticingly low Management Expense Ratio (MER) of just 0.21%.
ZWC and HDIV are well-known dividend-focused exchange-traded funds (ETFs) in the investment landscape. What distinguishes them is their classification as covered call ETFs. In essence, the fund managers overseeing these ETFs engage in a specific strategy where they sell call options on the securities held within the fund’s portfolio. This approach serves two primary purposes:
Portfolio Protection: One key objective is to safeguard the portfolio in the event of a significant decline in the value of the securities it holds. By selling call options, the fund generates income that can help offset potential losses in the underlying holdings.
Income Enhancement: The second goal is to bolster income distributions. These ETFs collect premiums from selling call options, thereby increasing the overall income generated by the fund. This boost in income is particularly attractive to income-focused investors.
Despite their popularity in the Canadian investment landscape, it’s essential to note that covered call ETFs like ZWC and HDIV have faced criticism for their relatively poor long-term performance.
When it comes to dividend yields, covered call ETFs often provide attractive returns due to the additional income generated from the premiums collected through options trading. However, from a long-term performance perspective, the strategy of writing covered calls can be less appealing, as it may limit the potential for capital appreciation.
For a more in-depth exploration of covered call ETFs and their performance in Canada, you can refer to our comprehensive guide on the best covered call ETFs in the country. This resource can provide you with a deeper understanding of these investment vehicles and their suitability for your financial goals.
Canadian Banking ETFs (FIE, RBNK et ZEB)
These ETFs are dedicated to investments in Canada’s most prominent banking institutions, making them a dual-purpose investment that combines sector-specific positioning with a focus on generating dividend income.
The Canadian banking sector is renowned for its financial robustness, and the dividends from these bank securities are highly coveted due to their appealing and dependable yields. Among the top choices for investors seeking exposure to the Canadian banking sector with an emphasis on dividend income, ZEB (BMO S&P TSX Equal Weight Banks Index) and RBNK (RBC CDN Bank Yield Index) stand out as excellent options. Both of these ETFs consistently deliver stable monthly dividend payments.
It’s also worth noting that both RBNK and ZEB come with a lower Management Expense Ratio (MER) compared to FIE, making them potentially more cost-effective choices for investors.
XDV – iShares Canadian Select Dividend Index ETF
XDV seeks long-term capital growth by replicating the performance of the Dow Jones Canada Select Dividend Index, net of expenses.
XEI – iShares Core S&P/TSX Composite High Dividend Index ETF
This ETF objective is to replicate the performance of the S&P/TSX Composite High Dividend Index ETF. The fund’s objective is long term capital growth by investing in Canadian companies operating across diversified sectors. XEI pays a monthly dividend income which can be appealing for investor who are looking for a frequent payout.
The BMO Canadian High Dividend Covered Call ETF (ZWC) has been designed to provide exposure to a dividend focused portfolio, while earning call option premiums. The underlying portfolio is yield-weighted and broadly diversified across sectors.
The fund selection methodology uses 4 factors: – Liquidity; – Dividend growth rate; – Yield and payout ratio.
What’s unique about this ETF is that it uses covered calls to protect against downside risk. This being said, the covered call strategy provides limited downside protection. Also, when you write a covered call, you give up some of the stock’s potential gains. These ETFs will tend to have a higher yield and a lower performance.
The financial sector and Energy represents 56% of the total overall sector allocation.
VDY – Vanguard FTSE Canadian High Dividend Yield Index ETF
FTSE Canadian High Dividend Yield Index ETF tracks the performance of the FTSE Canada High Dividend Yield Index, which consists of Canadian stocks having a high dividend yield. Due to the nature of the Canadian market, this fund has large portion of its investment portfolio in Energy and Financials.
CDZ – S&P/TSX Canadian Dividend Aristocrats Index Fund
The S&P/TSX Canadian Dividend Aristocrats includes only large companies that are part of the TSX and who have increased their dividend consistently for at least 5 years period. This fund has been around for a while now.
Ishares CDN Fin Monthly Income seeks to maximize total return and to provide a stable stream of monthly cash distributions. FIE has a high exposure to the financial sector.
RBC Canadian Bank Yield Index ETF seeks to replicate the Solactive Canada Bank Yield Index. The latter is focused only on the Canadian banking industry.
The BMO Equal Weight Banks ETF has been designed to replicate, to the extent possible, the performance of the Solactive Equal Weight Canada Banks Index, net of expenses. The index includes the major Canadian banks with a balanced allocation as you can see in the composition of the portfolio below.
Please consult issuers’ website for up-to-date data
HDIV -Hamilton Enhanced Multi-Sector Covered Call
HDIV is a passive covered call ETF. It’s ideal for investors who seek high dividend income and low volatility. HDIV invests in a basket of 7 covered call & sector focus ETFs. The fund manager uses also cash leverage of 25% to enhance yield and growth potential. The index tracked is The Solactive Multi-Sector Covered Call ETFs Index TR x 1.25.
The Global X Lithium & Battery Tech ETF (LIT) aims to provide Canadian investors with investment results that closely follow the price and yield performance of the Solactive Global Lithium Index, before factoring in fees and expenses. This ETF focuses on companies involved in lithium battery technology, which is crucial for the growth of electric vehicles (EVs), renewable energy storage, and mobile devices.
What’s the Solactive Global Lithium Index?
The Solactive Global Lithium Index consists of 40 stocks and is designed to monitor the performance of the largest and most liquid listed companies engaged in lithium exploration and/or mining, as well as the production of lithium batteries. This index is calculated as a total return index in USD and undergoes semi-annual adjustments. The country composition of the index is as follows: Canada contributes 31.9%, the United States accounts for 28.6%, Australia makes up 12.3%, Japan represents 11.8%, and the remaining 15.4% is allocated to other countries.
With the increasing demand for electric vehicles and renewable energy solutions, the lithium battery industry holds immense growth potential in the coming decade. At the heart of these technologies, lithium batteries play a crucial role.
The Global X Lithium & Battery Tech ETF offers a compelling investment opportunity for those looking to capitalize on this industry. One key advantage of investing in this ETF is the ability to mitigate company-specific risks. Instead of focusing on individual companies’ performance, investors can track the trajectory of lithium prices. Moreover, the ETF provides broad exposure to the entire electric vehicle supply chain including mining. This comprehensive approach helps to diversify risks within the industry and offers the potential for stable long-term returns.
However, it is important to consider potential challenges that the Global X Lithium & Battery Tech ETF may encounter. A decline in Chinese real estate prices, for instance, could have an impact on global electric vehicle sales and disrupt the overall supply chain. It is advisable for investors to stay informed about such developments and evaluate their potential implications on the ETF’s performance.
In summary, the Global X Lithium & Battery Tech ETF presents an enticing opportunity for investors seeking exposure to the thriving lithium battery technology industry. By diversifying risk and gaining access to the entire electric vehicle supply chain, investors can participate in this growing sector with confidence.
The iShares Canadian Select Dividend Index ETF (XDV Stock) provides long-term capital growth by investing in 30 high yielding Canadian companies in the Dow Jones Canada Total Market Index.
XDV pays a monthly dividend income which can be appealing for investor who are looking for a frequent payout.
The index universe is defined as all dividend-paying companies listed on the Toronto Stock Exchange, excluding income trusts.
The dow Jones Canada Select Dividend Index is rebalanced annually in March. It has 29 constituents of the index. Below, we will detail the methodology used to select the ‘best dividend stocks’.
Methodology
Selected stocks should meet the requirements below:
-Be part of the Index Universe.
-Only stocks that paid dividends in each of the previous five years are selected.
-Enough trading volume
-A five-year average dividend coverage ratio of greater than or equal to 125%. The formula used: Earning per Share / Annual Dividend per Share
The approved stocks are then re-screened by ranking them in descending order by using the indicated annual dividend yield (not including any special dividends). The maximum number of constituents is 30.
Constituent Weightings: Constituent weightings are assigned annually based on IAD. The weight of any individual company is restricted to 10% within the index. Such restrictions are implemented on a quarterly basis
In this section, we will compare XDV with Both XEI – Ishares S&P TSX Comp High Div Index ETF and VDY Vanguard FTSE CDN High Div Yld Index. See tables below:
The tables above indicate that VDY is ahead in terms of short-term performance. VDY’s exceptional performance can be attributed to the financial sector, which makes up almost 60% of its portfolio.
For long term performance, VDY is slightly better than both XEI and XDV.
Diversification, Volatility and Dividend yield:
XDV holds 30 high dividend-paying stocks in its holdings while VDY 39 and XEI 77. Thus, XEI offers better diversification. In terms of volatility, all three ETFs have the exact Beta suggesting the same level of risk. XEI has the highest dividend yield, but VDY and XDV are close.
Conclusion:
XEI has the upper hand when it comes to diversification. This ETF is not biased towards a specific sector, while Canadian banks dominate XDV and VDY.
Source: TD Market research, Beta is measure of volatility over 5 years period. The higher the Beta / The higher the volatility. A beta of 1 means the stock or ETF is as volatile as the TSX.
XDV Stock dividend history
XDV pays dividends on a monthly basis. Please refer the last column of the table below for the amount of dividend distribution.
Amount
Dividend Type
Frequency
Ex-Div Date
Record Date
Pay Date
Declare Date
0.1200
Regular
Monthly
1/25/2024
1/26/2024
1/31/2024
1/19/2024
0.1150
Regular
Monthly
12/28/2023
12/29/2023
1/4/2024
12/20/2023
0.1150
Regular
Monthly
11/21/2023
11/22/2023
11/30/2023
11/15/2023
0.1150
Regular
Monthly
10/25/2023
10/26/2023
10/31/2023
10/19/2023
XDV Stock holdings
Name
Weight %
CANADIAN IMPERIAL BANK OF COMMERCE
9,11
BANK OF MONTREAL
7,00
ROYAL BANK OF CANADA
6,33
CANADIAN TIRE LTD CLASS A
6,17
BANK OF NOVA SCOTIA
5,06
TC ENERGY CORP
4,95
LABRADOR IRON ORE ROYALTY CORP
4,94
BCE INC
4,92
TORONTO DOMINION
4,77
NATIONAL BANK OF CANADA
3,94
please consult issuer’s website for up-to-date data
XDV Sectors allocation
Type
Fonds
Finance
55,66
COMMUNICATION
11,82
Services publics
11,12
Énergie
6,75
Consommation discrétionnaire
6,17
Matières
5,77
Valeurs industrielles
2,32
Liquidités et/ou produits dérivés
0,39
please consult issuer’s website for up-to-date data
Investment objective
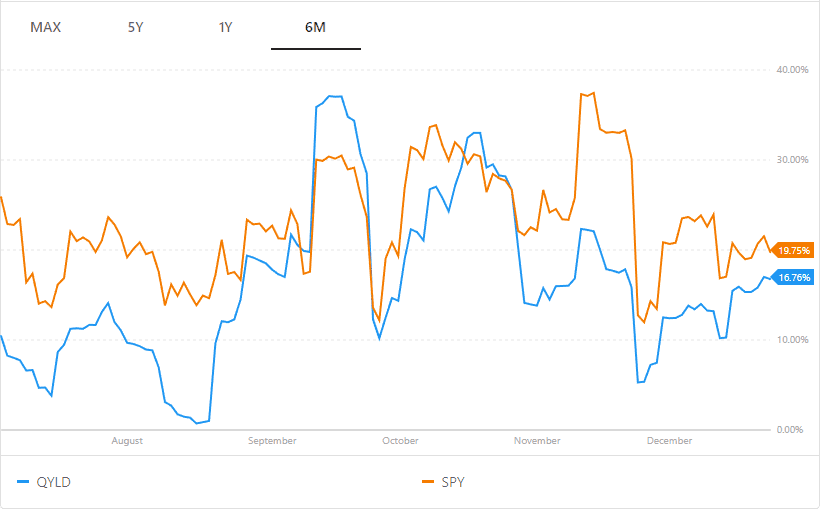
XYLD is a passive index ETF that uses a covered call strategy to enhance yield and lower volatility. The fund was created by Global X and tracks the S&P500. The manager follows a “covered call” or “buy-write” strategy, in which the Fund buys the stocks in the S&P 500 Index and “writes” or “sells” corresponding call options on the same index. So far, XYLD has paid monthly distributions 9 years running.
Covered call ETF usually protect against downside risk. This being said, the covered call strategy provides limited downside protection. Also, when you write a covered call, you give up some of the stock’s potential gains. Covered call ETFs will tend to have a higher yield and a lower performance (in bull markets) than the portfolio they track.
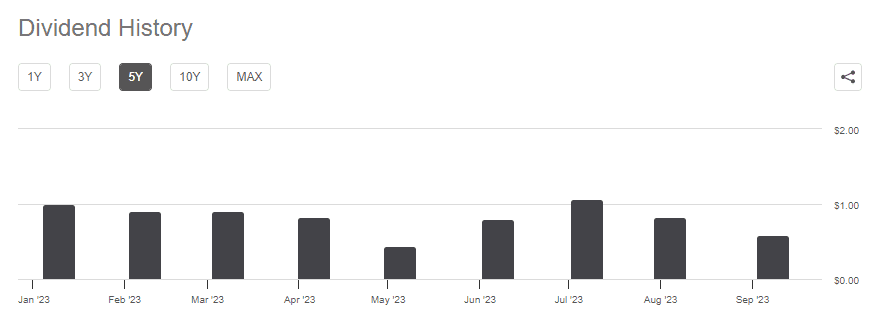
In my opinion, the dividend are not sustainable for one obvious reason: the primary source of dividend with QYLD is options’ premiums. Options by nature are volatile and their value depend greatly on market sentiment.
Is XYLD a monthly dividend ETF
Yes, QYLD offers a monthly dividend distribution.
XYLD ETF Holdings
Net Assets (%)
Name
6.09
APPLE INC
5.65
MICROSOFT CORP
2.35
AMAZON.COM INC
1.77
BERKSHIRE HATH-B
1.66
ALPHABET INC-CL A
1.60
UNITEDHEALTH GROUP INC
1.49
JOHNSON & JOHNSON
1.48
ALPHABET INC-CL C
1.44
EXXON MOBIL CORP
1.26
JPMORGAN CHASE & CO
Why covered call ETFs are popular?
Covered call ETFs are very popular with American investors. Some of these ETFs managers have billions of dollars under management. Two reasons push investors towards covered call ETFs:
High dividend yield: thanks to the premiums earned when writing call options, the manager under certain conditions can earn premiums and enhance distributions;
Low volatility. Writing a call option is a conservative strategy aimed at reducing volatility;
Great for passive income: if you’re main objective is to achieve high dividend yields and build passive income, then covered call ETFs are a good option. But, remember the high dividend yield comes at a price which very low growth potential.
Practice example: covered call strategy
An investor has 100 shares of Company A in his portfolio. Company A’s share is worth $ 30. He anticipates a stagnation or a slight drop in its price and he is ready to sell them at the price of 26 $. He decides to sell a call with the following characteristics:
The buyer of the option will choose to exercise his right to buy and, as the seller of the call, the seller will have to sell the shares at the strike price.
During this operation:
the seller sold his shares for $ 26, which constitutes an acceptable loss for him.
the seller collected the amount of the premium of $ 4, which helped boost the performance of his investments (yield).
CASE 2
Company A’s share price has fallen below the breakeven point of $ 30.
The buyer of the option will choose not to exercise his right to buy and the seller will not have to sell his shares.
Thanks to this operation, the seller keeps his shares in the portfolio and he collected the amount of the premium which generated an additional return.
In the world of exchange-traded funds (ETFs), one innovative offering has been generating significant buzz – the YieldMax™ TSLA Option Income StrategyETF, known by its ticker symbol TSLY. This actively managed fund has a unique approach to generating income for investors by selling call options specifically on Tesla Inc. (TSLA). While the prospect of substantial dividend yields ranging from 30% to 70% may sound appealing, a closer look reveals significant risks associated with TSLY ETF that may make it less suitable for most investors. In this article, we will delve into TSLY’s strategy, its appeal, and why it might not be the right choice for everyone.
TSLY’s primary objective is to generate monthly income through an innovative investment strategy. Its core approach involves selling or writing call options on shares of Tesla Inc. (TSLA). However, what sets TSLY apart from other covered call ETFs is its exclusive focus on TSLA.
The fund’s strategy essentially mirrors being long on Tesla. It achieves this by purchasing at-the-money (ATM) call options while simultaneously selling an equivalent number of ATM put options, both with the same expiration date. These positions typically have terms ranging from six months to one year. This combination creates a return profile similar to owning Tesla stock directly.
To further enhance its income generation, TSLY sells an equal amount of call options that are generally 5% to 15% out-of-the-money (OTM), and typically with expirations of one month or less. The proceeds from these options are distributed to shareholders, resulting in an eye-catching distribution yield of approximately 39.5%. The yield is annualized based on the latest dividend payment.
Additionally, TSLY manages its collateral by holding short-term U.S. Treasuries, which currently generate cash flow for the fund.
While the lure of high dividend yields may make TSLY seem like a tempting investment opportunity, it’s crucial to consider the significant risks associated with this ETF.
Volatility and Sensitivity to Tesla’s Performance:
TSLY’s strategy is closely tied to the performance of Tesla Inc., a company known for its extreme stock price volatility. This high sensitivity to Tesla’s stock price means that TSLY can experience substantial fluctuations in its share price. Investors should be prepared for the potential for both significant gains and losses.
Limited Upside Potential:
One of Tesla’s key selling points for investors has been its potential for substantial capital gains. However, TSLY’s strategy, designed to maximize income through options, limits its participation in any significant price gains of Tesla stock. This means that investors in TSLY may miss out on the full benefits of Tesla’s stock appreciation.
Market Conditions:
TSLY’s strategy does not include taking defensive positions, even during adverse market conditions. This lack of flexibility can expose investors to heightened risks during market downturns or economic crises, potentially leading to significant losses.
Distribution Cuts and Capital Erosion:
TSLY has experienced distribution cuts and capital erosion since its inception. This trend may continue as it relies on the premiums collected from selling call options to sustain its high distribution yield. Such a strategy may not be sustainable in the long run, putting shareholder income at risk.
Source: Seeking alpha
Comparative Analysis:
When comparing TSLY to more conventional covered call ETFs like XYLD, it becomes apparent that TSLY’s characteristics are more pronounced, primarily due to Tesla’s extreme volatility. For the average retiree or income-focused investor, the risk-reward tradeoff of TSLY may not be as appealing as that of a broader-market ETF.
Should You Consider Investing in TSLY ETF?
While there is no inherent flaw in TSLY’s strategy, its suitability depends on an investor’s risk tolerance, investment goals, and understanding of the underlying risks. Here are some factors to consider when deciding whether to invest in TSLY:
Risk Tolerance:
TSLY is inherently risky due to its direct exposure to Tesla’s stock price and its focus on options trading. Investors with a low risk tolerance may find TSLY’s volatility and potential for losses unsuitable for their portfolios.
Investment Goals:
If your primary objective is to generate high income through dividends, TSLY may seem attractive. However, if you also seek capital appreciation or have a long-term investment horizon, TSLY’s limited upside potential may not align with your goals.
Diversification:
Diversification is a fundamental principle of risk management in investing. TSLY’s concentrated exposure to a single stock, Tesla, can lead to higher risks. Consider how this ETF fits into your broader investment strategy and whether it complements or detracts from your overall portfolio diversification.
Market Conditions:
Be aware that TSLY’s performance is highly contingent on market sentiment towards Tesla. If you believe that Tesla’s stock is poised for significant gains, a direct investment in TSLA may offer better returns without the limitations imposed by TSLY’s strategy.
TSLY Dividends
Amount
Dividend Type
Ex-Div Date
Record Date
Pay Date
Declare Date
0.4046
Regular
2/7/2024
2/8/2024
2/9/2024
12/14/2023
0.5565
Regular
1/5/2024
1/8/2024
1/9/2024
12/14/2023
0.6039
Regular
12/7/2023
12/8/2023
12/13/2023
1/25/2023
0.5846
Regular
11/8/2023
11/9/2023
11/16/2023
1/25/2023
0.5769
Regular
10/6/2023
10/10/2023
10/16/2023
1/25/2023
0.5849
Regular
9/8/2023
9/11/2023
9/18/2023
1/25/2023
Conclusion
The YieldMax TSLA Option Income Strategy ETF (TSLY) offers an intriguing approach to income generation through selling call options on Tesla Inc. (TSLA). However, its unique strategy comes with a set of substantial risks that may not be suitable for all investors. While TSLY can generate impressive dividend yields, its sensitivity to Tesla’s stock price, limited upside potential, and exposure to market conditions make it a risky proposition. This is true particularly for retirees or those seeking long-term capital appreciation.
Investors considering TSLY should carefully assess their risk tolerance, investment goals, and portfolio diversification needs before deciding whether to include this ETF in their investment strategy. For those who prioritize income generation and are comfortable with the inherent risks, TSLY may have a place in their portfolios. However, prudent investors should approach TSLY with caution and a full understanding of the potential rewards and pitfalls it presents.
When exploring Canadian ETF options, two popular choices are the iShares S&P/TSX 60 Index ETF (XIU) and the Vanguard FTSE Canada Index ETF (VCE). Both offer exposure to Canadian equities but have differences worth noting. Let’s dive into a comparison based on fees, size, and holdings – XIU vs VCE.
Executive summary XIU vs VCE
Comparison Aspect
XIU ETF Details
VCE ETF Details
Performance
YTD Return
0.50%
0.61%
3-Year Avg Return
10.54%
11.46%
5-Year Avg Return
9.77%
10.33%
Fees (MER)
0.20% ($200 fee on a $100,000 investment)
0.06% ($60 fee on a $100,000 investment)
Size (AUM)
Over $10 billion (High liquidity)
$1.23 billion (Sufficient liquidity, but less than XIU)
Top Holdings
Royal Bank of Canada, Toronto Dominion, Shopify, Enbridge, etc.
Royal Bank of Canada, Toronto-Dominion Bank, Shopify, Enbridge, etc.
The management expense ratio (MER) is a critical factor in choosing an ETF. It’s the annual fee deducted from the ETF’s net asset value (NAV), affecting your returns. XIU’s MER is 0.20%, meaning a $100,000 investment incurs a $200 annual fee. VCE, on the other hand, boasts a lower MER of 0.06%, resulting in just a $60 fee on the same investment. For cost-conscious investors, VCE emerges as the more economical option.
Size: A Measure of Popularity and Liquidity
Size and liquidity are crucial when considering ETF investments, as they can significantly influence your trading experience and investment security. The size of an ETF, often represented by its assets under management (AUM), can give us a good indication of its popularity among investors. A larger AUM generally means more investors are involved, contributing to higher trading volumes. This, in turn, enhances liquidity, making it easier for you to buy or sell shares of the ETF without causing significant price movements.
Taking XIU as an example, its AUM stands at a bit over $10 billion, positioning it as one of the larger ETFs in the Canadian market. This substantial size suggests not only its popularity but also implies high liquidity. High liquidity is beneficial as it means you can expect tighter bid-ask spreads, which reduces the cost of trading in and out of the ETF.
On the other hand, VCE, with an AUM of $1.23 billion, is smaller compared to XIU. Despite its smaller size, VCE still maintains sufficient liquidity for most investors, making it a viable option for those looking to diversify their portfolios. However, it’s worth noting that smaller ETFs like VCE, while still liquid, might not match the liquidity levels of their larger counterparts, which could lead to wider bid-ask spreads and potentially higher trading costs in certain situations.
Holdings: The Backbone of Your Investment
Both XIU and VCE heavily invest in the financial and energy sectors, reflecting the Canadian market’s composition. Their top 10 holdings include major companies like Royal Bank and Enbridge, underlining their similar investment focus. However, the ETFs track different indexes—XIU follows the S&P/TSX 60 Index, while VCE tracks the FTSE Canada Index. This leads to slight variations in their portfolios; XIU holds 60 stocks, and VCE has 51. These differences might be minor but could influence performance over time.
Incorporating XIU or VCE into your investment portfolio can enhance its diversification, especially if you’re looking to have a strong foundation in Canadian equities. Here’s how they might fit into different investment strategies:
For Conservative Investors: XIU, with its focus on the largest and often most stable companies, might be more appealing. Its larger AUM could also be seen as a sign of stability and liquidity.
For Cost-Sensitive Investors: VCE’s lower MER makes it an attractive option for those looking to minimize fees. Over time, the savings on fees can compound, potentially leading to better net returns.
For Broad Market Exposure: Investors seeking a slightly broader exposure to the Canadian market might lean towards VCE, despite its exclusion of some companies, as it still offers a wide view of the market’s top players.
Conclusion
Choosing between XIU and VCE comes down to what you value most in an ETF. If lower fees are your priority, VCE is the clear choice. However, if you prefer an ETF with a larger AUM, XIU might be more appealing. Despite their differences, both ETFs offer a solid foundation for investors looking to tap into the Canadian market. Remember, the best choice depends on your individual financial goals and preferences.
In this post, we will go over the Best S&P500 ETFs in Canada. We selected only highly popular ETFs with a minimum asset under management of 1 Billion dollars. First things first, we will go over some definitions and the pro and cons of holding index ETFs.
There are several types of ETFs. And, index ETFs are the king of the hill. In fact, the first ever ETF introduced to a North American Exchange was an index ETF. Index ETFs offer exposure to a large number of securities and sometimes to a whole stock exchange at a very low cost. Their main goal is to acquire, on your behalf, all the securities that constitute a specific index in order to achieve the same return of the tracked index minus the fees.
Does Index funds pay dividend?
Yes they do. Since Index ETFs holds all shares of companies part of the index, if these companies pay dividends then a dividend will be distributed. See below the performance table, the dividend yield is included.
The S&P 500 Index, or the Standard & Poor’s 500 Index, is a market-capitalization-weighted index of the 500 largest publicly-traded companies in the U.S.
The S&P 500 is an excellent index because most of its constituents are large established US corporations. It’s well diversified across various sectors of the US economy. The index is widely regarded as the best gauge of large-cap U.S. equities. It can be easily used to express an opinion on the US economy in general. In other words, if you are bullish on the performance of the American economy in the long term, it’s probably the best index for you.
All ETF’s tracking the S&P 500 index will try replicate the index so their holdings will be similar to the table shown below.
Constituents of the S&P 500 index:
Company
Weight (%)
Apple Inc.
5.72
Microsoft Corporation
5.25
Amazon.com Inc.
3.98
Facebook Inc. Class A
2.11
Alphabet Inc. Class A
1.84
Alphabet Inc. Class C
1.78
Tesla Inc
1.52
Berkshire Hathaway Inc. Class B
1.45
JPMorgan Chase & Co.
1.43
Johnson & Johnson
1.27
S&P 500 website
S&P 500 Sector Weighting
Information technology: 27.60%
Health care: 13.44%
Consumer discretionary: 12.70%
Communication services: 10.79%
Financials: 10.34%
Industrials: 8.47%
Consumer staples: 6.55%
Utilities: 2.73%
Nasdaq 100
The Nasdaq-100 is one of the world’s preeminent large-cap growth indexes. It includes 100 of the largest domestic and international non-financial companies listed on the Nasdaq Stock Market based on market capitalization.
This index is dominated by companies in the Information Technology sector.
Company
Weight
Apple Inc
10.971
Microsoft Corp
9.462
Amazon.com Inc
8.433
Tesla Inc
4.236
Facebook Inc
3.801
Alphabet Inc
3.645
Alphabet Inc
3.32
NVIDIA Corp
2.64
PayPal Holdings Inc
2.342
Intel Corp
2.147
As of March 15th, 2020 Source: Investopedia
Nasdaq 100 Sector weighting
Sector
Weight (%)
Information Technology
48.39%
consumer services
19.43%
health care
10.21%
financials
7.21%
industrials
6.85%
consumer goods
5.51%
utilities
0.81%
telecommunications
0.72%
oil and gas
0.55%
basis materials
0.32%
As of March 15th, 2020 Source: Investopedia
S&P 500 vs Nasdaq 100
S&P 500 is more representative of the US economy. It’s more diversified that the Nasdaq 100 which is heavily tilted towards the tech sector. For a long term investor, an S&P 500 ETF is certainly a cost effective option to both diversify one’s investment and get great return overtime. It’s by far the most used Benchmark, meaning most portfolio managers’ mandate is to beat the S&P 500 Index. And, most of them aren’t able to achieve that target!
We discussed the advantages of owning an S&P 500 Index, now time to tackle its drawbacks. The S&P 500 as its the case of most indexes can be volatile. When a manager is in charge, he can try to mitigate risk during tough times but with an index fund there is no one in charge. You are at the mercy of capital markets. If you can weather storms and stay put you should be able to achieve great long term results. Here is a look at the annualized average returns of the S&P 500 for the period ending June 30, 2019:
S&P500 Historical performance
Market index
S&P 500
1-year return
3.40%
15-year average
8.37%
10-year average
10.90%
15-year average
6.75%
As of the end of September 2019
The businesses that make up the S&P 500 index are a blend of large cap that can be either categorized as Growth or Value stocks. So, by investing in this Index, you will have no exposure to mid or small caps. In addition, If you’re seeking a dividend income, there is definitely other ETFs that can better respond to your needs.
What’s the Nasdaq100?
The Nasdaq 100 Index is a basket of the 100 largest, most actively traded U.S companies listed on the Nasdaq stock exchange. The index itself is not representative of the US economy rather a great way to get exposure to one of the most dynamic and innovative sector (Information Technology). What’s particular for the Nasdaq 100 is that it has no exposure to the US financial sector.
“The index leans heavy towards innovative companies that have become our ‘modern-day industrials,’ and accelerated by the pandemic, they play an even greater role in our daily lives. These include names like Apple, Alphabet and Amazon, as well as Netflix, Zoom and DocuSign. Biotech companies, including vaccine maker Moderna, are also well-represented,” According to Nasdaq website’s.
Annual performance of Nasdaq 100
Year
Annual performance
2020
48.88%
2019
39.46%
2018
0.04%
2017
32.99%
2016
7.27%
2015
9.75%
Comparison of the best S&P 500 ETFs (MER, Yield, Fund size and Beta)
Now that we are done with the definitions, below are the Best Canadian Index ETFs list. We will focus in our comparison on the largest ETFs in Canada in terms of the Asset Under Management.
The volatility is similar since both are tracking the same index and they are both Hedged.
Comparison: Nasdaq Index ETFs (Performance)
Name
1 Y (%)
3 Y (%)
5 Y (%)
ZQQ
-20.23
14.04
17.37
XQQ
-20.17
14.10
17.48
Source: Yahoo finance – as of July 11th – Total monthly returns
Disclaimer
The data on this website is for your information only. It does not constitute investment advice, or advice on tax or legal matters. Any information provided on this website does not constitute investment advice or investment recommendation nor does it constitute an offer to buy or sell or a solicitation of an offer to buy or sell shares or units in any of the investment funds or other financial instruments described on this website. Should you have any doubts about the meaning of the information provided herein, please contact your financial advisor or any other independent professional advisor.