The Schwab U.S. Dividend Equity ETF (SCHD) is one of the most popular dividend ETFs in the world — loved for its high yield, strong dividend growth, and quality stock selection. But for Canadian investors, buying SCHD directly isn’t always ideal due to currency conversion, U.S. withholding taxes, and account limitations (especially outside RRSPs).
So, what’s the best Canadian equivalent to SCHD?
Let’s break it down.
🏦 What Is SCHD?
Ticker: SCHD Provider: Charles Schwab MER: ~0.06% Dividend yield: Around 3.5–4.0% (paid quarterly) Holdings: 100 quality U.S. dividend stocks screened for consistency, profitability, and dividend sustainability.
Top holdings include: PepsiCo, Verizon, Cisco, Home Depot, Pfizer, Coca-Cola, and Texas Instruments.
The ETF focuses on high-quality companies with 10+ years of dividend payments, low debt, and strong free cash flow. That’s why SCHD has built a reputation for being one of the most reliable dividend growth ETFs on the market.
🇨🇦 Why Canadians Look for an SCHD Equivalent
While SCHD trades on the NYSE, Canadian investors face two main challenges:
Currency exchange fees: Most Canadian brokers charge 1.5–2.0% to convert CAD to USD.
U.S. withholding tax: Dividends paid by U.S. ETFs are subject to a 15% tax — unless held inside an RRSP.
To avoid those costs, many Canadians prefer Canadian-listed ETFs that replicate SCHD’s style — high yield, strong dividend growth, and exposure to large-cap companies.
For higher income seekers — adds covered-call overlay.
⚖️ Which One Is Most Like SCHD?
There’s no perfect one-for-one match, but here’s how they stack up conceptually:
–VDY is closest in spirit — it holds high-quality, large-cap dividend growers (mainly banks, telecoms, and energy).
–XDV uses an index methodology that resembles SCHD’s focus on consistent dividend payers with strong fundamentals.
–XDIV is ideal for investors who want low volatility and similar income levels, though it’s 100% Canadian equities.
If you want a Canadian version of SCHD’s high-quality dividend focus, VDY and XDV are your best pure equity choices.
If you’re after monthly income and yield over growth, ZWC offers a higher cash flow alternative using a covered-call strategy — more like JEPI than SCHD, but still relevant for income investors.
🌎 What If You Want the Same U.S. Exposure?
If you specifically want exposure to U.S. dividend stocks (like SCHD) without buying SCHD directly, two good options are:
ETF
Provider
Description
ZDY.TO
BMO
U.S. Dividend ETF (CAD-hedged/unhedged versions). Holds U.S. dividend payers, paid in CAD.
VGG.TO
Vanguard Canada
U.S. Dividend Appreciation Index (CAD version of VIG). Focuses on companies growing dividends 10+ years.
These two ETFs hold U.S. dividend stocks, but trade in CAD on the TSX — a true middle ground between SCHD and domestic dividend ETFs.
💰 Tax Tip: Hold SCHD in an RRSP, Not TFSA
If you decide to buy SCHD directly on the NYSE, it’s best held in an RRSP. That’s the only Canadian account type exempt from the 15% U.S. withholding tax on dividends under the Canada–U.S. tax treaty.
In a TFSA or non-registered account, you’ll lose 15% of the dividend income automatically — even before you file taxes.
🧩 Final Thoughts: Building “Your Own SCHD” in Canada
Here’s a simple way to mimic SCHD’s style with Canadian ETFs:
Component
ETF
Allocation
Purpose
U.S. Dividend Exposure
ZDY or VGG
50%
U.S. large-cap dividend stocks (CAD-denominated)
Canadian Dividend Core
VDY or XDV
40%
Blue-chip Canadian income
Monthly Income Booster
ZWC
10%
Covered-call overlay for extra cash flow
This mix gives you a diversified, high-yield portfolio across both U.S. and Canadian dividend payers — the closest possible Canadian version of SCHD, while keeping simplicity and tax efficiency.
📊 Key Takeaways
SCHD = high-quality, large-cap U.S. dividend ETF.
VDY, XDV, XDIV = best Canadian-listed substitutes.
ZDY or VGG = Canadian-listed ETFs that hold U.S. dividend stocks (true equivalents).
ZWC = higher monthly income option if you prefer cash flow over growth.
For direct SCHD exposure, hold it in an RRSP only to avoid U.S. withholding tax.
💬 Bottom Line
If you love SCHD’s strategy but invest primarily in CAD, 👉 VDY or XDV are your best Canadian equivalents. For a cross-border twist, ZDY or VGG give you SCHD-style exposure without leaving the TSX.
You’ll earn strong dividends, reduce currency hassle, and keep your portfolio simple — exactly what long-term investors want.
The goal: U.S. real estate exposure, Canadian simplicity
Many Canadian investors want to add real estate exposure to their portfolio without buying property directly. In the U.S., one of the most popular choices is VNQ — the Vanguard Real Estate ETF. It offers simple, diversified exposure to U.S. Real Estate Investment Trusts (REITs) — companies that own and operate income-producing properties like office buildings, warehouses, apartment complexes, and shopping centers.
With a yield near 3.7% and holdings in over 150 major U.S. REITs, VNQ has become a go-to ETF for long-term income and diversification.
But for Canadians, buying VNQ directly comes with complications:
It’s listed in USD, meaning conversion fees.
It’s subject to U.S. withholding tax on dividends (except in RRSPs).
It’s foreign property for tax reporting if you hold over $100,000 CAD in U.S. assets.
That’s why investors often search for a “VNQ Canadian equivalent” — something listed on the TSX, traded in Canadian dollars, and providing similar exposure.
🔍 Understanding what “equivalent” really means
When Canadians say “VNQ equivalent,” they’re usually looking for:
Unfortunately, there’s no Canadian-listed ETF that perfectly replicates VNQ’s portfolio of U.S. REITs. Instead, investors have a few practical options depending on their priorities.
🏢 Option 1 – Buy VNQ directly (U.S.-listed)
Ticker: VNQ (NYSE)
MER: 0.12%
Currency: USD
Yield: ~3.7%
Exposure: 100% U.S. REITs
Best account:RRSP (to avoid 15% withholding tax on dividends)
✅ Pros
Direct exposure to the full U.S. REIT market
Lowest fees and highest liquidity
Easy to understand and globally diversified within U.S. property types
⚠️ Cons
Must convert CAD to USD
Withholding tax applies in TFSA or non-registered accounts
FX fluctuations affect returns
💡 Tip: Holding VNQ inside an RRSP is often the most efficient approach — no U.S. tax drag and full exposure to American real estate.
🏦 Option 2 – Canadian REIT ETFs (not true equivalents but still real estate exposure)
If you prefer to stay fully in Canadian dollars, you can buy ETFs that hold Canadian REITs. These funds don’t track U.S. real estate, but they offer monthly income and exposure to Canada’s property market — often with higher yields.
ETF
Name
Focus
MER
Yield (approx.)
Key Holdings
ZRE.TO
BMO Equal Weight REIT Index ETF
🇨🇦 Canadian REITs
0.55%
~5.2%
RioCan, SmartCentres, Granite
VRE.TO
Vanguard FTSE Canadian Capped REIT ETF
🇨🇦 Canadian REITs
0.38%
~4.8%
Allied, RioCan, Granite
XRE.TO
iShares S&P/TSX Capped REIT ETF
🇨🇦 Canadian REITs
0.61%
~4.9%
CAR.UN, SmartCentres, RioCan
✅ Pros
Traded in CAD, no currency risk
Higher yields than VNQ
Suitable for TFSA, RRSP, or non-registered accounts
⚠️ Cons
Canadian REIT market is small (~20 stocks total)
Less diversified than VNQ
More concentrated in retail and residential properties
These ETFs are excellent for income stability, but remember: they track Canadian real estate, not the U.S. market.
💵 Option 3 – U.S. REIT mutual funds offered in Canada
If your goal is U.S. real estate exposure without trading in USD, some Canadian mutual funds invest directly in U.S. REITs. Examples include:
Fund
Provider
MER
Description
RBC U.S. REIT Fund (Series F)
RBC Global Asset Management
~1.4%
Diversified portfolio of top U.S. REITs
Fidelity U.S. REIT Fund (Series F)
Fidelity Investments Canada
~1.5%
Similar exposure to VNQ in CAD
TD U.S. Real Estate Fund
TD Asset Management
~1.9%
Active management of U.S. REITs
✅ Pros
Held in CAD (no FX conversion)
Provides true U.S. REIT exposure
Available through most Canadian brokerages
⚠️ Cons
Much higher fees (MERs over 1%)
May underperform passive ETFs like VNQ
These are often used in managed portfolios or by investors who want simplicity and don’t mind paying for it.
🌍 Option 4 – Global or U.S. total-market ETFs that include some REIT exposure
If you already hold a diversified U.S. total-market ETF such as VUN.TO or XUU.TO, you already own a small slice of U.S. REITs (about 2–3% of the index). However, this exposure is minimal and won’t replicate VNQ’s performance.
These ETFs are great for general diversification but not for targeted real-estate exposure.
⚖️ Choosing what’s best for you
Investor Type
Best Choice
Why
Want true U.S. REIT exposure
Buy VNQ (USD)
Exact same holdings as U.S. investors, low cost
Prefer to stay in CAD
ZRE.TO or VRE.TO
Canadian REIT exposure, high yield, no currency risk
Want U.S. REITs in CAD without converting currency
RBC or Fidelity U.S. REIT Funds
Mutual funds provide the correct exposure
Already hold total-market ETFs
No change needed
You already have minor REIT exposure
🧩 The bottom line
As of 2025, there is no ETF listed on the TSX that perfectly replicates VNQ’s exposure to U.S. REITs in Canadian dollars.
However, you still have excellent options:
Buy VNQ directly if you’re comfortable using USD (best inside RRSP).
Choose Canadian REIT ETFs like ZRE.TO or VRE.TO for local property exposure and higher yields.
Consider U.S. REIT mutual funds if you want VNQ-like exposure but prefer to stay in CAD.
Each approach has trade-offs in currency risk, taxes, and cost — but all can help you achieve the same goal: adding the stability and income of real estate to your investment portfolio.
Canadian investors love the stability and dividends of our big banks. For those seeking monthly income and steady returns, bank ETFs are among the most reliable income-generating options on the market. In this post, we’ll compare some of the best Canadian bank ETFs designed for income investors, focusing on those that pay monthly distributions.
🏦 Why Bank ETFs Are Popular in Canada
Canada’s financial sector is dominated by a handful of strong, well-capitalized institutions — the “Big Six”: RBC, TD, Scotiabank, BMO, CIBC, and National Bank. These banks have a history of paying consistent dividends, even during economic downturns.
Bank ETFs allow investors to:
Get instant diversification across major Canadian banks.
Earn attractive monthly income.
Enjoy professional management and liquidity without picking individual stocks.
💵 Top Monthly-Paying Bank ETFs in Canada
Below are the top-performing and most popular ETFs for Canadian income investors who want consistent monthly distributions.
🟩 1. Hamilton Enhanced Canadian Financials ETF (HMAX)
Dividend Yield: ~12.8% (monthly)
AUM: $1.7B+
MER: ~0.92%
Leverage: No leverage
Provider: Hamilton ETFs
Overview:
HMAX (Hamilton Canadian Financials Yield Maximizer ETF) is among the highest-yielding financial-sector ETFs in Canada, paying roughly 12–13% annually in monthly distributions.
It invests primarily in Canada’s Big Six banks — RBC, TD, Scotiabank, BMO, CIBC, and National Bank — along with major insurance companies such as Manulife, Sun Life, and Intact Financial. These firms anchor Canada’s economy and are known for their resilience and steady dividend histories.
Where HMAX stands apart is its aggressive covered call strategy. The fund writes at-the-money (ATM) call options on a portion of its holdings — meaning the strike prices are close to the current market price. This generates maximum option premium income, which significantly boosts its yield.
However, this also means less participation in market upside since many holdings may be called away during strong rallies. In other words, HMAX prioritizes income stability over capital appreciation, making it ideal for income-seeking investors, retirees, or those who want to enhance cash flow in a low-interest-rate or sideways market environment.
Importantly, HMAX is not leveraged, and all holdings are in Canadian dollars, reducing currency risk for domestic investors. It’s an excellent option for those who value predictable monthly income from Canada’s strongest financial institutions.
Summary:
Strategy: Covered calls (At-the-Money)
Focus: Maximum income generation
Yield: ~12–13%
Ideal for: Income investors prioritizing cash flow over growth
Pros: ✅ Extremely high monthly yield ✅ Broad exposure to banks and insurers ✅ Great for income-focused portfolios
Cons: ⚠️ Limited upside potential due to covered call strategy ⚠️ Not ideal for pure growth investors
🟦 2. BMO Covered Call Canadian Banks ETF (ZWB)
Dividend Yield: ~5.7% (monthly)
AUM: $3.5B+
MER: ~0.83%
Leverage: Non-leveraged
Provider: BMO Global Asset Management
ZWB (BMO Covered Call Canadian Banks ETF) is one of Canada’s most trusted income ETFs, offering exposure to the Big Six Canadian banks through a more conservative covered call strategy than HMAX.
ZWB’s portfolio includes RBC, TD, BMO, Scotiabank, CIBC, and National Bank, and it’s built to provide consistent monthly income while preserving a portion of the upside potential in rising markets.
Unlike HMAX, ZWB writes out-of-the-money (OTM) call options. This means the strike prices are slightly above the current share price, allowing the ETF to collect option premiums while still retaining some upside participation if bank stocks rise. As a result, ZWB’s yield (around 5–6%) is lower than HMAX, but investors benefit from better capital appreciation potential over time.
This OTM approach makes ZWB an excellent fit for balanced or conservative investors who want monthly income without fully sacrificing growth. In addition, ZWB’s distributions are often tax-efficient, consisting largely of eligible Canadian dividends and option premiums, which are taxed more favourably than interest income in non-registered accounts.
Managed by BMO Global Asset Management and backed by over $3.5B in AUM, ZWB offers liquidity, stability, and simplicity — a go-to ETF for long-term Canadian income portfolios.
Summary:
Strategy: Covered calls (Out-of-the-Money)
Focus: Balance between income and upside growth
Yield: ~5–6%
Ideal for: Conservative investors or retirees seeking steady income with growth potential
Pros: ✅ Reliable monthly distributions ✅ One of Canada’s largest and most established covered call ETFs ✅ Simple, low-risk exposure to the Big Six banks
Cons: ⚠️ Slightly higher MER ⚠️ Limited capital appreciation compared to plain index ETFs like ZEB
🟨 3. iShares S&P/TSX Capped Financials Index ETF (XFN)
Dividend Yield: ~2.6% (monthly)
AUM: $1.8B+
MER: 0.60%
Leverage: Non-leveraged
Provider: iShares (BlackRock Canada)
XFN (iShares S&P/TSX Capped Financials Index ETF) is a broad, low-cost exposure to Canada’s financial sector, offering investors a pure-play, growth-oriented approach to the country’s banks, insurers, and asset managers. Unlike covered call ETFs such as ZWB or HMAX, XFN does not use options strategies — it’s a straightforward index-tracking ETF, designed to mirror the S&P/TSX Capped Financials Index.
The ETF’s holdings include Canada’s Big Six banks (RBC, TD, Scotiabank, BMO, CIBC, National Bank), along with major insurance and financial services companies like Manulife, Sun Life, Intact Financial, and Brookfield Asset Management. This blend provides exposure to both banking profitability and insurance stability, giving investors well-rounded coverage of the financial industry.
With a dividend yield of about 2.5–2.7% paid monthly, XFN’s income stream is modest compared to covered call ETFs, but it offers stronger long-term growth potential. Because it doesn’t sell call options, XFN retains full exposure to capital gains during bull markets — making it more suitable for growth-oriented or total-return investors who want to participate fully in rising bank stocks.
From a cost perspective, XFN has a management expense ratio (MER) of 0.60%, which is reasonable given its large-cap exposure and liquidity. Its distributions are composed mainly of eligible Canadian dividends, making it tax-efficient for investors in non-registered accounts.
In summary, XFN is a solid, low-maintenance choice for investors who believe in the long-term strength of Canadian financials and prefer to capture both dividends and price growth without the trade-offs of a covered call strategy.
Summary:
Strategy: Passive index tracking (no covered calls)
Focus: Growth and dividend income from Canada’s largest financial firms
Yield: ~2.6% (monthly)
MER: 0.60%
Ideal for: Long-term investors seeking growth + moderate income
Pros: ✅ Diversified financial exposure ✅ Better total return potential ✅ Monthly dividends with low volatility
Cons: ⚠️ Lower yield than covered call ETFs ⚠️ Smaller income stream for pure income seekers
🟧 4. Hamilton Enhanced Canadian Bank ETF (HCAL)
Dividend Yield: ~4.7% (monthly)
AUM: ~$690M
MER: ~2.09%
Leverage: 1.25x leveraged
Provider: Hamilton ETFs
HCAL (Hamilton Enhanced Canadian Bank ETF) offers investors a unique way to boost income and returns from Canada’s most stable sector — the Big Six banks. Managed by Hamilton ETFs, HCAL uses a modest leverage strategy (approximately 1.25x) to enhance both yield and total return potential, while still maintaining a monthly distribution.
The ETF holds a concentrated portfolio of Canadian bank stocks, including RBC, TD, Scotiabank, BMO, CIBC, and National Bank. These institutions are known for their profitability, global diversification, and strong dividend track records — making them a cornerstone of most Canadian portfolios.
By applying 1.25x leverage, HCAL increases its exposure to the underlying bank stocks by 25%. This means that if Canadian banks perform well, HCAL’s total return and income can outperform non-leveraged bank ETFs like ZEB or ZWB. However, leverage also works both ways — in market downturns, losses are magnified compared to traditional ETFs.
HCAL does not use covered calls, so it retains full participation in market upside. Instead, it focuses on capital growth and dividend income, which it distributes to investors monthly. The fund’s MER is higher (~2.09%) due to the cost of leverage, but many investors find this acceptable given the enhanced yield (around 4.5–5%) and strong long-term potential when Canadian banks recover or interest rates stabilize.
From a portfolio-construction standpoint, HCAL fits best as a core satellite position for investors who already own conservative ETFs or GICs and want to boost returns without going into high-yield or covered call products.
Summary:
Strategy: Modest leverage (1.25x) on Canadian bank stocks
Focus: Enhanced income and growth (no covered calls)
Yield: ~4.5–5% (monthly)
MER: ~2.09%
Ideal for: Long-term investors comfortable with moderate risk and seeking higher total returns
Pros: ✅ Higher income potential ✅ Focused on Canada’s most stable sector ✅ Strong historical performance when rates stabilize
Cons: ⚠️ Leverage increases volatility ⚠️ More sensitive to interest rate changes
🧠 Final Thoughts: Which Is Best for You?
ETF
Yield
Growth Potential
Risk Level
Ideal For
HMAX
🔥 Very High (~12–13%)
⚡ Partial
Moderate
Income-focused investors seeking high yield with some upside exposure
ZWB
💰 Moderate (~5–6%)
✅ Balanced
Low–Moderate
Investors looking for a balanced approach between steady income and market growth
XFN
💵 Lower (~2.6%)
🚀 Full
Low
Growth-oriented investors focused on long-term capital appreciation
HCAL
⚡ Medium (~4.5–5%)
🚀 Strong
Moderate–High
Investors seeking enhanced total returns through moderate leverage
📊 Key Takeaway
If your goal is to generate steady monthly income, covered call ETFs like ZWB and HMAX offer a powerful mix of yield and stability. If you can handle more volatility, HCAL can boost returns — but always remember that higher yield = higher risk.
Diversifying across 2–3 of these ETFs can balance income, risk, and growth, making them ideal tools for Canadian income investors in 2025.
Both Vanguard’s VGRO and iShares’ XGRO are “one-fund” ETFs built for growth-focused Canadian investors. They each hold ~80% stocks and 20% bonds, offering global diversification, automatic rebalancing, and simplicity.
But which performs better? Let’s look side-by-side.
🔹 Verdict: Both are low-cost and diversified. XGRO edges out slightly on fees, while VGRO is preferred by investors loyal to Vanguard’s structure.
Both VGRO and XGRO are cost-effective, diversified growth ETFs designed for long-term Canadian investors. VGRO, managed by Vanguard Canada, charges a slightly higher MER of 0.25% versus XGRO’s 0.20% under BlackRock. Each maintains an 80% equity and 20% bond target, automatically rebalanced and unhedged for currency exposure. VGRO has the edge in brand trust and simplicity, while XGRO is marginally cheaper, appealing to fee-conscious investors. In essence, both funds deliver reliable diversification and ease of use; VGRO suits investors who prefer Vanguard’s structure, while XGRO offers nearly identical exposure at a slightly lower cost.
🌍 Geographic Exposure (2025)
Region / Country
VGRO
XGRO
United States
45.1%
39.8%
Canada
30.9%
34.4%
Japan
4.1%
4.8%
United Kingdom
2.4%
2.9%
China
2.4%
1.3%
France
1.5%
2.0%
Germany
1.5%
1.8%
Other Countries
10.1%
9.1%
🔹 VGRO = higher U.S. exposure, more focus on North America 🔹 XGRO = slightly broader international diversification
💼 Top Holdings (Underlying ETFs)
Allocation
VGRO
XGRO
U.S. Equity
Vanguard U.S. Total Market ETF – 36.8%
iShares Core S&P Total U.S. Stock ETF (ITOT) – 36.3%
🔹 VGRO: More Canada + U.S. 🔹 XGRO: More developed markets outside North America
VGRO and XGRO share a similar growth-oriented 80/20 structure but differ in regional focus. VGRO leans more toward North America, with heavier U.S. (36.8%) and Canadian (25.2%) exposure, appealing to investors seeking dividend-friendly Canadian content and U.S. market dominance. XGRO, meanwhile, allocates more to international developed markets (19.7%) through Europe and Asia, offering broader global diversification. On the fixed-income side, XGRO holds slightly more bonds (12.5% vs. 10.9%), providing marginally lower volatility. In short, VGRO favors home bias and growth from North America, while XGRO emphasizes diversification and slightly lower overall portfolio risk.
📈 Performance (as of September 2025)
Symbole
1 an
3 ans
5 ans
10 ans
XGRO.TO
18.53%
19.06%
11.90%
9.87%
VGRO.TO
18.41%
18.60%
11.72%
—
🔹 Performance is virtually identical. Source: Yahoo finance Long-term results will depend more on market conditions than fund choice.
⚖️ Pros and Cons
VGRO
XGRO
✅ Pros
– Higher U.S. weighting – More Canadian exposure (dividend tax benefit) – Simple Vanguard structure
– Lower MER – Broader global diversification – Slightly less volatile
⚠️ Cons
– Slightly higher cost – Less international exposure
– Slightly less U.S. weighting – Lower Canadian dividend weight
VGRO and XGRO share a similar growth allocation but appeal to slightly different investor preferences. VGRO offers higher U.S. and Canadian exposure, making it attractive to investors who value familiarity, dividend tax advantages, and Vanguard’s straightforward fund structure. However, this comes at the cost of a slightly higher MER and less international diversification. XGRO, on the other hand, stands out with a lower fee, broader global reach, and marginally lower volatility — ideal for investors seeking wider exposure beyond North America. In essence, VGRO favors home-country comfort and simplicity, while XGRO prioritizes cost efficiency and global diversification.
🧠 Which ETF Should You Pick?
Investor Type
Best Choice
Prefer more U.S. & Canadian exposure
VGRO
Prefer broader international diversification
XGRO
Fee-sensitive long-term investor
XGRO
Dividend-oriented Canadian investor
VGRO
Loyal to Vanguard philosophy
VGRO
Already using iShares Core ETFs
XGRO
💡 Bottom Line
Both VGRO and XGRO deliver what most investors need: ✅ Diversification ✅ Simplicity ✅ Low cost ✅ Long-term growth
They’re near-identical in structure and performance — your decision should hinge on fees, regional preference, and brand loyalty.
For most Canadians:
Choose VGRO if you want more North American exposure.
Choose XGRO if you prefer lower fees and slightly more global reach.
Either way, you’re investing smart — and staying the course matters far more than which ticker you choose.
Executive summary VDY vs XEI
When contemplating between VDY and XEI, the decision hinges on your investment goals. VDY emphasizes dividend yield, drawing from high-quality Canadian stocks, though it faced challenges due to a banking sector retreat. On the other hand, XEI, with a passive strategy, showcases resilience through the strength of the energy sector. Consider your risk tolerance and investment objectives—consistent growth or robust dividends. While VDY leans towards the latter, be mindful of its heavy exposure to the financial sector. In contrast, XEI offers a more stable trajectory. Weigh the nuances outlined to align your investment strategy with your financial objectives.
VDY:
VDY is a popular Canadian dividend ETF, offering instant exposure to a high-quality portfolio of high dividend-paying stocks. This Canadian-focused ETF aims to replicate the performance of the FTSE Canada High Dividend Yield Index, which comprises Canadian stocks with a high dividend yield. Managed by FTSE, a global leader in index creation, the index follows a meticulous process. It selects companies from the broad Canadian equity index (FTSE Canada Index) and evaluates their 12-month forward dividend yield using Thomson Reuters’ I/B/E/S. Stocks forecasted to pay no regular dividends in the next 12 months are excluded. The index then ranks and periodically screens for liquidity. In examining VDY’s objective, strategy, volatility, and performance, this post also delves into a comparison with rival ETFs, providing investors with a comprehensive overview of VDY stock in the Canadian dividend landscape.
XEI:
XEI ETF, managed with a passive strategy, aims to replicate the performance of the S&P/TSX Composite High Dividend Index ETF. Ideal for investors seeking long-term capital growth, XEI provides exposure to diversified sectors of Canadian companies. The ETF offers a monthly dividend income, catering to investors desiring frequent payouts. The S&P/TSX Composite High Dividend Index, comprised of 50 to 75 stocks, focuses on dividend income, with constituent issuer weights limited to 5% and sector weights capped at 30%. Managed by Standard & Poor’s, the index considers criteria like market capitalization, liquidity, and domicile on the Toronto Stock Exchange. Rebalanced quarterly, it ensures alignment with its objectives and provides geographic and economic balance across 11 GICS® sectors.
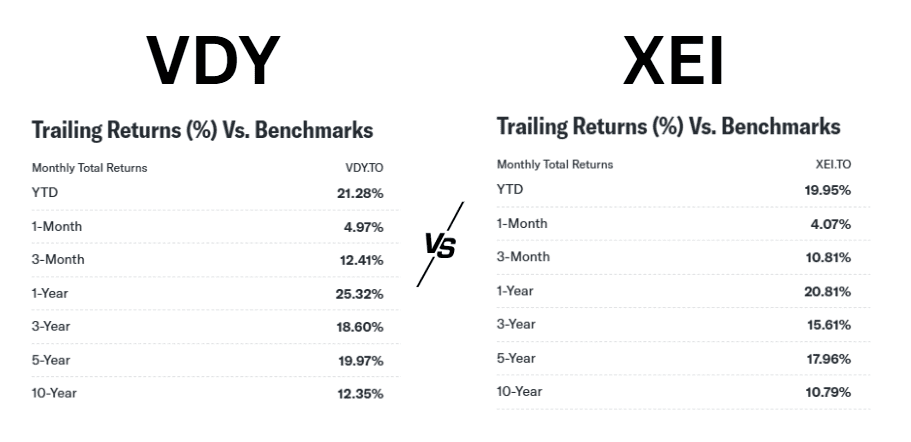
Performance comparison VDY vs XEI
VDY vs XEI: Full comparison
Objective and Strategy:
VDY, focusing on high-quality Canadian dividend stocks, replicates the FTSE Canada High Dividend Yield Index using a meticulous selection process. Meanwhile, XEI adopts a passive strategy, tracking the S&P/TSX Composite High Dividend Index ETF to provide exposure to diversified sectors of Canadian companies. Both ETFs aim to meet investors’ objectives, with VDY emphasizing high dividend yield and XEI targeting long-term capital growth.
Volatility and Performance:
VDY’s approach involves evaluating 12-month forward dividend yield, excluding stocks forecasted to pay no dividends. XEI, on the other hand, follows criteria such as market capitalization, liquidity, and domicile to ensure alignment with its objectives. Both strategies contribute to overall performance, with VDY emphasizing quality and dividend yield, while XEI offers exposure to a broad market with a focus on high dividends.
VDY.TO, despite its historical strong performance, faced headwinds at the start of the year due to a retreat in the big Canadian banking sector. The negative impact on VDY’s YTD return of -4.56% can be attributed to the significant influence of banking stocks in its portfolio. The retreat is likely associated with the rise in interest rates, a factor that tends to impact banking stocks negatively.
On the other hand, XEI.TO has displayed better performance YTD, with a positive return of 0.21%, mainly attributed to the resilience of the energy sector. The positive performance of the energy sector has acted as a buffer, mitigating the overall impact of sector-specific challenges faced by VDY.
Fees:
In terms of fees, both ETFs are tied, with an identical Management Expense Ratio (MER) of 0.22%. Vanguard, managing VDY, has a reputation for prioritizing investors and has a track record of lowering fees on their ETF lineup.
A crucial factor in ETFs is their size, influencing liquidity and trading dynamics. Both XEI and VDY have similar Assets Under Management (AUM) of approximately $1.76 billion and $1.77 billion, respectively, indicating sufficient size for buy-and-hold investors.
Holdings:
XEI tracks the S&P/TSX Composite High Dividend Index with 75 stocks, primarily concentrated in energy, financials, telecommunications, and utilities. VDY tracks the FTSE Canadian High Dividend Yield Index with 39 stocks, concentrated in financials, energy, telecommunications, and utilities. The distribution yields for XEI and VDY are close.
Conclusion
Personally, I lean towards VDY due to its emphasis on high-quality dividend stocks. However, I am mindful of its heavy exposure to the financial sector during portfolio allocation. This awareness allows for a balanced approach, considering both the strengths and potential challenges associated with VDY’s specific sector concentration.
The choice between VDY and XEI depends on investors’ preferences and objectives. VDY’s emphasis on dividend yield may appeal to income-focused investors, while XEI’s broad exposure and resilience in specific sectors may attract those seeking long-term growth.
Portfolio holdings
VDY ETF holdings
Holding Name
% of Market Value
Royal Bank of Canada
13.86%
Toronto-Dominion Bank
12.62%
Enbridge Inc.
7.46%
Bank of Nova Scotia
7.45%
Bank of Montreal
6.63%
Canadian Imperial Bank of Commerce
4.80%
Canadian Natural Resources Ltd.
4.67%
TC Energy Corp.
4.51%
Please refer to issuers’ website for the most up-to-date data
XEI ETF holdings
Name
Weight (%)
CANADIAN NATURAL RESOURCES LTD
5.72
NUTRIEN LTD
5.39
TC ENERGY CORP
5.12
ENBRIDGE INC
5.03
TORONTO DOMINION
5.02
SUNCOR ENERGY INC
4.85
ROYAL BANK OF CANADA
4.83
BCE INC
4.62
BANK OF NOVA SCOTIA
4.43
TELUS CORP
4.18
please consult issuers’s website for up-to-date data
The Global X Nasdaq-100 Covered Call ETF (QYLD) is one of the most popular income-oriented exchange-traded funds in the U.S. With a double-digit yield and the promise of monthly income, it attracts investors looking for consistent cash flow. But behind the headline yield, there are trade-offs that every investor should understand before buying.
This article provides a comprehensive review of QYLD, including how it works, its advantages, drawbacks, performance history, and whether it deserves a place in your portfolio. This post is available in Video format!
What Is QYLD?
QYLD was launched by Global X Funds in 2013. The fund is designed to provide high current income by using a covered call strategy on the Nasdaq-100 Index.
Here’s how it works:
QYLD buys all the stocks in the Nasdaq-100 (the same holdings as QQQ).
The fund then sells (“writes”) at-the-money call options on the Nasdaq-100 index.
The premiums collected from selling these options are distributed to shareholders as monthly dividends.
This strategy is often called a “buy-write” approach: you buy the index and simultaneously write calls against it.
Is QYLD a good investment?
Let’s break down the main benefits of holding QYLD:
Positives
Attractive Yield: QYLD consistently pays out yields in the 12–13% range, significantly higher than traditional dividend ETFs.
Monthly Income: Unlike many ETFs that pay quarterly, QYLD distributes income monthly — making it easier to plan cash flow for expenses.
Lower Volatility vs. QQQ: While it won’t fully protect against losses, the option premiums provide some cushion in choppy or declining markets.
Liquidity: With more than $6 billion in assets under management, QYLD trades with tight bid-ask spreads, making it accessible for retail and institutional investors alike.
Ease of Use: For investors who like the idea of covered calls but don’t want to manage options directly, QYLD offers a turnkey solution.
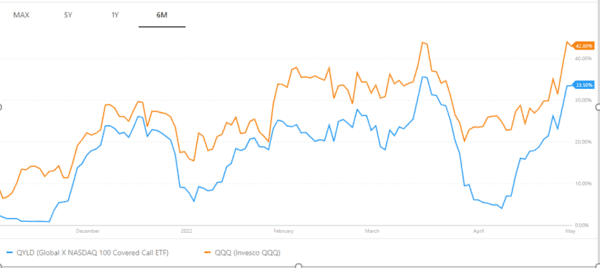
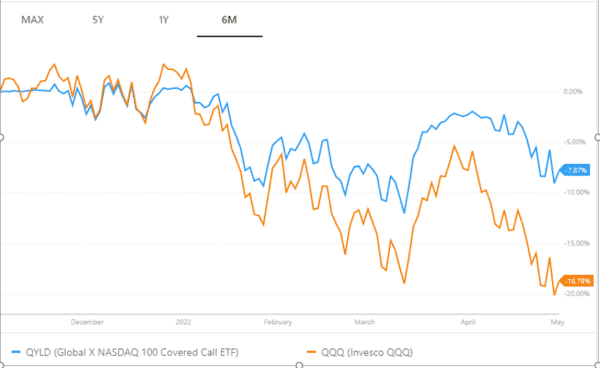
Volatility comparison: QYLD has a lower volatility than the NASDAQ 100 (source of graphic: portfoliolabs.com)In bear markets, QYLD protects investors and in normal circumstances will offer a better performance than the NASDAQ 100. The graphic depicts growth of 10K invested in the past 6 Months
The charts highlight that QYLD generally exhibits lower volatility than the Nasdaq-100. By writing covered calls, the fund collects option premiums that help smooth out price swings. This makes QYLD less sensitive to sudden surges and corrections, offering investors a steadier ride compared to a pure growth index ETF.
Over shorter horizons, this strategy shows its strengths in choppy or declining markets. The second chart illustrates how, during downturns, QYLD has been able to limit losses more effectively than the Nasdaq-100. The income from option premiums acts as a cushion, allowing the ETF to protect capital while still delivering monthly cash flow.
That said, the trade-off is visible during rising markets, where QYLD underperforms because its upside is capped. Investors benefit from more stability and reliable distributions, but they won’t fully capture the rallies of tech-heavy indices. In essence, QYLD prioritizes income and smoother performance over aggressive capital appreciation.
Negatives
Limited Growth Potential Since QYLD writes at-the-money calls, it essentially sells away most of the upside from Nasdaq-100 rallies. When tech stocks soar, QYLD captures very little of that growth.
NAV Decay Over Time The fund’s net asset value (NAV) tends to drift lower over the long term because option income often comes at the cost of capital appreciation. In other words, you get high income but sacrifice long-term wealth growth.
High Fees QYLD charges an expense ratio of 0.60%, which is steep compared to plain index ETFs like QQQ (0.20%) or VOO (0.03%).
Dividend Sustainability Concerns Distributions are largely driven by option premiums, which depend on market volatility. In calm markets, premiums are smaller, and dividends can shrink. Some payouts may also come from return of capital, which isn’t true “income.”
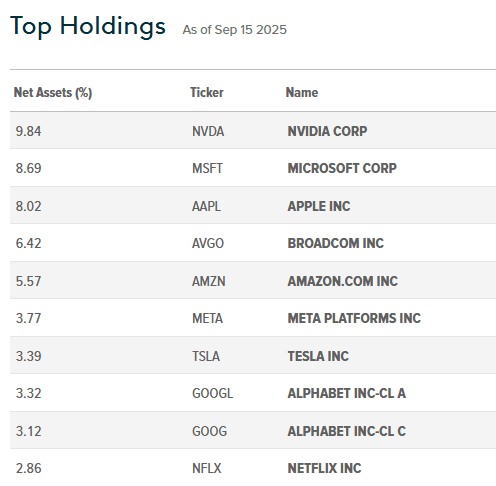
Concentration Risk Like QQQ, QYLD is dominated by large tech companies such as Apple, Microsoft, Nvidia, and Amazon. While diversified within tech, it doesn’t provide broad sector exposure.
Performance QYLD
ETF
Div Yld
QYLD
13.67%
–
QQQ
0.71%
Source: Yahoo finance – QYLD ETF
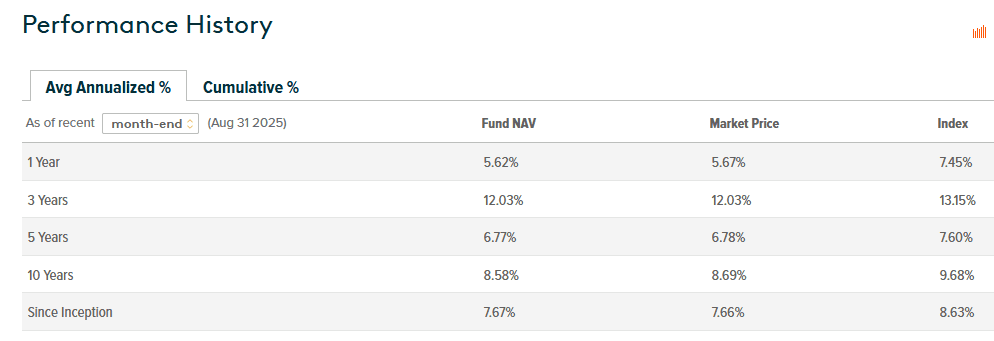
Over the past year, QYLD has delivered a total return of around 5.6%, reflecting modest gains supported primarily by its steady monthly income distributions. While its yield remains attractive, annual results can vary depending on market conditions and the premiums collected from selling options.
Looking at the medium term, performance has been uneven. The 3-year annualized return sits at 12.0%, boosted by periods of strong volatility, whereas the 5-year figure drops to 6.8%, showing how sensitive the strategy is to market cycles. QYLD tends to perform better in environments with heightened uncertainty where option premiums are larger.
Over longer horizons, QYLD has shown stable but moderate growth, with 8.6% annualized over 10 years and 7.7% since inception. This track record confirms its role as an income-driven product: consistent monthly cash flow with steady long-term returns, though without the explosive growth of pure equity strategies.
Is QYLD Sustainable? What is the risk of QYLD?
QYLD’s dividends come mainly from option premiums, which means payouts can vary with market volatility — often rising when uncertainty is higher. While this makes the income stream less predictable than traditional dividends, it also allows QYLD to maintain an attractive yield and steady monthly cash flow for income-focused investors. Over time, investors should expect less capital appreciation, since upside growth is traded for income, but for those prioritizing regular distributions and portfolio stability, QYLD can still be a reliable income-generating tool.
Is QYLD a monthly dividend
Yes, QYLD offers a monthly dividend distribution.
QYLD ETF Holdings
Practice example: covered call strategy
To better understand how QYLD’s strategy works, let’s look at a simple example. An investor owns 100 shares of Company A, priced at $30 each. Expecting the stock to stagnate or dip slightly, the investor sells a call option with:
Strike price: $26
Premium: $4
Maturity: April
Quantity: 100 shares
The investor collects $400 in option premiums (4 × 100). Two scenarios can occur:
Scenario
Stock Price Outcome
Action
Result
Case 1
Price rises above $30 (breakeven)
Buyer exercises the option → Seller must sell at $26
• Shares sold below market value • $400 premium collected offsets loss • Effective sale price = $30
Case 2
Price falls below $30 (breakeven)
Buyer does not exercise
• Seller keeps 100 shares • $400 premium collected as extra income • Generates additional return despite price drop
Video
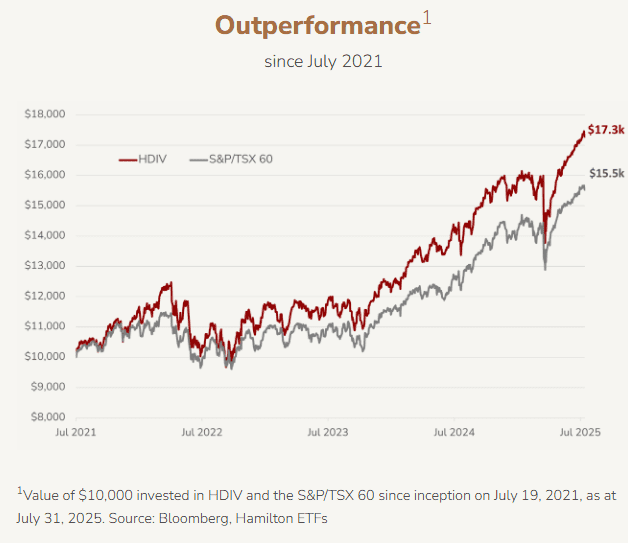
Since its launch in 2021, HDIV has become one of Canada’s most talked-about income ETFs. Its promise: deliver stable monthly income with lower volatility than the Canadian market, while giving investors access to multiple key sectors through an actively managed, covered call strategy.
With a distribution yield of around 12%, HDIV is built for investors seeking consistent cash flow rather than maximum capital appreciation. This makes it especially appealing for retirees, income-oriented investors, and anyone looking to balance returns with risk management.
Recent Performance
Since inception, HDIV has outperformed the S&P/TSX 60 Index. For example, between July 2021 and July 2025, a $10,000 investment in HDIV grew to $17,300, compared to $15,500 for the S&P/TSX 60.
This outperformance is largely explained by the ETF’s ability to consistently add option premiums to the dividends already paid by the underlying securities. While HDIV does cap upside during strong bull markets (a natural tradeoff with covered call strategies), it has shown resilience in volatile periods, providing investors with steady income even in challenging environments.
Structure and Strategy
HDIV is a fund of funds: it doesn’t buy stocks directly but invests in a suite of Hamilton ETFs, each of which applies a covered call strategy.
Covered calls generate option premiums on top of dividends, significantly boosting income.
Sector diversification spans Canadian banks, energy, utilities, gold, technology, and healthcare — giving broader exposure than the traditional Canadian market, which is heavily concentrated in financials and energy.
Leverage (25%) is used to enhance yields. The fund’s leverage is capped at 125% of NAV, keeping it within a moderate range.
Monthly distributions are a core feature, providing reliable cash flow.
Sector Allocation (July 2025)
Financials: 36%
Technology: 17%
Energy: 13%
Gold: 12%
Utilities: 14%
Healthcare & others: ~8%
This allocation blends defensive sectors (banks, utilities, gold) with growth engines (technology, healthcare), creating a balanced income-oriented portfolio.
Fees (MER)
As of July 2025, HDIV’s Management Expense Ratio (MER) is 2.55%.
It’s important to note that the fund itself charges no direct management fee. The MER reflects operating expenses + the fees of the underlying Hamilton ETFs.
While this is high compared to traditional index ETFs, it is in line with other derivative-based income strategies and justified by the complexity of managing covered call positions and sector exposure.
✅ Advantages of HDIV
High and stable monthly income: with a 12% yield, it meets the needs of retirees and cash flow-focused investors.
Broader diversification: exposure to sectors like technology and healthcare helps reduce Canada’s natural concentration in banks and energy.
Lower volatility: option premiums cushion downturns, reducing overall volatility compared to the market.
Moderate leverage: enhances yield while remaining controlled.
Reliable cash flow: monthly payouts align with investors’ income needs.
Turnkey solution: instead of managing multiple sector-specific covered call ETFs, investors can access them all through HDIV.
⚠️ Risks and Limitations
Capped upside: in strong bull markets, HDIV will underperform broad indices due to options limiting gains.
Leverage risk: while moderate, the 25% leverage amplifies both gains and losses.
Sector concentration: despite diversification, exposure to banks and energy remains significant.
High fees (2.55% MER): part of the income goes to covering costs.
Market risk: covered calls cushion declines but don’t eliminate losses in prolonged downturns.
Interest rate sensitivity: like many income products, HDIV may face pressure when rates rise.
Reinvesting vs. Taking Distributions (DRIP or Cash)
Income-oriented investors (e.g., retirees) may prefer taking cash distributions to fund expenses.
Growth-focused investors may choose to reinvest via a Dividend Reinvestment Plan (DRIP), compounding returns over time.
The choice depends on your goals: immediate income or long-term wealth building.
🎯 Conclusion
HDIV is a unique Canadian ETF that combines high income, sector diversification, and covered call strategies into a single product. It is best suited for conservative and income-focused investors who value stability and cash flow over growth.
That said, investors must be aware of its tradeoffs: capped upside in bull markets, higher fees, and modest leverage risks.
👉 In short: HDIV is an excellent passive income tool, ideal for generating monthly cash flow and stabilizing a portfolio, but less suitable for maximizing long-term capital growth.
Video
The DJQ1100, also known as the Desjardins Investment Savings Account – Series F, is an interesting savings solution for investors who want to maximize the security of their capital while maintaining great flexibility. In this article, we’ll explore why this product can be a great choice for investors looking to balance yield, security, and liquidity.
Why choose DJQ1100?
The DJQ1100 offers a unique combination of advantages, positioning it as a powerful tool for different investor profiles.
First of all, the DJQ1100 guarantees optimal security. Deposits in this account are insured by the Autorité des marchés financiers (AMF), which guarantees the protection of the capital invested. This feature makes this product an ideal choice for conservative investors who want to minimize risk.
Secondly, this account offers full liquidity. Funds are available at any time, with no lock-in period or withdrawal fees. This flexibility makes it particularly useful for short-term financial needs or in the event of unforeseen events.
In addition, the interest rates offered by the DJQ1100 are competitive. The return is calculated daily and paid monthly, ensuring steady and predictable capital growth.
In addition, this product does not have any fees. Unlike some mutual funds or guaranteed investment certificates (GICs), the DJQ1100 has no management or service fees, maximizing returns for investors.
Finally, the DJQ1100 is very accessible. A minimum initial investment of only $1,000 is required, making it affordable for a wide audience of investors. This accessibility, combined with other benefits, makes the DJQ1100 an attractive and versatile savings solution.
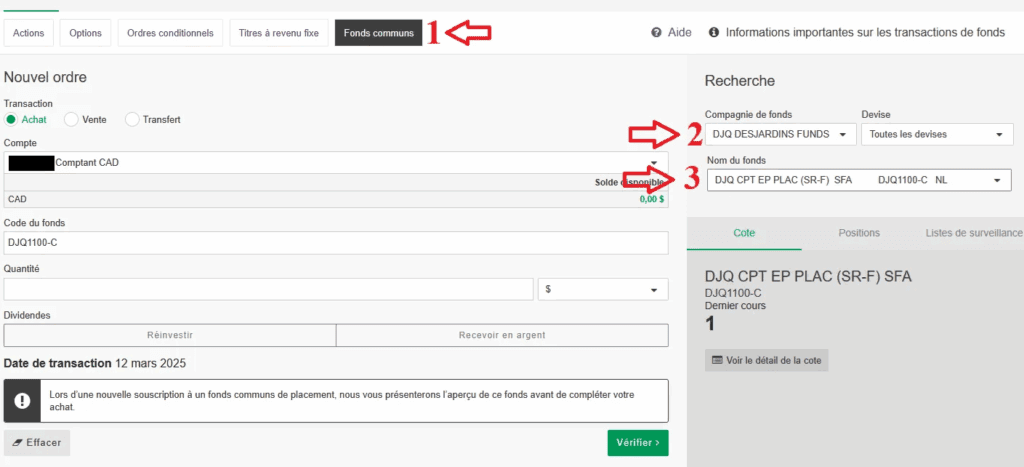
How to buy a Desjardins mutual fund (DJQ1100-C) step by step on your online broker
Step 1: Choose the “Mutual Funds” tab
In the navigation bar (at the top), click on Mutual funds (arrow 1).
This opens the form to place an order.
Step 2: Select the fund company
In the menu on the right, select the fund company (e.g. DJQ DESJARDINS FUNDS) (arrow 2).
You can also select the currency if necessary.
Step 3: Choose the fund
In the “Fund name” field, select the desired fund (in this case, DJQ CPT EP PLAC (SR-F) SFA, code DJQ1100-C) (arrow 3).
The fund code is automatically entered in the central section (“Fund Code”).
Step 4: Enter the transaction details
Make sure that the Buy option is checked (top left).
Choose your account (e.g. “CAD Cash”).
Enter the amount in CAD or the quantity of units you want to buy.
Choose what you want to do with the dividends : reinvest or receive cash.
Step 5: Verification and confirmation
Checks the transaction date (example: March 12, 2025).
Click on Check (green button at the bottom right).
You will have an overview of the transaction before confirming the purchase.
Ideal investor profile
The DJQ1100 is designed for investors who:
Prioritize security: Ideal for protecting capital while earning a reasonable return.
Want flexibility: Perfect for investors who may need to access their funds quickly.
Plan for the short or medium term: Useful for building an emergency fund or preparing short-term projects.
Comparison with other financial products
Characteristics
DJQ1100
GIC (Guaranteed Investment Certificate)
Mutual Funds
Security
Guaranteed by the AMF
Capital guarantee
No warranty
Accessibility of Holdings
Available at all times
Locked-in until maturity
Liquid but with possible fees
Yield
Competitive rates, paid monthly
Fixed, predictable
Variable, market-dependent
Management fees
None
None
Often high
Investment horizon
Short to medium term
Short to medium term
Medium to long term
Use Cases
1. Emergency Fund
The DJQ1100 is a great option for building an emergency fund thanks to its full liquidity and security. Investors can access them quickly when needed while enjoying a competitive return.
2. Transition to a long-term investment
If you’re waiting for the right time to invest in stocks or ETFs, DJQ1100 can serve as a temporary solution to grow your capital while waiting for an opportunity.
3. Short-term investment
For short-term projects like a trip, renovation, or major purchase, the DJQ1100 offers a stable return and easy access to funds.
Points to consider
Despite its many advantages, DJQ1100 has some limitations that investors should consider before committing.
First, yields are limited. While the product offers great security, the DJQ1100 does not offer the high returns that one might get with riskier investments, such as stocks or exchange-traded funds (ETFs). This is a trade-off to consider for those looking for maximum capital growth.
Secondly, this product does not promote long-term growth. The DJQ1100 is primarily designed to meet short- and medium-term needs. It is less suitable for investors who want to build wealth over several decades or maximize their long-term returns. As a result, investors looking for a sustainable and future-oriented solution may need to supplement this product with other investment options.
Summary table of benefits
Benefits
Description
Security
Capital guaranteed by the AMF.
Flexibility
Full access to funds at any time, with no withdrawal fees.
Interest rate
Competitive, calculated daily and paid monthly.
No fees
No management or transaction fees.
Admissibility
Available for RRSPs, TFSAs and non-registered accounts.
Conclusion
The DJQ1100 is a versatile financial product that offers security, flexibility and reasonable returns. It is ideal for conservative investors or those looking for a tool to manage short-term needs. However, for long-term growth objectives, it would be relevant to explore options such as ETFs or stocks.
If you’re looking for a balance between safety and return in the short term, DJQ1100 could be a smart choice. Don’t hesitate to consult a financial advisor to integrate this product into your overall strategy.
Introduction: A strategy to turn your portfolio around
Investing in the stock market is more than just buying and selling stocks. For investors looking for additional income, options can offer attractive opportunities — provided they understand the risks and mechanisms.
Among the strategies available to retail investors, the wheel strategy is becoming increasingly popular. It combines two types of options — puts and calls — in a logical cycle, aimed at acquiring shares at a good price and generating recurring revenue.
Let’s take a step-by-step look at how this strategy works, its benefits, its risks, and some concrete examples tailored to Canadian investors.
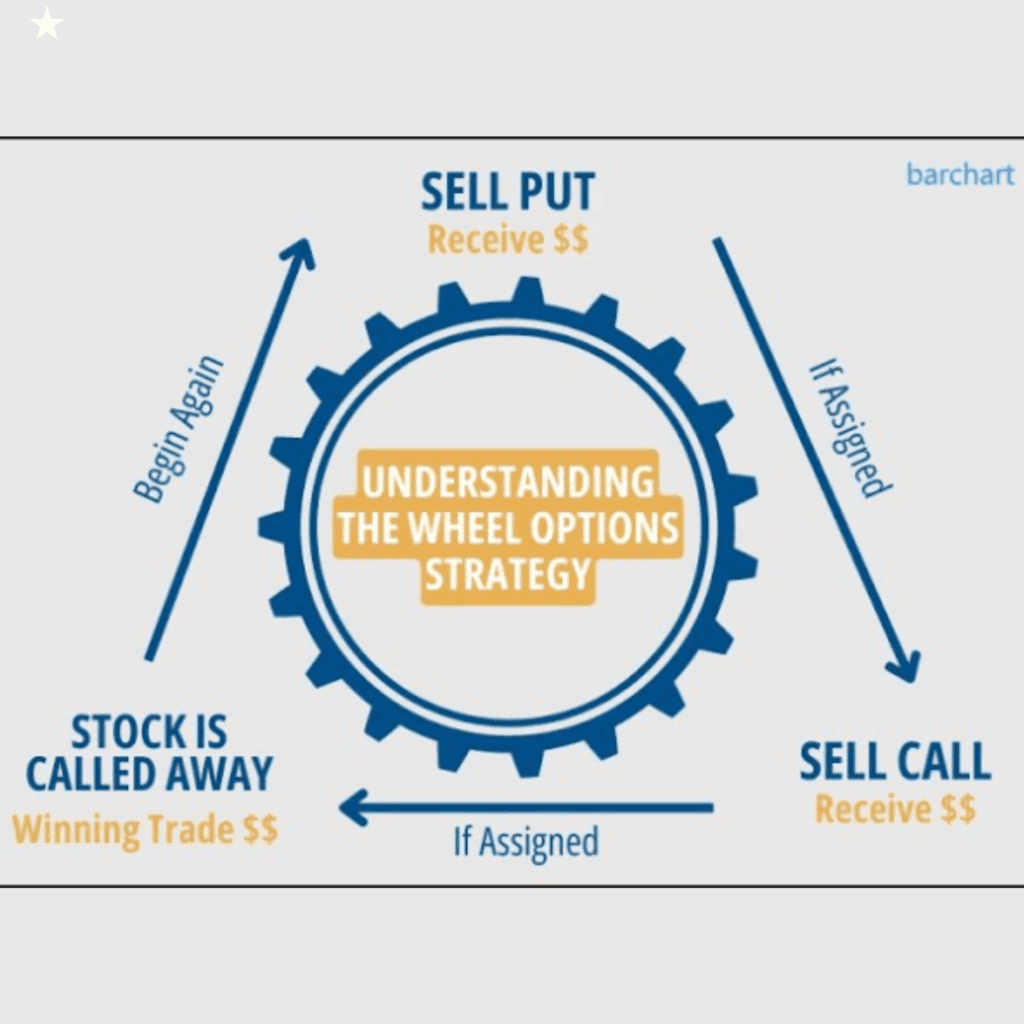
What is the wheel strategy?
The wheel strategy is an investment method based on covered calls and puts. It is based on a simple idea:
Buy a stock at a good price, then sell call options to generate income for as long as you own that stock.
It’s a passive income strategy that can work on quality stocks that you’d be willing to hold for the long term.
Conditions for applying the policy:
Be willing to buy 100 shares of a security
Use an account that allowsCovered Options Trading(e.g.:Questrade, Interactive Brokers, etc.)
Understanding how cash-secured puts and covered calls work
The three phases of the wheel
Step 1: Sell a put (cash-secured)
You start by selling a put option on a stock you want to own. This means that you commit to buying 100 shares at a given strike price if the stock falls.
Example:
You sell a $50 put on XYZ stock, expiring in 30 days.
You receive a bonus of $1.50, or $150 (1.50 × 100).
You must have $5,000 in cash available in case you need to buy the shares.
Two possible scenarios:
The stock stays above $50 → you keep the premium, and you start over.
The stock falls below $50 → you buy 100 shares at $50 (contract obligation).
Step 2: Sell a covered call
Now that you own all 100 stocks, you move on to the next phase: writing a covered call option. This commits you to selling your shares at a set price if the stock goes up.
Example:
You hold 100 shares of XYZ purchased at $50.
You sell a call at $55 for a premium of $1.00 → you cash in another $100.
Two possible scenarios:
The stock stays below $55 → you keep your shares and the premium.
The stock exceeds $55 → your shares are sold at $55 → you cash in a capital gain + the premium.
Step 3: Start the cycle again
Once your shares are sold via the call exercise, you return to step 1: sell a new put. And so on.
This is why it is called a “wheel strategy“: a continuous cycle of selling puts and calls, which can generate regular income.
Why use the wheel strategy?
Benefits:
Regular passive income thanks to the premiums collected
Ability to buy shares at a discount
Suitable for stable and liquid stocks (e.g., Canadian banks, large corporations)
Great strategy for long-term investors looking to accumulate capital
Disadvantages and risks:
You must have enough capital to buy 100 shares
If the stock falls sharply, you may incur an unrealized loss
You limit your gains with calls if the stock goes up too quickly
Premiums can vary greatly depending on volatility
The wheel strategy combines the selling of put options and call options to generate passive income while buying and selling stocks. It attracts investors who are looking for a disciplined and potentially profitable method.
Among the advantages, we note first of all the bonuses collected regularly, which bring an interesting income stream. Secondly, selling puts allows you to buy shares at a discount, under certain market conditions. This strategy is particularly suitable for stable and liquid stocks, such as large Canadian banks or TSX companies. It fits well into a long-term approach, focused on capital accumulation.
But the wheel also carries risks. You need to have enough capital to buy 100 shares per position. If the stock falls sharply, the investor can suffer a significant unrealized loss. In addition, the gains are limited if the stock rises quickly, since the call sets a sell price. Finally, income varies according to volatility: in quiet periods, premiums are lower.
It is therefore an interesting strategy, but one that requires rigour and understanding of the options.
A concrete example with a Canadian action
Let’s take a fictitious example with TD Bank (TD. TO):
Current Price: $102
You sell a put with a strike price of $98, 30-day expiration, and you receive a premium of $1.50→ You cash out $150 ($1.50 × 100 shares)
If the stock drops below $98 at maturity → you are assigned and you buy 100 TD shares at $98→ Total cost: $9,800, but your net cost is $9,650 (thanks to the premium received)
You now own the shares. You sell a covered call at $105 with a premium of $1.20→ You cash in another $120
Two possible scenarios:
If TD exceeds $105 at maturity, your shares are sold at $105→ Capital gain of $700 ($105 – $98) + $120 premium = $820 total gain
If TD stays below $105, you keep your shares and can sell another call
Tips for using the strategy well
Choose strong stocks with good fundamentals
Avoid stocks that are too volatile or highly speculative
Use short maturities (7 to 30 days) to maximize premiums
Always monitor your available capital to meet your commitments
Keep a logbook of your transactions (premiums received, strike price, maturity)
If you apply the wheel strategy, whether in the Canadian or American market, there are some best practices that are still essential. Start by selecting quality stocks with good fundamentals, stable profitability and good liquidity. In Canada, securities such as banks (TD, BMO) or Enbridge are often used. In the United States, we find Apple, Coca-Cola and Pfizer.
Avoid highly volatile or speculative stocks, often found on the NASDAQ or Canadian small caps. They offer high premiums, but the risk is also greater.
Use short maturities (7 to 30 days) to maximize premiums and be able to react quickly if the market moves. This is true on both sides of the border.
Always watch your available capital, especially with the CAD/USD exchange rate if you operate in both markets. It is important to have enough cash to buy 100 shares if you are assigned.
Finally, keep an accurate logbook of your trades in both markets. Record the premiums collected, the strike price, the maturity dates and the results. This will help you better assess your overall performance.
Useful tools for Canadian investors
Canadian exchanges: TSX, TSXV (use an option-eligible account)
Compatible brokers : Questrade, BMO InvestorLine, Interactive Brokers, Desjardins Courtage en ligne
Position tracking: Excel, Google Sheets, or specialized software
In short
Stage
Action
Objective
1
Sell a put
Trying to buy the stock at a good price + cashing in a premium
2
Sell a covered call
Generate income from the shares held
3
Recommence
Repeat the cycle for regular income
Conclusion: A simple strategy, but not without risks
The wheel strategy is not a “sure shot,” but it can be a great tool for patient and disciplined investors. It allows you to turn market volatility into income, while remaining exposed to stocks you’d be willing to hold.
Before using it, make sure you understand the options, assess your financial goals, and start small, with something you’re familiar with.
CIBC Investor’s Edge is a division of CIBC Investor Securities Inc., a subsidiary of Canadian Imperial Bank of Commerce (CIBC). With relatively low transaction fees and discounts for students and active traders, this is a service worth considering.
Current Offer
Why choose CIBC investors’ edge
If you want a one-stop-shop for your banking and investing needs, CIBC Investor’s Edge might actually be the best choice for you.
Overall, it offers:
Brokerage service offered by a major Canadian bank
Lower trading fees than other major banks
All account options available
Easy access from mobile and desktop devices
Commitment to updates and innovation
One-Stop Financial Service Center
List of qualifying accounts
RRSP, TFSA, RESP, RRIF, LIRA, LRIF and non-registered accounts qualify. The first qualified account of each type that is opened will receive the cash credit. For the purposes of the offer, joint accounts do not qualify as a different account type, thus any rebate will only be paid to one joint or individual account of each kind, not both.
CIBC investor-friendly Fees and commissions
The CIBC Investor’s Edge trading platform is not only competitive with other major banking brokerages in Canada, it is considerably cheaper when it comes to daily trading fees, reaching a flat fee of $6.95 per online transaction on stocks and ETFs.
This is lowered to $5.95 if you are still under a student account And $4.95 if you reach the ‘active trader’ threshold of 150 trades per quarter.
Although not quite on par with the leading low-cost (non-bank brokerage firms) like Questrade, Qtrade and Wealthsimple Trade, CIBC’s online discount brokerage beats all other major bank brokerage firms in this regarding trading fees.
Video (Take a tour)
Type of accounts offered
You can open all major investment accounts using CIBC Investor’s Edge, including:
That means you can transfer as much as you want and get started. This is especially useful if you are just learning trading and investing.
Security
CIBC is one of the largest banks in North America and one of the top five in Canada. Also, CIBC Investor’s Edge is a division of CIBC Investor Services Inc., a subsidiary of CIBC.
Note: CIBC Investor Services Inc. is a member of the Canadian Investor Protection Fund (CIPF) and the Investment Industry Regulatory Organization of Canada (IIROC).
Fee per transaction below average
$6.95 per stockand ETF trading is lower than most of the big 5 banks. The savings here can be significant.
If you have a CIBC Smart™ account for students, you get $1 off every equity stock and ETF trade , making it a little easier to discover and learn.
Discount on transaction fees for active traders
If you make more than 150 trades per quarter, you can register as an “active trader”, which gives you an additional discount on fees, up to $4.95 per trade.
The CIBC Investor’s Edge mobile app offers users a convenient way to monitor account balances and trade stocks, ETFs and options anytime, from anywhere. Users can also stay informed about important investment news, such as new IPOs, so they can take advantage of new opportunities as they arise.
Users will also have access to charts and tables to help them analyze their entire portfolio in one easy-to-read view, or review different investment accounts separately.
FAQs (CIBC Investor’s Edge Review)
Does CIBC Investor’s Edge offer trading fee rebates?
They do. If you have a CIBC Smart account for students, you’ll pay $5.95 per stock and ETF trade instead of the usual $6.95 per equity trade .
If you make more than 150 trades per quarter, you can register as an “active trader” and get an additional $1 rebate, paying only $4.95 per trade.
I’m new to investing, is CIBC Investor’s Edge the right choice for me?
CIBC services offer a lot of support, information, and educational material for new traders. Please note, it does not offer practice accounts.
Is there a minimum investment required to start using CIBC Investor’s Edge?
There’s none. You can start with as much or as little money as you want.