When investors think about artificial intelligence, they tend to focus on what is most visible: AI models, software platforms, semiconductors, and cloud providers. Yet as we move into 2026, one of the most critical constraints on AI growth is not software or chips—it is something far more basic:
The electrical grid.
AI is an energy-intensive technology. Data centers consume enormous amounts of electricity, require near-perfect reliability, and concentrate demand in very specific geographic locations. Even if power generation (nuclear, gas, renewables) keeps pace, the existing grid was not designed for this type of load.
This makes electrical grid and transmission infrastructure one of the most underappreciated investment themes tied to AI—and one of the most durable.
In this article, we focus specifically on grid-focused ETFs, why they matter, how they benefit from AI, and why they deserve attention in 2026 portfolios.
1. Why the Grid Is the Real AI Bottleneck
Power generation often gets the headlines: nuclear plants, uranium, renewables. But electricity is useless if it cannot be delivered reliably and efficiently.
Most North American grids were built:
Decades ago
For centralized power plants
With predictable consumption patterns
Without massive 24/7 industrial-scale loads
AI data centers break all of those assumptions.
What AI Changes
AI infrastructure creates:
Extreme power density (especially for GPUs)
Constant demand (no downtime tolerance)
Localized demand spikes near data center hubs
Grid stability challenges
In many regions, the grid—not power generation—is now the limiting factor for new data center approvals. Utilities are delaying or rejecting projects simply because transmission and distribution systems cannot handle the load.
This is why capital spending is increasingly flowing not just into power plants, but into:
Transmission lines
Substations
Transformers
Grid automation
Energy management systems
And this is where grid-focused ETFs come into play.
2. GRID ETF: Pure Exposure to Grid Modernization
One of the most direct ways to invest in this theme is through GRID.
What GRID Actually Owns
GRID focuses on companies involved in:
Electrical transmission and distribution
Smart grid technologies
Power management systems
Grid automation and monitoring
Electrification infrastructure
Rather than owning utilities themselves, GRID targets the companies that build, upgrade, and manage the grid.
This is a critical distinction.
Utilities are regulated and often slow-growing. GRID, by contrast, holds firms that benefit from capex cycles, not rate approvals.
Why GRID Is Well Positioned for AI
AI-driven grid demand creates three powerful tailwinds for GRID holdings:
1️⃣ Massive Grid Upgrade Spending
Governments and utilities are committing hundreds of billions to grid modernization over the next decade. Much of this spending is non-discretionary—the grid must be upgraded, regardless of economic cycles.
2️⃣ Technology-Driven Grid Complexity
AI loads require:
Real-time monitoring
Advanced load balancing
Redundancy and resilience
This favors companies selling high-margin technology solutions, not just physical hardware.
3️⃣ Long Project Pipelines
Grid projects are multi-year undertakings. Once contracts are awarded, revenue visibility is high, supporting stable cash flows.
GRID effectively turns these structural realities into a diversified equity exposure.
3. PAVE ETF: Broader Infrastructure with Grid Leverage
While GRID is highly targeted, PAVE offers a broader approach.
PAVE is not a pure energy ETF—but that is part of its strength.
What PAVE Includes
PAVE holds companies involved in:
Infrastructure construction
Engineering and materials
Industrial equipment
Transportation and utilities support
Power and transmission infrastructure
Many of its holdings benefit directly from:
Substation construction
Transmission expansion
Data center site development
Grid hardening and resilience projects
Why PAVE Works for Grid Investors
PAVE’s value lies in indirect exposure.
AI-driven grid upgrades require:
Concrete
Steel
Construction equipment
Engineering services
Industrial components
PAVE captures this second-order demand, which is often overlooked when investors focus only on “energy stocks.”
It also provides:
Broader diversification
Less thematic concentration
Exposure to government infrastructure bills
For investors who want grid exposure without betting exclusively on energy technology, PAVE serves as a core infrastructure allocation.
4. Government Spending: A Structural Tailwind
One reason grid ETFs are attractive is that government spending aligns with AI needs.
Across North America and Europe, policy priorities include:
Grid resilience
Electrification
Energy security
Climate transition
National competitiveness in AI
Grid upgrades are politically favorable:
They create jobs
Improve reliability
Support industrial growth
Enable AI and digital infrastructure
Unlike speculative tech spending, grid investment is bipartisan and strategic.
This creates a rare alignment:
Private sector demand (AI data centers)
Public sector funding (infrastructure programs)
GRID and PAVE are positioned at the intersection of both.
5. AI Data Centers and Demand Concentration
One unique challenge of AI is demand concentration.
Traditional electricity demand is spread across millions of homes and businesses. AI data centers, by contrast:
Consume as much power as small cities
Are clustered geographically
Require dedicated transmission capacity
This forces utilities to:
Build new transmission corridors
Upgrade substations
Install high-capacity transformers
Invest in redundancy
Companies supplying these components often enjoy:
High barriers to entry
Long customer relationships
Recurring upgrade cycles
Grid ETFs aggregate exposure to these firms without requiring investors to pick individual winners.
6. Risk Profile: Why Grid ETFs Are More Defensive Than AI Tech
Compared to AI software stocks, grid ETFs have a very different risk profile.
Advantages
Less valuation risk
Real asset exposure
Revenue tied to physical necessity
Long-term contracts and project pipelines
Risks
Interest rate sensitivity
Regulatory delays
Slower growth than pure tech
Capital intensity
This makes grid ETFs particularly attractive as:
Portfolio stabilizers
Inflation-resilient assets
Complements to growth tech holdings
They may not deliver explosive returns—but they offer durable, structural growth.
7. How to Use GRID and PAVE in a Portfolio
Conservative Allocation
GRID as a thematic satellite
Combined with utilities or dividend ETFs
Balanced Allocation
GRID for targeted grid exposure
PAVE for broader infrastructure diversification
Growth-Oriented Allocation
Grid ETFs alongside AI, semiconductors, and energy
Focus on long-term structural demand rather than short-term cycles
For most investors, grid ETFs work best as complements, not standalone holdings.
8. Why the Grid Theme Extends Beyond 2026
The most important point is this:
Grid investment is not a one-cycle story.
Once AI infrastructure is built:
Power demand does not decline
Maintenance and upgrades continue
Redundancy requirements increase
In other words, the grid does not “finish” upgrading—it evolves continuously.
This gives grid-focused ETFs one of the longest runways of any AI-related investment theme.
Conclusion: Owning the Wires Behind AI
AI may be digital, but its backbone is physical.
No matter which AI models win, which software platforms dominate, or which chips outperform, electricity must flow—reliably, continuously, and at scale.
That reality makes electrical grid and transmission infrastructure one of the most critical—and investable—AI enablers.
ETFs like GRID and PAVE allow investors to own this backbone:
Without betting on individual projects
Without chasing AI hype
With exposure to long-term, unavoidable investment needs
For 2026 and beyond, grid ETFs are not just an energy play—they are a strategic AI infrastructure allocation.
With interest rates still elevated and market volatility remaining a reality in 2026, many Canadian investors are actively searching for reliable monthly income without having to sell their investments. As a result, monthly income ETFs—particularly those using covered call strategies—have gained significant traction among retirees and income-focused portfolios.
Among Canadian providers, Hamilton ETFs has emerged as a specialist in high-income, covered-call-based ETFs, offering sector-specific solutions designed to convert market volatility into consistent cash flow.
In this article, we review the best Hamilton ETFs for monthly income in 2026, explain how their covered call strategies work, and help you determine which ETF may align best with your income needs and risk tolerance. The goal is not to chase yield blindly, but to understand how these ETFs fit within a well-structured income strategy.
Why Income Investors Choose Hamilton Covered Call ETFs
1. HMAX ETF Review – Canadian Bank Covered Call Income
HMAX ETF focuses on Canada’s major banks and financial institutions (RBC, TD, BMO, Scotiabank, etc.) and uses an active covered call strategy to generate higher monthly income.
Here is the key point most investors misunderstand: HMAX typically sells call options on about 50% of the portfolio, not 100%.
What does that mean in simple terms?
On half of the holdings, the manager sells at-the-money call options (usually short-term, often monthly).
In exchange, the ETF collects option premiums, which are paid out as monthly income.
The other 50% of the portfolio remains uncovered, allowing some participation in upside when bank stocks rise.
This balanced approach helps:
boost income without fully eliminating growth potential,
reduce volatility compared to fully covered portfolios,
and smooth cash flow for income-focused investors.
Investors like HMAX because it transforms relatively stable Canadian banks into a predictable monthly income source, while still keeping partial exposure to long-term capital appreciation.
Why invest in financials in the first place?
Financials—especially Canadian banks and insurers—are often considered a core sector for income-oriented investors.
Here’s why many investors allocate to financials:
Essential role in the economy Banks sit at the center of economic activity: lending, mortgages, payments, credit cards, and wealth management. As long as the economy functions, financial institutions remain relevant.
Strong cash flows Large banks generate consistent earnings which supports reliable dividends.
Dividend history and discipline Canadian banks, in particular, have a long track record of paying dividends.
Inflation and rate sensitivity In certain environments, higher interest rates can improve bank margins, helping earnings and income generation.
Lower volatility than many sectors Compared to tech or commodities, financials tend to be more stable, making them suitable for income-focused portfolios.
Best for: Investors seeking reliable income from Canadian financials, especially retirees who value predictable cash flow.
Key risk: Limited upside during strong bank rallies due to covered calls.
2. QMAX ETF Review – Technology Covered Call ETF for Monthly Income
QMAX ETF targets large-cap U.S. technology stocks and uses an active covered call strategy to turn volatility into monthly income.
Here’s what many average investors misunderstand: QMAX typically writes call options on about 50 % of the portfolio rather than fully covering all holdings.
What this means in practice:
On roughly half of the tech shares, the ETF sells at-the-money call options with short expiries (often monthly),
It collects premium income from those sales,
While the other half remains uncovered, allowing the portfolio to benefit from potential upside if tech stocks rally.
This strategy helps balance income generation with growth potential. Investors like QMAX because:
It offers higher monthly distributions than owning the stocks outright,
It harnesses the volatility inherent in tech stocks to generate cash flow,
And it still retains participation in market upswings thanks to the uncovered portion of the portfolio.
Why invest in technology in the first place (for QMAX)?
Technology stocks, particularly large-cap U.S. tech companies, are a cornerstone of many long-term investment portfolios — and there are several reasons investors choose this sector before even considering income strategies like QMAX:
Long-term growth leadership Many tech firms are market leaders with innovative products and services, strong competitive moats, and global reach. Over the past decade, technology has consistently led market returns.
High profitability and reinvestment power Dominant role in the modern economy Tech companies power digital transformation across industries — cloud computing, artificial intelligence, digital payments, social media, and more — making them less cyclical and more resilient over time.
Innovation-driven earnings Diversification benefit Including technology exposure in a portfolio can help diversify risks associated with sectors like financials, utilities, and energy.
Best for: Income investors who still want exposure to technology, but with lower volatility than owning tech stocks outright.
Key risk: Strong tech bull markets may cap upside returns.
UMAX ETF focuses on utility companies and uses a covered call strategy with at-the-money (ATM) options to generate enhanced monthly income.
A key point many average investors miss: UMAX typically sells ATM call options on about 50% of the portfolio, not on all holdings.
In simple terms:
On roughly half of the utility stocks, the ETF sells ATM call options, meaning the strike price is close to the current market price.
ATM options generate higher option premiums than out-of-the-money calls, which boosts monthly income.
The remaining 50% of the portfolio stays uncovered, allowing some participation if utility stocks rise.
Why invest in utilities in the first place?
Utilities are often considered defensive investments because:
Demand for electricity, water, and gas is relatively stable, regardless of economic cycles.
Revenues are often regulated, which can lead to more predictable cash flows.
Utility stocks tend to be less volatile than the broader market.
Investors like UMAX because it combines the stability of utilities with enhanced income generation, making it appealing for conservative, income-focused portfolios.
Why invest in utilities in the first place (for UMAX)?
Utilities are a core defensive sector in many investment portfolios, and there are solid reasons investors allocate to them before even considering income strategies like UMAX:
Stable demand and essential services Utility companies provide electricity, water, gas, and related infrastructure—services people and businesses need regardless of economic conditions.
Predictable cash flows Because their services are essential and often regulated, utilities tend to generate steady, predictable income, which supports reliable dividends.
Lower volatility
Defensive characteristics during downturns
Dividend focus Many utility companies have a history of paying dividends, appealing to investors seeking income and stability.
Best for: Conservative investors prioritizing capital stability and income consistency.
Key risk: Interest-rate sensitivity typical of utility stocks.
SMAX ETF is designed for investors seeking attractive monthly income while maintaining diversified exposure to large-cap U.S. equities across multiple sectors. With a current yield of 10.79% and monthly distributions, SMAX aims to convert equity market volatility into consistent cash flow.
The ETF holds a broad mix of U.S. stocks that closely resembles the sector composition of the S&P 500, including technology, financials, healthcare, consumer sectors, and energy. Instead of concentrating on a single theme, SMAX provides diversification across the U.S. economy, reducing reliance on any one stock or sector.
To generate income and reduce volatility, SMAX employs an active covered call strategy. Importantly, the coverage ratio is flexible, meaning calls are written on only part of the portfolio and adjusted over time to balance income generation with upside participation.
Best for: Investors seeking diversified U.S. exposure with monthly income.
Key risk: Income may fluctuate depending on market volatility.
5. AMAX ETF Review – Gold Miners Covered Call ETF for Income
AMAX ETF stands out because it combines gold producer exposure with an active covered call strategy to generate monthly income—a rare combination in the Canadian ETF landscape.
Unlike physical gold or traditional gold ETFs, AMAX invests in gold-mining companies, whose revenues and cash flows are leveraged to the price of gold. This creates higher volatility, but also higher option premiums, which the fund monetizes by selling covered call options. Those option premiums are the primary driver of AMAX’s income distributions.
Key characteristics include:
Exposure to gold miners, not bullion
A potential hedge against inflation and currency weakness, as gold often performs well when real interest rates fall
Higher volatility than traditional income ETFs, due to both commodity price swings and equity market sensitivity
AMAX is best viewed as a diversification and inflation-protection tool, rather than a core income holding. It can complement traditional income ETFs by adding a non-correlated income source, but investors should be comfortable with larger price swings in exchange for income and diversification benefits.
Best for: Investors seeking diversification and inflation protection, with income.
Key risk: Commodity price fluctuations can impact NAV.
Important Risks of High-Yield Covered Call ETFs
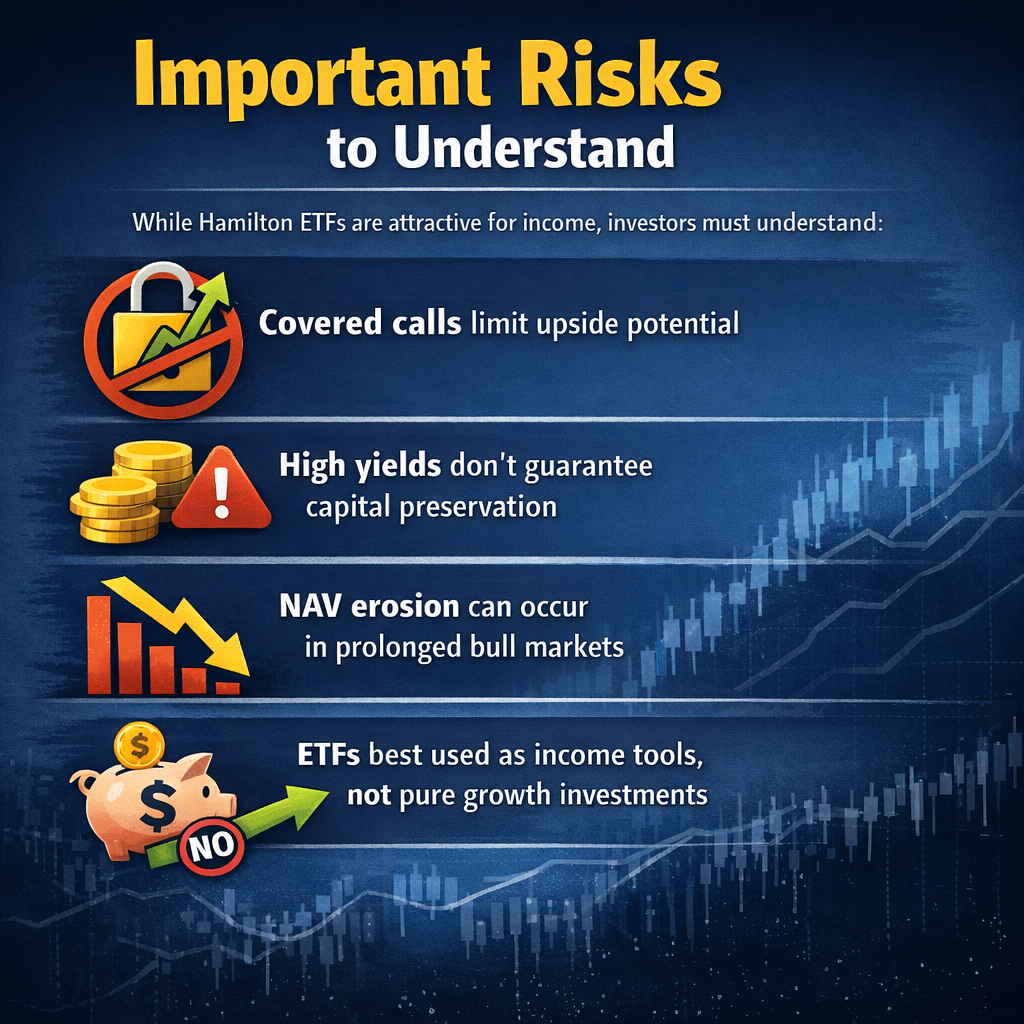
While Hamilton ETFs are attractive tools for generating monthly income, it is essential for investors to clearly understand the trade-offs involved before allocating capital. These ETFs are designed primarily for cash flow, not for maximizing long-term capital appreciation.
First, covered calls limit upside potential. By selling call options on a portion of the portfolio, the ETF collects option premiums that fund distributions. However, when markets rise sharply, gains on the covered portion are capped. This means investors may underperform the broader market during strong bull runs.
Second, high yields do not guarantee capital preservation. A double-digit yield can be appealing, but it does not imply safety. Distributions are generated from option premiums and dividends—not guaranteed returns—and market declines can still reduce the ETF’s net asset value (NAV).
Third, NAV erosion can occur in prolonged bull markets. When equities trend upward for extended periods, repeatedly selling calls can cause the ETF to lag the underlying stocks. Over time, this may result in slower NAV growth or even erosion compared to non-covered strategies.
Finally, these ETFs are best used as income tools, not pure growth investments. They are most effective when used intentionally—such as funding retirement income, enhancing portfolio cash flow, or replacing part of a bond allocation—rather than as long-term growth engines.
In short, Hamilton ETFs can play a valuable role in an income-focused portfolio, but success depends on understanding their mechanics and using them for the purpose they were designed for: reliable income, with controlled risk—not maximum growth.
Final Thoughts
Hamilton ETFs offer some of the most compelling monthly income solutions available to Canadian investors today. By combining sector-focused equity exposure with actively managed covered call strategies, these ETFs can play a meaningful role in:
retirement income planning,
cash-flow-focused portfolios,
and yield enhancement strategies.
However, they are not one-size-fits-all investments. The higher income comes with clear trade-offs, including capped upside and potential NAV erosion over time. Understanding how each ETF generates income, which sector it targets, and the risks involved is essential before allocating capital.
Used thoughtfully—often as part of a broader, diversified portfolio—Hamilton ETFs can help investors prioritize income without losing sight of long-term portfolio stability. The key is aligning the ETF selection with your objectives, time horizon, and tolerance for volatility, rather than focusing solely on headline yields.
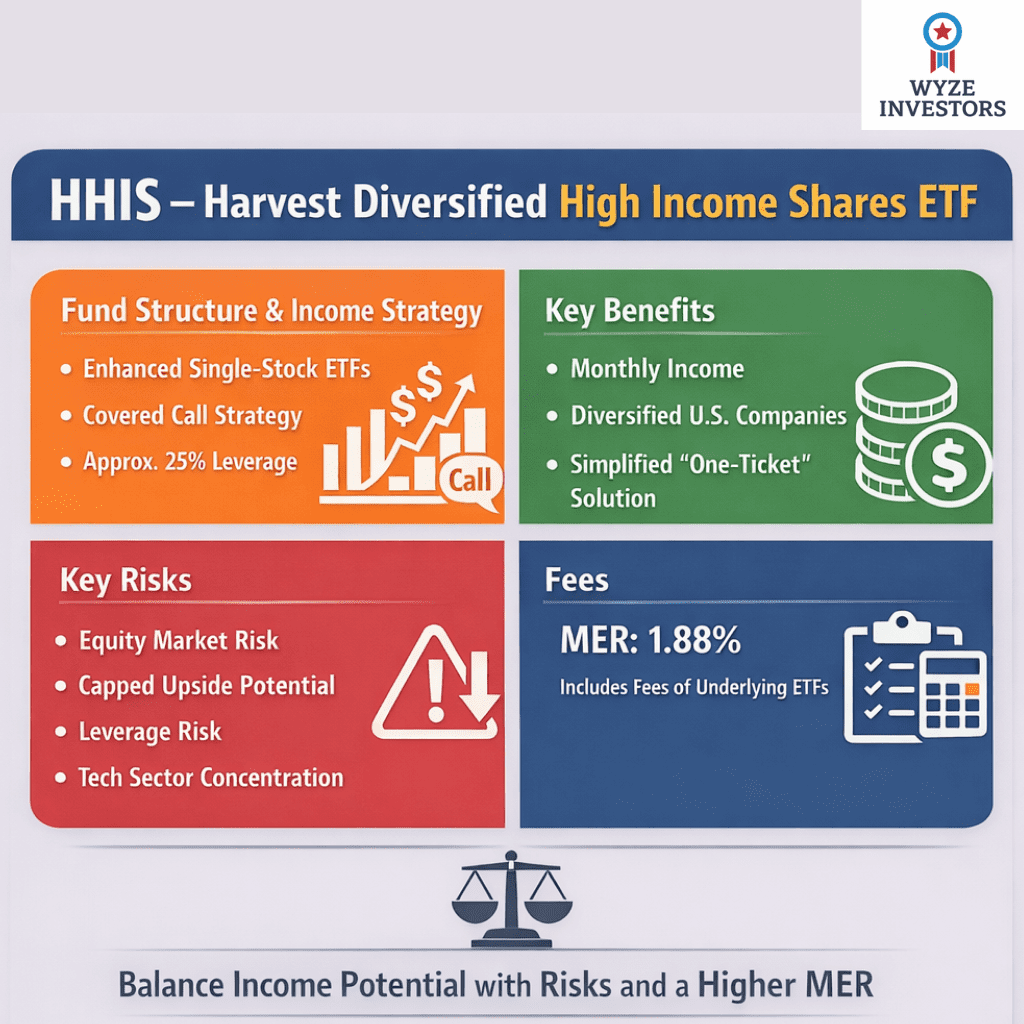
The Harvest Diversified High Income Shares ETF (TSX: HHIS) is designed to provide investors with diversified exposure to U.S. companies while generating a relatively high level of monthly income. It does this primarily through a portfolio of enhanced single-stock ETFs that use an active covered call strategy, and in certain cases, modest leverage. HHIS may appeal to investors looking for income from companies that are traditionally associated with growth rather than dividends.
This article provides an objective overview of how HHIS is structured, what it holds, how income is produced, potential advantages, risks, and how the ETF may fit within an investment portfolio.
Executive summary
ETF Objective and Investment Approach
HHIS seeks to combine three elements in one product:
exposure to large, well-known U.S. companies
monthly cash distributions
diversification through a basket of individual enhanced income ETFs
The ETF does not attempt to track a specific index. Instead, it is actively managed. Portfolio managers select and weight holdings and determine covered call activity levels. The primary income source is option premium generated by selling covered call options on the underlying positions.
HHIS is available in Canadian dollar and U.S. dollar trading classes, making it accessible to investors with income preferences in either currency.
Video
Portfolio Structure and Holdings
HHIS holds a portfolio of Harvest single-stock High Income Shares ETFs rather than owning individual securities directly. Each of those underlying ETFs typically:
focuses on one publicly listed U.S. company
writes covered calls on a portion of its position
may employ modest leverage (approximately 25% in enhanced series)
distributes income monthly
Therefore, HHIS functions as a fund-of-funds.
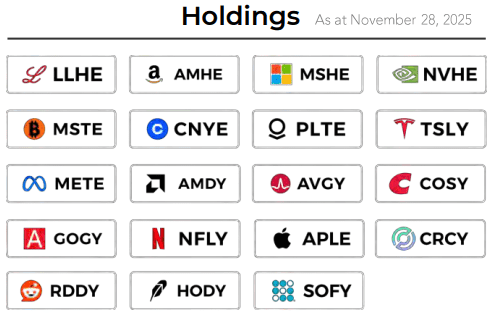
Holdings are diversified across several well-known U.S. companies in areas such as technology, e-commerce, semiconductors, pharmaceuticals, and fintech. Examples include ETFs tied to:
Allocations may change over time as the manager adjusts exposures. Investors should consult the most recent fact sheet or management report for precise weighting and current holdings.
Covered Call Strategy
The defining feature of HHIS is its covered call writing strategy implemented at the underlying ETF level. A covered call involves:
holding a stock or ETF
selling call options on that asset
collecting option premiums in exchange for giving up some potential upside
Option premiums collected contribute materially to monthly distributions. However, covered call writing also reduces participation in strong upside price movements because gains above the option strike price are limited or foregone when calls are exercised.
Harvest typically limits overwrite levels to a maximum of 50% of the portfolio, allowing some portion of assets to remain uncovered, which preserves participation in potential growth.
The strategy is actively managed, meaning:
coverage levels may be adjusted based on volatility
strike selection varies
expiration timing can change based on market conditions
When volatility increases, option income potential typically rises but so does equity risk. When volatility is low, premium income declines but market conditions may be calmer.
Use of Leverage
Some of the single-stock enhanced ETFs within HHIS use approximately 25% leverage. The stated goal is to:
increase exposure to core holdings
potentially increase option premium income
enhance total return over time
However, leverage also magnifies losses during market downturns and increases portfolio volatility. Borrowing costs associated with leverage can rise when interest rates increase, which can impact fund performance and net income.
Investors considering HHIS should be aware that leverage is a meaningful risk factor and contributes to both higher income potential and increased drawdown risk.
Return of Capital (ROC): What HHIS investors should know
Investors in HHIS will notice that distributions may sometimes include Return of Capital (ROC). This is common among covered-call income ETFs and fund-of-fund structures. Understanding ROC is important because it affects taxation, adjusted cost base, and long-term returns.
What ROC is (and isn’t)
ROC is a distribution that is not immediately taxed as income when received in a taxable account. Instead, it is treated as a return of your own invested capital. Because it is not taxed when paid, ROC reduces your Adjusted Cost Base (ACB). When you eventually sell units, a lower ACB may result in a larger capital gain.
ROC does not automatically mean the fund is “giving your money back.” In covered-call ETFs, ROC can result from:
option premium income
portfolio rebalancing
distribution-smoothing policy
fund-of-fund tax mechanics
However, if ROC remains persistently high and NAV declines over time, investors should evaluate whether distributions are being supported by option income or primarily by capital erosion
Key Advantages
Objectively, potential advantages of HHIS include:
Diversified exposure to leading companies
Investors gain access to multiple large-cap and innovative U.S. businesses in one ETF, which may reduce single-stock risk compared with owning only one growth company.
Monthly income distribution
The covered call strategy produces option premiums that support regular monthly cash flow, which can be attractive for those drawing income or reinvesting distributions.
Simplicity
HHIS combines:
security selection
option writing
rebalancing
distribution management
into one product, reducing the need for active involvement from the investor.
Lower capital threshold
Some underlying U.S. companies trade at high share prices. HHIS allows fractional exposure through an ETF trading on the TSX at a typically lower per-unit price.
Key Risks, Limitations and Fees
HHIS also carries meaningful risks. Key considerations include:
Equity market risk
The ETF primarily invests in equities. Market downturns can significantly reduce net asset value.
Capped upside potential
Covered call strategies limit capital appreciation during strong bull markets because option income is earned in exchange for foregoing some gains.
Leverage risk
Leverage magnifies returns in both directions. Losses are accelerated during market drawdowns and borrowing costs can affect returns when interest rates are high.
Sector concentration risk
Although diversified by issuer, many holdings are concentrated in technology-oriented industries. Sector-specific downturns can materially affect fund performance.
Distribution risk
Monthly distributions are not guaranteed and can fluctuate or be reduced depending on market conditions and option income availability.
Fees
Fees deserve special attention. HHIS has a Management Expense Ratio (MER) of 1.88%. This figure already includes its proportionate share of the fees of the underlying ETFs in which it invests. The MER is typical for actively managed, leveraged, covered-call fund-of-funds structures in Canada, but it is higher than broad index ETFs and some U.S.-listed covered call ETFs, which can be cheaper. Investors should weigh the higher cost against what they receive in exchange: professional options management, leverage handling, and a bundled one-ticket portfolio of single-stock covered call strategies.
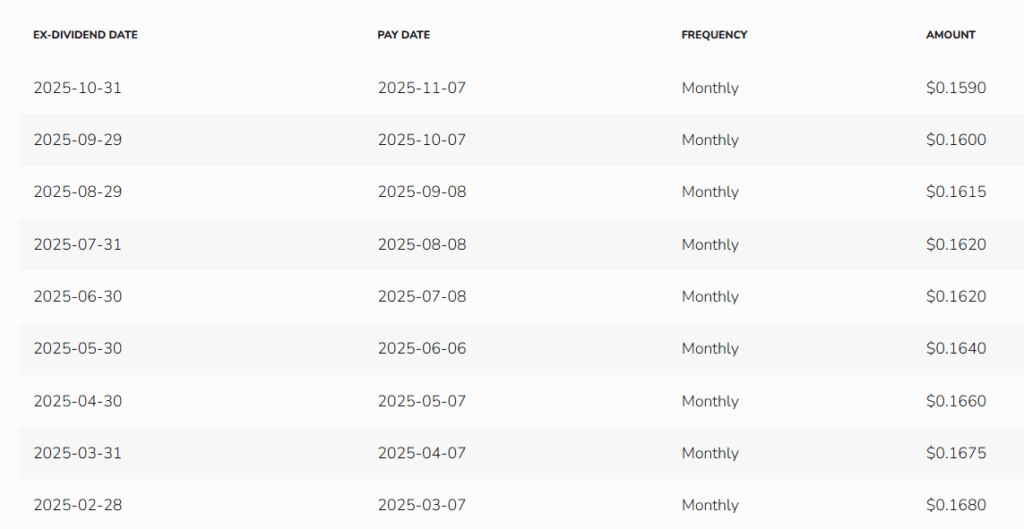
Performance / Distributions
The Performance / Distributions table provides information about HHIS’s cash-flow history rather than its total return, because performance figures cannot be shown until the ETF has completed one full year from its inception date of January 16, 2025. Until that milestone is reached, the table focuses on distributions. It lists the record date, ex-dividend date, payment date, monthly amount per unit, and the cumulative total since inception. The amounts shown indicate that HHIS has made consistent monthly distributions, with payments of $0.25 per unit initially and a gradual increase to $0.27 per unit later in the year. This table helps investors understand the income stream generated so far, the timing of distributions, and how much has been paid in total since launch, even though full performance metrics such as total return and risk statistics will only be available after the first year of operation.
are comfortable with equity risk and distribution variability
understand that upside potential may be partially capped
accept leverage as part of the strategy
It may appeal to:
income-focused investors
retirees or pre-retirees seeking cash flow
investors who hold traditional index ETFs but want income-tilted exposure
those seeking diversification among several well-known U.S. companies
Financial advisors and portfolio managers may also use HHIS in discretionary portfolios for income mandates.
About the ETF Provider
HHIS is managed by Harvest ETFs, an independent Canadian asset manager specializing largely in income-oriented exchange-traded funds. The firm emphasizes investment in established companies combined with disciplined options strategies. Harvest manages multiple High Income Shares ETFs and a variety of sector and thematic income funds.
Conclusion
HHIS offers a way to obtain diversified exposure to major U.S. companies while generating consistent monthly income through an active covered call approach. Its structure simplifies access to covered call strategies and enhanced single-stock ETFs in a single product. However, investors must balance the benefits of income and diversification against the trade-offs of capped upside, leverage, sector concentration, and equity market risk.
HHIS may be appropriate for investors seeking income-focused equity exposure who understand how covered calls and leverage affect risk and return. As with any investment decision, prospective investors should review the prospectus, management reports of fund performance, and risk disclosures, and consider how HHIS fits within their broader financial objectives and risk tolerance.
VOO is one of the most owned ETFs on the planet. Managed by Vanguard, it tracks the S&P 500 index — the 500 largest publicly traded companies in the United States. With an expense ratio of just 0.03%, it is among the cheapest investment products ever created. Warren Buffett has famously recommended it. Millions of American investors hold it as their core retirement position.
For Muslim investors in both the United States and Canada, VOO comes up constantly. It is simple, cheap, and widely recommended. But is it halal?
The answer is no — VOO is not halal in its standard form. But understanding why, and what to do instead, is what this article is about.
What Does VOO Actually Hold?
VOO tracks the S&P 500 index, which includes 500 of the largest U.S. companies weighted by market capitalization. As of 2026, the top holdings include Apple, Microsoft, Nvidia, Amazon, Alphabet (Google), Meta, Berkshire Hathaway, and JPMorgan Chase.
At first glance this looks promising — tech companies dominate the top of the list, and many of them pass Sharia screening individually. But the S&P 500 is a broad market index, which means it holds companies from every sector of the economy — including sectors that are categorically excluded under Islamic finance principles.
Why VOO Is Not Considered Halal
There are two main reasons VOO fails Sharia screening.
Problem 1 — Financial Sector Holdings
The S&P 500 includes a significant allocation to the financial sector — approximately 12-15% of the total index depending on market conditions. This includes:
JPMorgan Chase — the largest U.S. bank by assets, whose primary business is interest-based lending
Bank of America, Wells Fargo, Citigroup — all excluded for the same reason
Berkshire Hathaway — Warren Buffett’s conglomerate, which owns major financial businesses including insurance companies and a large stake in Bank of America
Goldman Sachs, Morgan Stanley — investment banking and financial services
Visa and Mastercard — these are sometimes considered borderline, but they facilitate interest-bearing transactions at scale
Conventional banking is categorically excluded under Islamic finance because the entire business model is built on charging interest — Riba. Owning an index that includes a 12-15% allocation to conventional banks means owning a fundamentally non-compliant portfolio, regardless of how strong the tech component is.
Problem 2 — Other Prohibited Sectors
Beyond financials, the S&P 500 also includes allocations to:
Alcohol companies — companies with significant alcohol revenue within consumer staples and other sectors
What About the Fact That Tech Makes Up 30%+ of VOO?
This is the most common argument we hear: ‘But VOO is mostly tech now — Apple, Microsoft, Nvidia, Amazon make up over 30% of it. Doesn’t that make it mostly okay?’
The answer is no, and here is why. Owning a fund that is 30% halal tech and 70% uninvestigated (with 15% in clearly haram financials) is not the same as owning a halal fund. The fund holds the haram companies just as definitively as it holds the halal ones.
Think of it this way: if you bought a basket of mixed fruit that included some rotten pieces, you would not eat the whole basket just because most pieces were fresh. You would either remove the rotten pieces — which is exactly what a halal ETF does — or buy a basket that only contained fresh fruit.
A halal ETF removes the prohibited companies and gives you only the compliant ones. VOO does not do this.
The Halal Alternative to VOO
The good news is that there is now a direct halal equivalent to VOO. In fact, there are several.
Ticker
Fund Name
vs VOO
MER
Notes
SPUS
SP Funds S&P 500 Sharia ETF
Closest equivalent
0.49%
Screens S&P 500 for Sharia — best substitute
HLAL
Wahed FTSE USA Shariah ETF
Very similar
0.50%
U.S. large & mid-cap, FTSE methodology
ISUS
iShares MSCI USA Islamic ETF
Similar scope
0.50%
BlackRock’s Islamic U.S. equity ETF
SPRE.TO
SP Funds S&P 500 Sharia (CAD)
For Canadians
~0.49%
Same as SPUS but trades in CAD on TSX
SPUS — The Most Direct VOO Substitute
SPUS is managed by SP Funds and applies AAOIFI Sharia screening to the S&P 500 universe. It removes the prohibited companies — primarily financial stocks, defense contractors, alcohol, and tobacco — and holds the remaining compliant companies.
The result is a portfolio that looks quite similar to VOO’s top holdings, but without the haram exposure. Apple, Microsoft, Nvidia, Amazon, Alphabet, and Meta remain prominent holdings (subject to their passing Sharia screening at each quarterly review). The financials are removed.
The cost is slightly higher than VOO — 0.49% versus VOO’s 0.03% — but this is a necessary price for the screening infrastructure. And compared to most actively managed funds, 0.49% is still very low.
SPUS has grown to over $2 billion in assets under management, making it the largest halal ETF listed on U.S. exchanges. It is available at Fidelity, Charles Schwab, Robinhood, and most other U.S. brokers.
What About VTI — Vanguard Total Stock Market ETF?
Some investors ask about VTI — Vanguard’s Total Stock Market ETF, which holds virtually every publicly traded U.S. company (around 3,700 stocks). If VOO is not halal, VTI is even further from compliance. It holds every financial company, every weapons manufacturer, every tobacco and alcohol company in the U.S. market with no filtering whatsoever.
VTI has the same fundamental problem as VOO, amplified. More companies means more prohibited holdings, not fewer. The answer is the same: not halal, replace with a Sharia-screened equivalent.
Canadian Investors — A Special Note on VOO
Canadian investors sometimes hold VOO directly through their RRSP or TFSA at Questrade or Wealthsimple. Beyond the Sharia compliance issue, there are also practical reasons why a Canadian-listed equivalent may be preferable.
SPRE.TO — the Canadian-listed version of the SPUS strategy — trades in CAD on the Toronto Stock Exchange. It eliminates the need for currency conversion, which can cost 1.5-2% at most bank brokerages if not using Norbert’s Gambit. It also functions cleanly inside a TFSA without the U.S. dividend withholding tax applying in the same way.
For Canadian Muslim investors who were holding or considering VOO: SPRE.TO in your TFSA, or SPUS in your RRSP (to benefit from the Canada-U.S. tax treaty waiving the withholding tax), are the recommended replacements.
What About Performance? Is SPUS Competitive With VOO?
This is a fair and important question. The honest answer is that SPUS has underperformed VOO in some periods and outperformed it in others. The difference in long-term compound returns has been small.
The reason performance tracks closely is that the financial sector — the main thing being removed — is not the primary driver of S&P 500 returns over most long-term periods. Technology has been the dominant driver, and halal indices are effectively overweight technology relative to conventional indices. In technology bull markets, halal ETFs often outperform. In periods when financials do well, they may lag slightly.
What matters for Muslim investors is not that SPUS perfectly matches VOO — it is that SPUS gives you competitive exposure to U.S. equities without compromising your principles. The expected long-term return difference is small. The principle difference is significant.
Final Verdict
Is VOO Halal? — The Bottom Line VOO is NOT halal. It holds a significant allocation to conventional banks, insurance companies, weapons manufacturers, and other prohibited sectors that cannot be corrected through purification. The direct halal substitute is SPUS (in USD) or SPRE.TO (in CAD for Canadian investors). Both apply AAOIFI Sharia screening to the S&P 500 universe and are available at major brokers. The performance difference relative to VOO has historically been small. The principled difference is significant — and it is entirely possible to build a competitive long-term portfolio without VOO.
To check the current Sharia compliance status of any ETF or individual stock, use our Free Halal ETF & Stock Screener at halaletfhub.com/screener — updated regularly for both Canadian and U.S. investors.
If you are looking to invest in the US stock market while staying aligned with Islamic finance principles, you have likely come across SPUS. It is one of the most popular halal ETFs available today, often seen as the go-to option for Sharia-compliant exposure to large US companies.
But is SPUS truly a strong long-term investment, or is it simply a filtered version of the S&P 500 with limitations investors often overlook? In this complete review, we will break down how SPUS works, what it holds, its performance, risks, and whether it deserves a place in your halal portfolio.
What is SPUS ETF?
SPUS, officially known as the SP Funds S&P 500 Sharia Industry Exclusions ETF, is a US-listed ETF designed to provide exposure to large-cap American companies while following Sharia-compliant investment principles.
In simple terms, SPUS tracks a modified version of the S&P 500 but removes companies that do not meet Islamic finance guidelines.
This includes:
Conventional banks and financial institutions
Companies with high levels of debt
Businesses involved in prohibited industries such as alcohol, gambling, or tobacco
The result is a portfolio that focuses heavily on growth-oriented companies, particularly in sectors like technology.
For halal investors, this offers a structured and accessible way to participate in the US equity market without compromising their values.
How SPUS Stays Sharia-Compliant
SPUS follows a multi-step screening process to ensure compliance with Islamic finance principles.
1. Industry Screening
The first step removes companies involved in non-compliant activities such as:
Interest-based financial services
Alcohol and tobacco
Gambling
Adult entertainment
This immediately eliminates a significant portion of the traditional market, especially the financial sector.
2. Financial Ratio Screening
The second step focuses on financial health. SPUS excludes companies that:
Have excessive debt levels
Generate significant income from interest
This is critical because Islamic investing avoids businesses that rely heavily on interest-based financing.
3. Purification Process
Even after screening, some companies may still earn a small portion of non-compliant income.
To address this, SPUS applies a purification process where a small percentage of income is identified. Investors are expected to donate this portion to maintain full compliance.
What Does SPUS Hold?
One of the most important aspects of any ETF is its underlying holdings.
Because SPUS excludes financials and other sectors, its portfolio looks quite different from the traditional S&P 500.
Top Holdings
SPUS is heavily concentrated in large technology and growth companies, including:
Apple
Microsoft
Nvidia
Amazon
Meta
Alphabet
These companies tend to have strong balance sheets and lower reliance on debt compared to traditional financial institutions.
Sector Allocation
The ETF has:
High exposure to technology
Reduced exposure to financials
Limited diversification across certain sectors
This creates a unique profile compared to traditional index ETFs.
Performance Overview
SPUS has delivered strong performance over recent years and has even outperformed the S&P 500 during certain periods.
The main reason is sector exposure. Because SPUS is heavily weighted toward technology and growth stocks, it has benefited from the strong performance of these sectors. Companies like Nvidia and Microsoft have been major drivers of returns, boosting overall performance.
Important Reality
However, this outperformance is not guaranteed.
If technology stocks underperform
If financial sectors outperform
SPUS may lag behind the broader market.
Fees and Expense Ratio
SPUS has an expense ratio of approximately 0.49 percent.
This is significantly higher than traditional S&P 500 ETFs, which often have fees below 0.10 percent.
Why Higher Fees?
The additional cost comes from:
Sharia screening processes
Ongoing compliance monitoring
Portfolio adjustments
Should You Be Concerned?
While fees do impact long-term returns, many investors accept higher costs in exchange for investing in a way that aligns with their values.
The key is understanding what you are paying for.
Key Advantages of SPUS
1. Halal Compliance
SPUS provides a straightforward way to invest in the stock market while respecting Islamic principles.
2. Access to US Market Growth
You gain exposure to some of the largest and most innovative companies in the world.
3. Simplicity
Instead of selecting individual halal stocks, SPUS offers a ready-made solution.
4. Strong Growth Potential
The ETF is positioned toward sectors that have historically delivered strong long-term returns.
SPUS vs S&P 500
Understanding the difference between SPUS and the traditional S&P 500 is essential.
S&P 500
Fully diversified
Includes all sectors
Strong exposure to financials
SPUS
Sharia-compliant filtering
Excludes financial sector
More concentrated portfolio
Key Trade-Off
The real difference is not performance versus underperformance.
It is: 👉 Growth exposure versus diversification
Risks to Consider
Like any investment, SPUS comes with risks.
1. Market Risk
SPUS is still an equity ETF. Its value can fluctuate with market conditions.
2. Sector Concentration
Heavy exposure to technology means:
Higher upside potential
Higher downside risk
3. Reduced Diversification
Excluding financials limits diversification compared to traditional ETFs.
4. Sharia Constraints
Because the investable universe is smaller, SPUS may miss opportunities available in the broader market.
Who Should Invest in SPUS?
SPUS is best suited for:
✔ Halal investors
Those who want to invest while following Islamic principles.
✔ Long-term investors
Investors focused on growth over time.
✔ Passive investors
Those who prefer a simple ETF instead of selecting individual stocks.
Who Should Avoid SPUS?
SPUS may not be ideal for:
Investors seeking maximum diversification
Investors focused on low fees
Those uncomfortable with sector concentration
Final Verdict: Is SPUS Worth It?
SPUS is one of the most accessible and well-structured halal ETFs available today.
It offers a powerful combination of:
Market exposure
Simplicity
Sharia compliance
However, it is not a perfect replacement for the S&P 500.
The Reality
SPUS is not about outperforming every index.
It is about:
👉 Investing with conviction 👉 Aligning your portfolio with your values
Video
🧠 Final Insight
For many investors, the best approach is not choosing between SPUS and other ETFs.
It is building a balanced halal portfolio that includes:
This content is for educational purposes only and does not constitute financial advice. Always conduct your own research before making investment decisions.
Canadian investors are increasingly interested in dividend stocks. And it makes sense: they offer a powerful double advantage:
Regular income in the form of dividends
Long-term capital growth potential
But not all dividends are created equal. Some companies have a high dividend… only because their stock price has fallen sharply. This is called a “dividend trap” : attractive yield, but dividend at risk of cut-off. That’s why, for 2026, the strategy we’re putting forward is simple:
👉 Prioritizing “quality” over “high yield”
This article focuses on:
financially strong companies
Sustainable and growing dividends
Robust balance sheets
High cash flow generation
In short: companies that are not only able to pay today… but also to continue to increase their dividends tomorrow.
Video
Why focus on “quality” in 2026?
The current economic environment is characterized by:
Interest rates still high
moderate economic growth
Geopolitical risks
Markets that are sometimes very volatile
In this context, high-quality companies offer three major advantages.
1. Protection contre les “yield traps”
Some companies advertise returns of 8%, 9%, 10% or more. This sounds very attractive to an investor looking for income, but such a level of return often hides a less positive reality. In many cases, this high yield is mainly due to a sharp drop in the share price. Since the return is calculated according to the price, when the stock falls, the percentage rises mechanically. It is therefore not necessarily a “good deal”, but sometimes a warning signal.
These companies often combine fragile profits with high debt. When profits fall or interest rates rise, it becomes difficult to maintain a high dividend. The consequence is known:
❌ Fall in the share price❌, reduction or cut of the dividend, lasting❌ loss for the investor
In their case, the dividend is sustainable and becomes a real tool for long-term wealth creation, rather than a hidden risk. The conclusion is clear: a reasonable and reliable dividend is better than an exceptionally high yield built on shaky foundations.
2. Stability of payments
Investors are increasingly looking for:
Predictability
Regular income
Low dividend volatility
Quality companies tend to:
✔ Weathering recessions ✔ Adjusting capital intelligently ✔ Maintaining dividends even in difficult times
3. Capital Growth Potential
Dividends represent only a portion of the total return on a stock market investment. The other essential component is the appreciation of the stock price over time. A quality investment is therefore not limited to receiving regular payments: it must also allow the value of the security to increase sustainably.
Strong companies often share several characteristics: they innovate, develop new products, improve efficiency, and defend strong competitive positions. They generate significant and recurring cash flows, which allows them to finance their growth, reduce their debt and remunerate shareholders. They intelligently reinvest their profits: modernization, expansion, targeted acquisitions, or share buybacks.
These companies thus offer a double efficiency engine :
For the patient investor, this combination is powerful. The dividend provides regular income, while the increase in the share price helps build wealth. This is why focusing only on the dividend rate can be misleading: it is better to favor companies that can grow their earnings, dividends and stock market value over time.
How we selected the titles: the “high quality” factor
Our criteria are based on the “Quality” factor studied by Fidelity and other institutional managers. It is based on four concrete financial pillars.
✔ 1. Strong balance sheets
We give priority to companies:
Well capitalized
with cash
Shock-absorbing
A strong balance sheet means:
👉 Ability to maintain the dividend even during a crisis
We favour companies with strong balance sheets, well capitalised and sufficient liquidity to weather difficult times. Such a financial profile offers significant room for manoeuvre in the event of a recession, a rise in interest rates or a sector shock. These companies can continue to invest, repay their debts and maintain their dividends without having to resort to emergency financing. In concrete terms, a strong balance sheet means the ability to absorb crises without massive shareholder dilution or abrupt cuts in payouts. For a dividend investor, this is a central criterion: it increases income security and sustainability.
✔ 2. Predictable cash flows
The selected companies show:
Recurring cash flows
from core or dominant activities
Examples:
Infrastructure energy
Big banks
Mining royalties
The successful companies generate stable and recurring cash flows, often from core or dominant activities in the economy. This type of cash flow makes it possible to simultaneously finance dividends, investments and debt reduction. It is frequently found in sectors such as energy infrastructure, large banks, telecommunications or mining royalties. The predictability of receipts greatly reduces the risk of dividend cuts. It also allows managers to gradually increase payments over time. For the long-term investor, this visibility is a major asset, as it promotes steady, growing and sustainable returns.
✔ 3. High profitability
We looked for companies that could:
Generate high margins
Turning revenue → profit
Financing Growth + Dividends
We look for companies that can effectively convert their revenues into net profits. High profitability translates into strong margins, disciplined cost management and the ability to maintain their prices even in challenging economic environments. These companies can finance their organic growth, make strategic acquisitions and continue to remunerate their shareholders through higher dividends. Sustainable profitability is also a sign of competitive advantage: a strong brand, a dominant network, unique assets or differentiated technology. For the investor, this means a greater likelihood of long-term value creation, beyond just the current return.
✔ 4. Debt under control
Low debt allows:
Greater strategic flexibility
resistance to rising rates
Controlled debt allows companies to remain flexible when economic conditions deteriorate or interest rates rise. Interest costs that are too high can eat into profits and threaten the dividend. Conversely, reasonable debt allows you to invest, acquire and weather economic cycles without undue pressure. Firms with low debt are less vulnerable to banks, markets, and costly refinancing. They can continue to pay their dividends even when the environment becomes more difficult. For an income-oriented portfolio, financial discipline is therefore a key factor in stability and resilience.
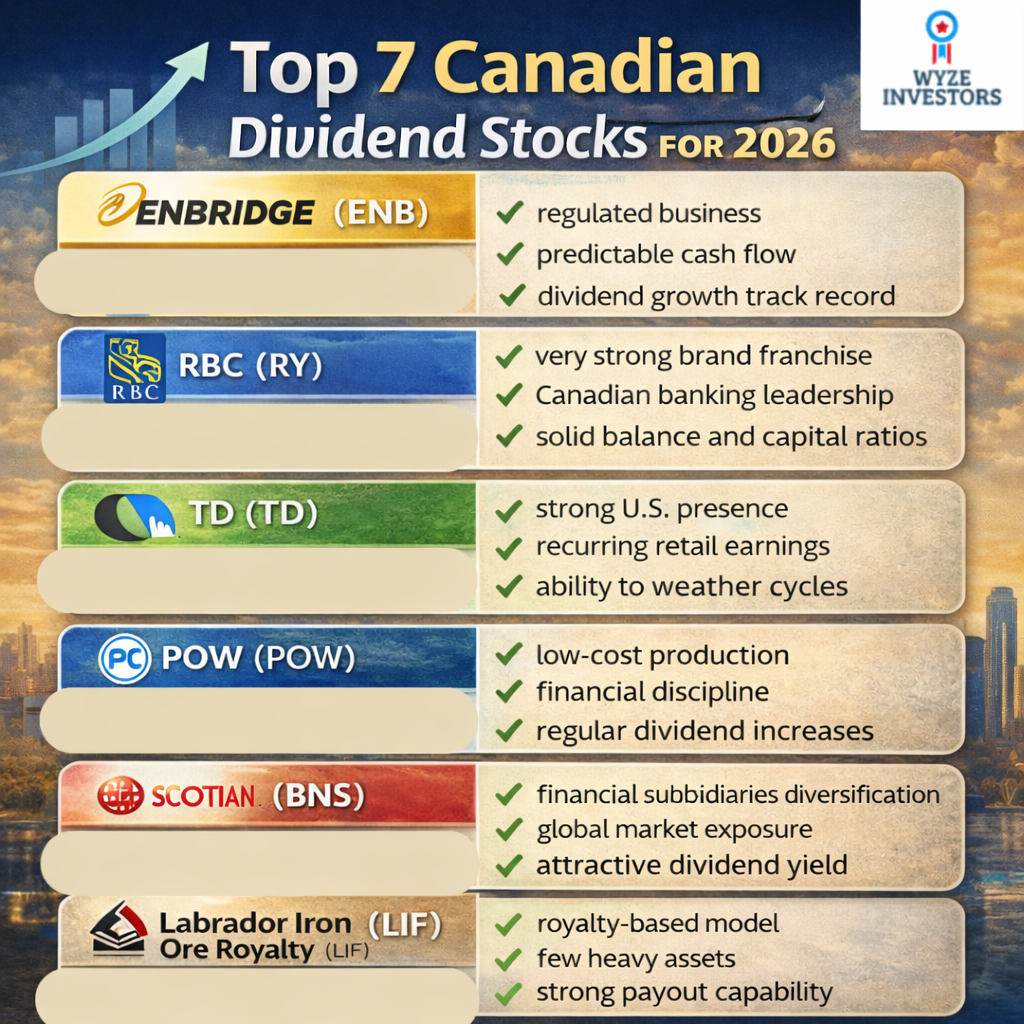
The 7 Best Canadian Dividend Stocks for 2026
1. Enbridge (ENB) — The Energy Infrastructure Pillar
Enbridge is one of Canada’s most popular companies among dividend investors. It operates an extensive network of:
pipelines
Gas infrastructure
Energy utilities
Why does it stand out?
✔ Dividend announced to increase towards 2026 ✔ More than 30 consecutive years of relatively ✔ predictable increase in cash flow distributed
The dividend is based on distributable cash flow (DCF), estimated between:
👉 $5.70 and $6.10 per share for 2026 (guidance)
Investment thesis
regulated activity
Structural energy demand
Long-term infrastructure projects
Enbridge operates in a largely regulated business, making its revenue streams more predictable than those of many energy companies. It benefits from a structural energy demand, linked to the transport of oil and gas necessary for the functioning of the North American economy. Its long-term infrastructure projects provide high visibility into future cash flows through often multi-year contracts. For these reasons, Enbridge is particularly appealing to investors who are looking for stability, resilience and a gradual increase in dividend over time, rather than rapid but uncertain growth.
2. Royal Bank of Canada (RY) — The Canadian Banking Reference
RBC is the country’s largest bank by market capitalization.
It benefits from:
of a dominant national network
an international presence
an image of solidity
Why is RY a “quality” stock?
✔ Uninterrupted dividends for more than 150 years ✔ High profitability ✔ Income diversification (retail banking, insurance, capital markets)
Its yield is not the highest in the industry, but:
👉 It is among the most reliable
Investment thesis
• Strong brand franchise
• Essential positioning
• Balance sheet strength
Royal Bank of Canada has an extremely strong brand franchise, built on more than a century of history and a dominant presence in the country. Its key positioning in personal, commercial and wealth management banking provides it with diversified and resilient revenue streams. The bank also stands out for the strength of its balance sheet, with high capital ratios and prudent risk management. RY is particularly suitable for long-term investors who are looking for security, consistency and regularity of the dividend, rather than speculative bets on more volatile securities.
3. Toronto-Dominion Bank (TD) — North American Growth
TD combine :
Strong Canadian platform
huge presence in the United States
It is one of the banks most exposed to the US market.
Key Points
✔ Yield around 4% ✔ Valuation has become attractive again after recent ✔ challenges Business model focused on retail banking
Investment thesis
future growth related to the United States
Recurring retail profits
Ability to Navigate Economic Cycles
The Toronto-Dominion Bank has significant growth leverage with its strong presence in the U.S., where it continues to expand its retail business. Its recurring profits from retail banking provide a stable revenue base that is less dependent on short-term capital markets. TD has repeatedly demonstrated its ability to navigate economic cycles, maintaining prudent risk management and disciplined capital policy. This stock is particularly suitable for investors looking for both a regular dividend and the potential for a medium-term recovery when economic conditions improve.
Build a reliable monthly income from your portfolio
I’ve created ready-to-use ETF portfolios and a passive income calculator designed specifically for Canadian investors.
4. Canadian Natural Resources (CNQ) — La machine à cash-flow
CNQ is one of the most profitable energy companies in the country.
Why does CNQ attract?
✔ Yield around 5% ✔ 23 consecutive years of dividend ✔ increase Low operating costs
CNQ is recognized for its financial discipline:
Deleveraging
Share buybacks
distributions progressives
Investment thesis
High correlation to the price of oil
Low-cost production
Shareholder-oriented management
Canadian Natural Resources (CNQ) remains highly correlated with the price of oil, which can lead to sharp swings in the stock in the short term. However, the company stands out for its very low-cost production, which allows it to remain profitable even when energy prices fall. Its management adopts a clear management approach to shareholders, combining debt reduction, share buybacks and regular dividend increases. This makes CNQ a flagship stock for investors who accept volatility in exchange for growing dividends and long-term value creation potential.
5. Power Corporation of Canada (POW) — The Heritage Conglomerate
Power Corp owns:
Great-West Lifeco
IGM Financial
Wealthsimple (partial)
Why is POW interesting?
✔ Returns often higher than banks ✔ Global exposure to asset ✔ management Diversified holding structure
Investment thesis
Profits linked to the global financial markets
Growth through acquisitions and subsidiaries
Profits redistributed via dividends
Power Corporation (POW) derives a large portion of its profits from global capital markets through its significant holdings in wealth management and insurance. Its model is based on growth through acquisitions and the development of its subsidiaries, which allows it to diversify its revenue sources and smooth out economic cycles. A significant portion of profits is returned to shareholders in the form of dividends, supported by strong cash flows. POW is therefore particularly attractive to investors who are looking for high returns, geographic and sector diversification, and a long-term stability approach.
6. Bank of Nova Scotia (BNS) — Highest Yield of the Big Banks
Historically, BNS has offered the most generous bank dividend among Canada’s major banks.
Why does SNB attract despite the challenges?
✔ high ✔ performance international presence (especially Latin America) ✔ strategic recovery plan underway
Points of vigilance
Exposure to emerging markets
Restructuring still in place
The Bank of Nova Scotia (NBS) is unique in its strong exposure to emerging markets, particularly in Latin America, which provides it with superior long-term growth opportunities, but with more volatility. The bank is also engaged in a strategic restructuring that is still being rolled out, aimed at improving its profitability, strengthening its risk management and refocusing its activities on its most profitable markets. On the other hand, this adjustment phase can create short-term stock market fluctuations. SNB is therefore mainly aimed at investors who accept a little more risk in exchange for a generally above-average dividend yield.
7. Labrador Iron Ore Royalty (LIF) — Les redevances minières
Unlike traditional mining producers, LIF generates revenue through a royalty model.
It benefits from iron ore sales without directly assuming the costs of operating a mine.
What makes LIF unique?
✔ High ✔ margins, commodity-price-sensitive dividend, ✔ low operating debt
Investment thesis
correlated with iron ore price
Few heavy assets to manage
Good redistributive capacity
Labrador Iron Ore Royalty (LIF) is highly correlated with the price of iron ore, which means that its revenue and distributions can fluctuate with commodity cycles. Its business model is unique: the company holds royalties and therefore few heavy assets to manage, which limits operating costs and operational risks. Thanks to this lean structure, LIF often has a good redistribution capacity in the form of variable dividends. This stock may be attractive to investors looking to add sector diversification related to natural resources, while benefiting from attractive income potential.
Comparison
Stock
Yield
Strength
Risk Level
ENB
~7%
Stable cash flow
Medium
RY
~4%
Strong balance sheet
Low
TD
~4%
US growth
Medium
CNQ
~5%
Cash machine
Cycle risk
POW
~5%
Diversified
Medium
BNS
~6%
High yield
Higher risk
LIF
Variable
Royalty model
High
Conclusion — Dividends yes… but with quality
For 2026, the most reasonable strategy is to focus on strength rather than the search for maximum return at all costs. The aim is to select companies that can maintain and increase their dividends over time, even in times of economic volatility. This means focusing on companies with strong balance sheets, stable cash flows and controlled debt. Conversely, it is prudent to avoid “high-yield traps” – securities that offer very attractive rates but are based on fragile or over-leveraged models.
The seven companies selected—Enbridge, RBC, TD, Canadian Natural Resources, Power Corporation, The Bank of Nova Scotia and Labrador Iron Ore Royalty—embody this central idea: financial quality remains a long-term investor’s best ally. They combine a strong competitive position, the ability to generate cash flow and discipline in the distribution of dividends. This approach does not promise quick wealth, but it does prioritize income sustainability and incremental capital growth. In 2026 and beyond, building wealth is above all about patience, diversification and the rigorous selection of solid companies.
Educational clause
This article is intended to be informative and educational. It does not constitute a recommendation to buy or sell. Each investor should evaluate:
their risk tolerance
its investment horizon
their personal situation
and consult a professional if necessary.
The Hamilton Enhanced U.S. Covered Call ETF (HYLD) is attracting a lot of investors in Canada, particularly for its high monthly return. But behind the impressive casts is a question that many are asking:
👉 Does HYLD really pay dividends… or is it mainly a return of capital (ROC)?
In this comprehensive analysis, based on your Q&A, we clarify how distributions actually work, the difference between price and total return, and why ROC is not a danger sign — contrary to what many believe.
🟨 1. HYLD: A high-income ETF
HYLD is designed to offer a monthly cash flow through a combination of:
🎯 Target: ~12% return per yearHYLD explicitly targets high income, not unit price growth.
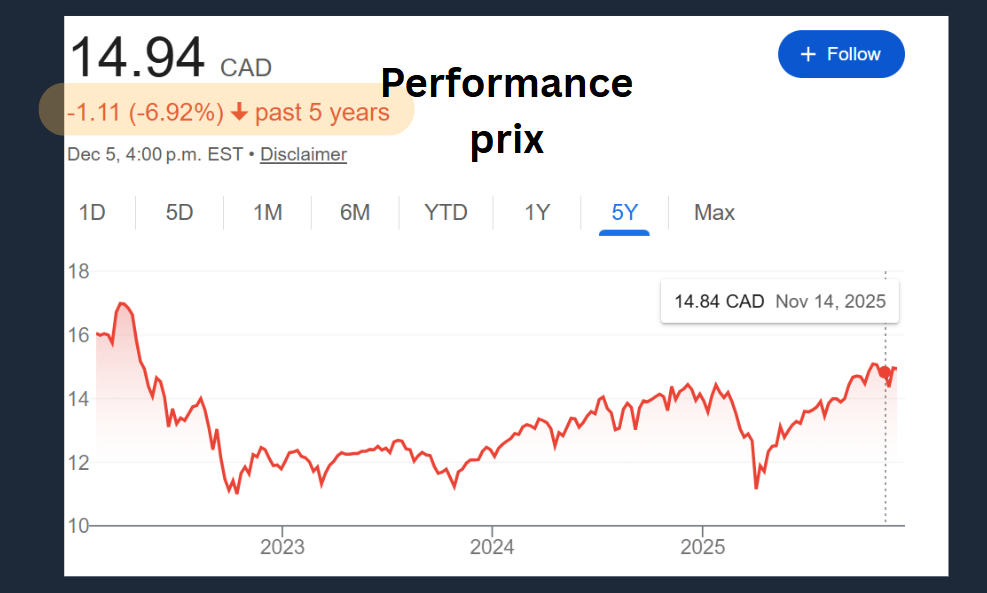
🟦 2. Price performance: an incomplete indicator
Many investors judge HYLD based solely on price. For example, over 5 years, the graph shows a relatively stable or even slightly declining performance.
But here’s the problem:
👉 The price does NOT reflect the actual performance of an income-oriented ETF.
This is because HYLD redistributes a large portion of the earnings in the form of monthly distributions, resulting that:
The net asset value rises less
But the total cash flow generated is very high
Looking only at the price is therefore ignoring 80–90% of the real return.
🟧 3. Total Return = Price + Dividends
To understand HYLD, you have to think in terms of total return.
📌 Formula:
Price Performance + Dividends = Total Return
The table shown in the video shows higher total return returns:
1 year: +25.9%
3-year annualized: +23%
Since 2022: +11.5%/year
YTD: +21.9%
➡️ Very solid figures, despite a price that is not exploding.
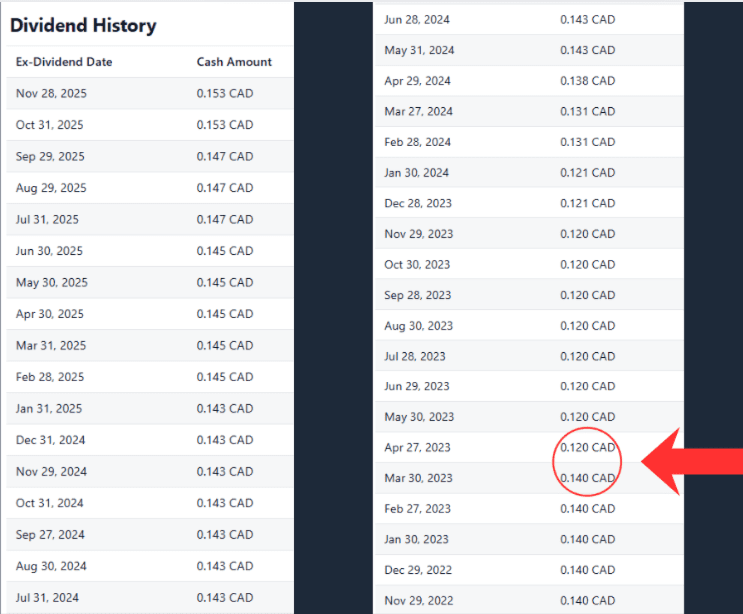
🟩 4. Distribution history: what the numbers tell us
By analyzing the distribution history, we notice:
Stable monthly payments
sometimes a drop in distribution during difficult market periods
the introduction of ROC as a major component in some years
A clear example: 📉 In 2022, the bear market forced HYLD to reduce its distributions (visible in April).
This shows that distributions are not guaranteed. They depend on option premiums and the health of the US market.
🟥 Article 5. Return of Capital (ROC): danger or simple tax classification?
Among the elements that most resonate with investors: 👉 Why does HYLD distribute so much ROC?
Here is the essential clarification:
ROC does NOT mean that the fund gives you back your own money.
This is NOT a sign that the fund is in trouble.
This is often the consequence of hedged options strategies.
When the gains generated by the options offset the decline in the underlying assets, there may be no taxable net gain. As a result, the distribution is classified as an ROC.
🟩 Significant tax effect:
ROC reduces the adjusted cost base (ACB), which can defer tax later.
So that’s not a bad thing — it’s an accounting reality linked to the fund’s strategy.
🟫 6. Simple example: GOOGL to understand the ROC
In the video, a clear example with GOOGL illustrates the phenomenon:
The manager sells covered options.
It generates bonuses every month.
But if the stock falls during the year… → the options offset the loss→ there is no taxable gain
Distributions cannot be reported as dividends or capital gains
They therefore become Return of Capital
🎯 ROC = a tax adjustment, not a hidden risk.
🟦 7. Why HYLD Needs to Be Evaluated Differently
HYLD is not a growth ETF. It should not be evaluated as VFV or VOO.
Here’s what really matters:
stable distributions
Ability to generate bonuses
Total Yield
Adequacy with the income profile
The main conclusion:
👉 HYLD actually generates income through options. The ROC simply reflects how these revenues are classified.
HYLD is not a growth ETF and therefore should not be evaluated as VFV or VOO. Its main objective is to provide a high income, which involves using different criteria to measure its performance. What really matters is the stability of distributions, the fund’s ability to generate premiums, total return and its suitability for an income-oriented profile. In practice, HYLD does generate income through its hedged options strategies. The ROC is only a tax classification of these distributions, and not a sign of fragility.
🟨 8. Key points to remember
HYLD is designed for high income, not growth.
The ROC is not a sign of danger, but a fiscal reality.
Distributions vary by market.
The total return is much higher than the price suggests.
HYLD is suitable for income-oriented investors, not extreme growth hunters.
Hedged options limit upside potential, but stabilize revenues.
HYLD is primarily an ETF designed to generate high income, not to offer strong capital growth. This orientation explains why its price may seem stable or not very dynamic, while its total return, including monthly distributions, is actually much higher than what an investor who only sees the price chart. A point that is often misunderstood concerns the Return of Capital (ROC): far from being a sign of weakness, it reflects above all a tax reality resulting from the hedged option strategies used by the fund. Distributions can also vary over the course of the market, as they depend on the premiums generated and broader economic conditions. HYLD is therefore primarily suitable for investors focused on income and cash flow stability, rather than those looking for aggressive growth comparable to a traditional index ETF. Finally, it should be understood that the hedged options used in the fund’s strategy naturally limit the potential for appreciation in times of strong bullish rally, but they also help to stabilise income, making HYLD an attractive tool for a sustainable income strategy.
🟩 Conclusion
In conclusion, HYLD is a powerful ETF for investors looking for:
high monthly income
A simple solution to generate cash flow
A diversified and option-optimised strategy
An attractive total return despite a stable price
Return on Capital is an integral part of the operation of this type of fund and should be understood as a tax concept, not as an alarm.
➡️ HYLD can be a great component of an income portfolio, as long as you understand how it generates its distributions and what trade-offs this strategy entails.
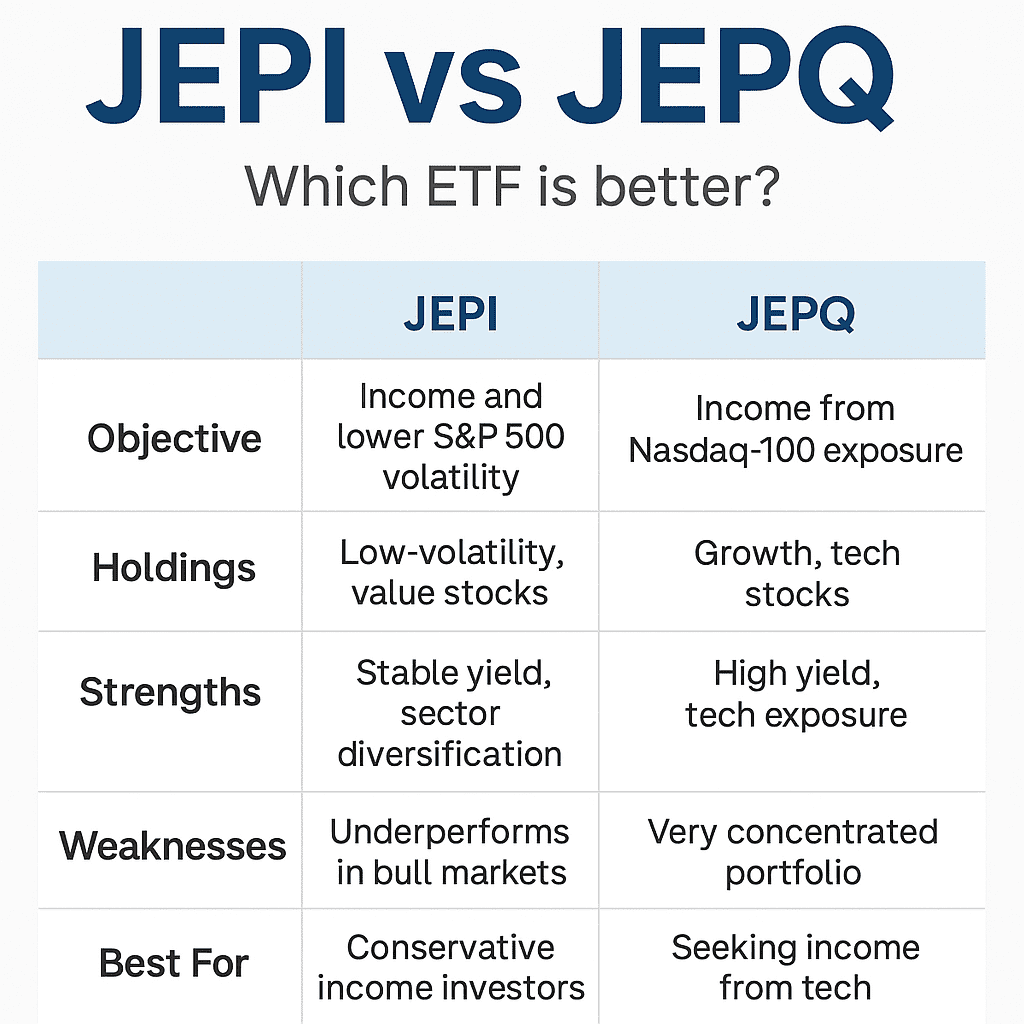
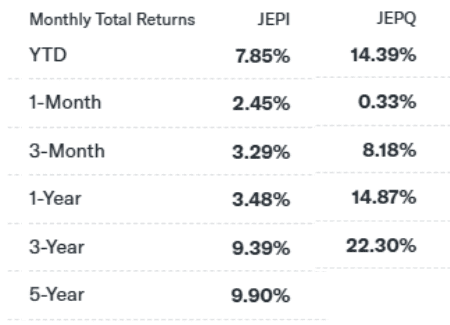
Executive summary
JEPI and JEPQ are two leading income-focused ETFs using covered call strategies, but they serve different investors. JEPI offers stable income with broad diversification and lower volatility, while JEPQ provides higher yield driven by tech exposure. Understanding their objectives, risks, and market behavior helps identify which ETF fits your strategy best.
JEPI
Investment objective
The JPMorgan Equity Premium Income ETF (JEPI) is an income focused covered call ETF. It’s ideal for conservative investors who are seeking income and moderate growth. The manager of JEPI invests in a portfolio of stocks that combine 3 characteristics:
Part of the S&P 500, so in other word large cap stocks only;
Low volatility stocks, meaning, stocks that fluctuate far less than the market. This is generally the case of defensive stocks operating in stable industries. The main metric used by the fund manager of JEPI to assess volatility is the Beta. Beta is a coefficient risk, for instance a Beta of 0.5 would indicate that the stock exhibits 50% of the volatility of the stock market;
Value stocks: the analysts’ team of JEPI will conduct a fundamental bottom up approach to select only stocks that are considered undervalued.
Advantages
JEPI, an ETF focused on issuing call options, offers several advantages that might appeal to certain investors. Firstly, it boasts an attractive yield derived from the money earned through call option writing. Moreover, JEPI exhibits lower volatility compared to investing directly in an S&P 500 index ETF like SPY, making it a suitable option for conservative investors and income seekers.
Another positive aspect of JEPI is its ability to capitalize on high volatility, which often translates to increased premiums for the fund. Additionally, investors can save valuable time and effort by avoiding the need to personally write call options on the S&P 500, as JEPI handles this strategy on their behalf. Furthermore, with relatively low fees of 0.35% total expense ratio, JEPI presents a cost-effective investment choice. The ETF’s diversification across various sectors adds another layer of appeal, spreading risk across different industries.
However, JEPI does have some drawbacks that potential investors should consider. In bull markets, it is expected to underperform the S&P 500 index due to the call option writing strategy, which reduces volatility but also limits its performance during bullish periods.
Recap
Positives
Attractive yield thanks to money earned issuing call options;
Lower volatility than investing in a S&P500 index ETF such as SPY;
Suits conservative investors and income seekers;
High volatility usually increases the premiums earned by the fund;
Saves you time and effort (if you were yourself interested on writing call options on the S&P 500);
Relatively low fees (0.35% total expense ratio);
Diversification: JEPI is highly diversified across various sectors.
Negatives
In bull market, investors should expect a lower performance than the S&P 500 index. Issuing call options reduces volatility at the expense of higher performance in bull markets;
JEPQ
Investment objective
JEPQ (JPMorgan Nasdaq Equity Premium Income ETF) is a high distribution yield ETF. It focuses on providing investors with a monthly income stream using covered call strategies. These strategies enhance yield by collecting premiums on call options. JEPQ invests in large cap Teck stocks that are part of the NASDAQ. Using a proprietary selection criteria, the manager would select companies with the highest prospects for growth seeking the highest adjusted return possible (low volatility combined with high returns).
Advantages
JEPQ ETF, focused on writing call options on the NASDAQ 100, offers similar benefits to JEPI. It provides an attractive yield from call option writing and boasts lower volatility compared to a NASDAQ 100 ETF like QQQ, appealing to conservative investors and income seekers.
However, JEPQ has some significant negatives that investors need to be aware of. It tends to perform poorly during bullish market conditions, as the covered call strategy curtails the upside potential of the NASDAQ 100.
Furthermore, JEPQ’s lack of diversification is a notable concern, with a heavy concentration in tech firms dominating the fund. This lack of diversification exposes investors to higher risks compared to a more balanced investment approach.
Recap
Positives
Attractive yield thanks to money earned issuing call options;
Lower volatility than investing in a NASDAQ 100 ETF such as QQQ;
Suits conservative investors and income seekers;
High volatility usually increases the premiums earned by the fund;
Saves you time and effort (if you were yourself interested on writing call options in the NASDAQ 100;
Relatively low fees (0.35% total expense ratio).
Negatives
Poor performance (compared to the index in bull markets). You are essentially giving up on the upside potentiel of the NASDAQ 100;
The strategy of covered calls becomes ineffective in an unpredictable market;
JEPQ is dominated by Tech firms so it’s far from being a diversified investment;
Yahoo finance as of December 10th
Conclusion
Ultimately, whether JEPI or JEPQ is a good investment depends on individual investor preferences, risk tolerance, and market outlook. JEPI’s lower volatility and diversification across sectors could be attractive to those seeking stability and income, while JEPQ’s focus on the NASDAQ 100 may appeal to tech-focused investors. It is crucial for investors to conduct thorough research, consider their financial goals, and consult with a financial advisor to make informed investment decisions.
Dividend investing is one of the most popular strategies in personal finance. The idea is simple: own shares in profitable companies, and those companies pay you a portion of their earnings on a regular basis — monthly, quarterly, or annually. You build wealth and generate income simultaneously.
For Muslim investors, the question is whether this strategy is compatible with Islamic finance principles. The answer, as with most things in halal investing, depends on the details.
The short answer: yes, dividend investing can be halal — but not all dividends are created equal. The permissibility depends on what company is paying the dividend, how that company earns its money, and whether the dividend itself represents a share of real business profits.
What Is a Dividend — And Why It Matters for Halal Investing
A dividend is a distribution of a company’s profits to its shareholders. When a company earns more money than it needs to reinvest in its business, it can return that surplus to the people who own shares.
From an Islamic finance perspective, this is fundamentally different from interest. Interest is a guaranteed, predetermined payment that has no connection to actual business performance. A dividend, by contrast, is a share of real profit — it goes up when the business does well, it can be cut or eliminated when the business struggles, and it reflects genuine economic activity.
This distinction — profit-sharing versus interest — is at the heart of why dividend investing can be permissible while bond investing is not.
Dividend vs Interest — The Core Distinction Dividend: Share of actual company profits. Variable. Tied to real business performance. → ✅ Principle is permissible Interest: Fixed, guaranteed payment regardless of business performance. → 🔴 Riba — not permissible The source of the payment matters. A dividend from a halal company is permissible. Interest from any source is not.
When Is a Dividend Halal?
A dividend is halal when all of the following conditions are met:
The company’s primary business is permissible — it does not derive its main revenue from alcohol, tobacco, gambling, conventional banking, weapons manufacturing, adult entertainment, or pork products
The company passes the financial screening tests — interest-bearing debt is below 33% of total assets, and prohibited revenue is below 5% of total revenue
The dividend represents a genuine share of business profits — not a disguised interest payment (as is sometimes the case with preferred shares)
If the company has minor prohibited revenue below the 5% threshold, the investor purifies the corresponding portion of the dividend by donating it to charity
If these conditions are met, collecting dividend income from that company is entirely permissible — and many scholars consider it one of the most clearly halal forms of investment income available.
When Is a Dividend NOT Halal?
There are several situations where a dividend, despite appearing to be a straightforward profit distribution, is not permissible.
Dividends from Haram Companies
The most obvious case: if the company paying the dividend operates primarily in a prohibited industry, the dividend is not halal regardless of how it is structured. A dividend from a conventional bank, a beer company, or a casino is not permissible — even though it is technically a share of profits.
The profits themselves were generated through haram means. You cannot purify the income by simply donating a portion of it. When the core business is impermissible, the entire investment is excluded.
Dividends from Conventional Preferred Shares
This is a gray area that many investors miss. Preferred shares look like dividend-paying investments, but most conventional preferred shares pay a fixed, predetermined dividend that functions essentially like interest. The payment does not vary with company performance. The rate is set in advance. This structure resembles riba more than genuine profit-sharing.
Most Islamic scholars classify conventional preferred shares as not permissible for this reason. The dividend label does not change the underlying economic reality.
Dividends from High-Debt Companies That Barely Pass the Threshold
A company with interest-bearing debt at 32% of total assets technically passes the AAOIFI screening threshold. But if that debt is a structural feature of the business model — rather than an incidental financing choice — some scholars recommend caution. In practice, use your screening app and verify annually.
The Best Halal Dividend Stocks for Canadian Investors
Some of the world’s strongest dividend-paying companies pass Sharia screening with relatively clean results. Here are categories and examples worth investigating (always verify with a current screening app before buying):
Company
Ticker
Sector
Sharia Status
Apple
AAPL
Technology
✅ Generally compliant — minor purification
Microsoft
MSFT
Technology
✅ Generally compliant — minor purification
Johnson & Johnson
JNJ
Healthcare
✅ Generally compliant — verify
Procter & Gamble
PG
Consumer Staples
✅ Generally compliant — verify
Shopify
SHOP.TO
Technology
✅ Generally compliant
CN Rail
CNR.TO
Industrials
⚠️ Generally compliant — monitor debt ratio
Royal Bank
RY.TO
Financials
🔴 Not halal — core business is banking
Enbridge
ENB.TO
Energy/Pipelines
⚠️ Check debt ratio — often near threshold
Notice that two of the most popular Canadian dividend stocks — Royal Bank and Enbridge — present problems. RBC is categorically excluded. Enbridge requires careful monitoring because pipeline companies often carry significant debt to finance their infrastructure.
Halal Dividend ETFs — The Easier Approach
Picking individual dividend stocks requires ongoing monitoring and annual re-verification. For most investors, a simpler approach is to use a halal dividend-focused ETF, which does the screening work for you.
While there are no ETFs in Canada specifically marketed as halal dividend ETFs, the major Sharia-compliant equity ETFs do pay dividends from their underlying holdings. WSHR.TO, SPUS, HLAL, and SPWO all distribute income from the dividends paid by their constituent companies.
The advantage of this approach is that you get immediate diversification across hundreds of halal-screened companies, you receive the aggregate dividend income automatically, and the fund manager handles the ongoing compliance monitoring.
Halal Dividend ETFs Available to Canadian Investors WSHR.TO — Wahed FTSE World Shariah ETF — global halal equity, pays quarterly distributions SPRE.TO — SP Funds S&P 500 Sharia ETF (CAD) — U.S. halal equity, distributions included SPUS — SP Funds S&P 500 Sharia ETF (USD) — publishes quarterly purification ratios HLAL — Wahed FTSE USA Shariah ETF (USD) — U.S. halal equity with distributions SP Funds publishes purification ratios quarterly — making it easy to calculate your annual purification amount.
What About High-Yield Dividend Strategies?
Canadian investors love high-yield dividend strategies. Canadian banks, pipelines, telecoms, and REITs are the backbone of many income portfolios — and they yield 4-6% or more. Hamilton ETFs, Global X (formerly Horizons), and CI Financial have built entire product lines around high-yield Canadian dividends.
Unfortunately, most of these high-yield strategies fail Sharia screening. Canadian banks — the single largest source of high dividend yield in Canada — are categorically excluded. Many pipeline companies carry too much debt. Telecoms like Bell and Telus require case-by-case verification.
This is the honest trade-off of halal dividend investing: your yield will likely be lower than a conventional Canadian dividend portfolio. A halal dividend approach might generate 2.5-3.5% annually compared to the 4-6% that conventional Canadian dividend investors target.
But this is not as large a practical difference as it appears. The halal portfolio grows its underlying value over time through capital appreciation, while a high-yield conventional portfolio often sees less capital growth. Over a 20-year horizon, the total wealth difference tends to be much smaller than the yield gap suggests.
Purification — The Final Step
Even when investing in halal dividend stocks or ETFs, most companies will have some minor exposure to prohibited activities — a tech company earning bank interest on its cash holdings, for example. Scholars require investors to purify this portion by donating it to charity.
The calculation is straightforward. If Apple’s prohibited income ratio is 0.8% and you received $300 in Apple dividends, you donate $2.40. If SPUS has a 1.4% purification ratio and you received $500 in distributions, you donate $7.00. Most halal investors find the annual purification amount is well under $50, even on substantial portfolios.
Purification Quick Reference Step 1: Find purification ratio for each holding (Zoya app or fund website) Step 2: Multiply total dividends received × purification ratio Step 3: Donate the result to any recognized charity Example: $2,000 total dividends at an average 1.2% ratio = $24 to donate per year
Final Verdict
Is Dividend Investing Halal? — The Bottom Line Yes — dividend investing is permissible in Islam when done correctly. The key conditions: the company must pass sector screening (no haram industries), pass financial screening (debt below 33%, prohibited revenue below 5%), and any minor prohibited income must be purified through charitable donation. Preferred shares and conventional bank dividends are not permissible regardless of the dividend label. For most investors, the simplest approach is a halal ETF (WSHR.TO or SPUS) which handles the screening automatically and publishes purification ratios.
Want to check whether a specific dividend stock is halal? Use our Free Halal ETF & Stock Screener at halaletfhub.com/screener for an instant Sharia compliance analysis.
— Rachid Fouadi, M.Sc., CPA · halaletfhub.com
Investment Objective
Hamilton introduced a new ETF called UMAX, which focuses on the utilities sector (UMAX was launched June 14th 2023). This ETF is designed to provide investors with attractive monthly income while offering exposure to a diversified portfolio of utility services equity securities primarily listed in Canada and the U.S. UMAX aims to reduce volatility and enhance dividend income by employing an active covered call strategy. This post is also available in Video format.
Unlike some other income ETFs, UMAX does not utilize leverage. However, it still aims to generate higher monthly income for investors. It offers exposure to blue-chip Canadian utilities, including pipelines, telecoms, and railways. By implementing the covered call strategy, UMAX seeks to enhance monthly income and reduce volatility. Currently, the coverage through covered calls is approximately 50%.
UMAX targets a yield of 13% or more, with monthly distributions to provide consistent income.
Investors can access UMAX, along with other Hamilton ETFs, on the Toronto Stock Exchange (TSX). These ETFs can be included in various portfolios, such as RRSP, RRIF, DPSP, RDSP, FHSA, RESP, and TFSA. Additionally, for investors interested in a Dividend Reinvestment Plan (DRIP), they can contact their individual brokerage for setup details.
Similar funds from Hamilton ETFs
In addition to UMAX, Hamilton offers other notable ETFs in their lineup, including HMAX Hamilton Canadian Financials Yield Maximizer and HYLD Hamilton Enhanced U.S. Covered Call ETF.
HMAX is designed to maximize yield within the Canadian financials sector. It aims to provide investors with attractive monthly income by investing in a diversified portfolio of Canadian financial companies. On the other hand, HYLD focuses on the U.S. market and utilizes a similar covered call strategy to generate income and reduce volatility. It seeks to provide enhanced yield potential by investing in a diversified portfolio of U.S. securities, primarily in the large-cap segment.
How UMAX is able to set such high dividend yield target?
According to the issuers’ website, UMAX is able to provide higher monthly income for two reasons:
UMAX writes covered call options on approximately 50% of the portfolio
The fund is currently writing option At The Money (ATM) wheras similar funds are writing options OTM (Out of The Money).
UMAX vs ZWU vs HUTE ETF
Strategy
UMAX: This ETF allocates 50% of its portfolio and uses at-the-money (ATM) options. It offers a dividend yield of approximately 13%* and does not employ leverage.
ZWU: Similar to UMAX, ZWU also allocates 50% of its portfolio, but it utilizes out-of-the-money (OTM) options. It has a dividend yield of approximately 8.6% and does not employ leverage.
HUTE: HUTE allocates 33% of its portfolio using OTM options and offers a dividend yield of 9.8%. It employs 25% leverage to amplify returns.
% potfolio
Option strategy
Divdend Yield approx
Leverage
UMAX
50%
ATM
13%*
No
ZWU
50%
OTM
8.6%
No
HUTE
33%
OTM
9.8%
25%
Covered call strategy
ATM vs OTM Options
I invite you to consult the table below to understand the difference. As you can see, the UMAX fund has chosen to issue ATM call options because they are more profitable than OTM options. First, the premium is higher than that generated by an OTM strategy. However, the risk of loss is also higher.
The risk for an option always corresponds to the probability that the buyer will exercise it. If the strike price is higher than the current price (OTM), the chances of the option being exercised are low. However, the probability of the option being exercised is more plausible for an ATM option where the strike price is very close or equal to the stock’s current price.
Table
Premium or option price
Risk
Reward
ITM (In the money call option) Stock price > Strike price
High
High
High
OTM (Out of the money call option) Stock price < Strike price
Typical expected result when writing a covered call option
Interest Rates and the Impact on Utilities and REITs
The performance of income-focused sectors like utilities and REITs is highly sensitive to changes in interest rates. Both sectors share similar characteristics: they generate stable, predictable cash flows and often distribute a large portion of earnings as dividends. When interest rates rise, however, the relative attractiveness of these yields declines, leading to downward pressure on prices.
The chart above illustrates this relationship clearly. It compares the Solactive Canada Utility Index (in blue) with the Bank of Canada 3-Month Treasury Bill rate (in orange) throughout 2024. As interest rates began to decline after peaking in mid-June, the utilities index rebounded sharply. This inverse correlation highlights a fundamental principle: when borrowing costs fall and bond yields decline, investors often rotate back into dividend-oriented sectors such as utilities and REITs, seeking higher income and potential capital gains.
Higher interest rates increase financing costs for these capital-intensive companies, reduce profitability, and compress valuations. Conversely, as rates ease, utilities and REITs benefit from cheaper debt refinancing and renewed investor appetite for stable income. This dynamic explains the recent recovery of the Solactive Canada Utility Index as expectations of rate cuts grew toward mid-2024.
For UMAX, which derives its yield from dividend-paying utilities combined with a covered call strategy, this environment is particularly supportive. Lower rates improve both price stability and option premiums, helping sustain its double-digit yield target. If the Bank of Canada continues its easing trajectory, utility stocks and REITs may continue to outperform, reinforcing UMAX’s potential as a powerful income generator for investors seeking diversification away from pure fixed income.
Video
Summary table Risk vs Benefits of a covered call strategy
Aspect
Description
Strategy
Selling call options on a security already owned in the portfolio
Name
Covered call strategy
Risk
Potential for limited upside if the stock price rises above the strike price
Benefit
Generates additional income through premium payments received from selling call options
Goal
To earn income from stock holdings while potentially reducing downside risk
Use
Often used by investors who are willing to sell their stock at a certain price if it reaches that level
Outcome
If the stock price stays below the strike price, the option expires worthless, and the investor keeps the premium payment. If the stock price rises above the strike price, the option buyer may exercise their right to buy the stock, and the investor must sell the stock at the strike price, but still keeps the premium payment.
UMAX Portfolio of stocks
TICKER
NAME
WEIGHT
BCE
BCE Inc
7.7%
TRP
TC Energy Corp
7.7%
ENB
Enbridge Inc
7.7%
RCI/B
Rogers Communications Inc
7.7%
FTS
Fortis Inc/Canada
7.7%
EMA
Emera Inc
7.7%
PPL
Pembina Pipeline Corp
7.7%
WCN
Waste Connections Inc
7.7%
CNR
Canadian National Railway Co
7.7%
H
Hydro One Ltd
7.7%
T
TELUS Corp
7.7%
NPI
Northland Power Inc
7.7%
CP
Canadian Pacific Kansas City Ltd
7.7%
Management fees
Management Fee
0.65%
UMAX Dividends
Sector Allocation
UMAX ETF provides a diversified portfolio with sector allocations designed to capture opportunities across different segments of the market. The fund’s sector allocation includes Communication Services (23.5%), Pipelines (23.1%), Industrials (23.9%), and Utilities (30.9%).
Communication Services focuses on telecommunications, media, and entertainment. Pipelines offer exposure to essential energy infrastructure. Industrials cover manufacturing, transportation, and construction. Utilities provide stability and income generation potential.
The UMAX ETF’s sector allocation aims to balance growth potential, income generation, and stability, offering investors a well-rounded investment approach. As with any investment, thorough research and consideration of personal circumstances are recommended. Consulting with a financial advisor is advised.
Final thought: is UMAX is the right ETF for you?
If you’re in pursuit of consistent dividend income, you’ve likely come across the UMAX ETF, which offers an alluring yield through its covered call strategy. This approach can indeed provide an attractive stream of income, but there are some key considerations to bear in mind.
Firstly, the high distribution offered by UMAX can be a double-edged sword. While it’s great for generating income, it may also increase your tax burden, so it’s wise to consult with a tax advisor to understand the implications for your specific situation.
Secondly, it’s important to understand that the covered call strategy comes with limitations. By design, it can cap the potential for growth. As highlighted in this post, roughly 50% of the UMAX portfolio is impacted by this strategy. The use of at-the-money (ATM) options is primarily aimed at boosting income, often at the expense of significant growth.
So, who is UMAX best suited for? This ETF is more aligned with investors who have a genuine need for a monthly income source and are willing to tolerate moderate volatility. If you can stomach the ups and downs and prioritize income over the potential for substantial long-term price appreciation, then UMAX may align with your financial goals.
However, it’s crucial to remember that no investment comes without trade-offs. The covered call strategy provides stability and income, but it may not deliver the same growth prospects as other investments. Your choice should depend on your unique financial circumstances, risk tolerance, and investment objectives.
In conclusion, UMAX can be a valuable tool for income-focused investors, but it’s not a one-size-fits-all solution. Consider your long-term goals, tax implications, and willingness to accept moderate volatility when deciding if this ETF is the right fit for your portfolio.