If you’re a Canadian investor looking for exposure to the technology sector similar to what the Vanguard Information Technology ETF (VGT) offers, you’re not alone — “VGT Canadian equivalent” is one of the most searched ETF queries in Canada. The good news: there are several strong TSX-listed options depending on whether you want Nasdaq-100 exposure, global tech, or pure Canadian tech.

Here is a quick overview of the best VGT Canadian equivalents available on the TSX:

SymbolNameMERCurrency
QQC.TOInvesco NASDAQ 100 Index ETF (CAD, unhedged)~0.20%CAD
QQC-F.TOInvesco NASDAQ 100 Index ETF (CAD-Hedged)0.25%CAD Hedged
ZQQ.TOBMO Nasdaq 100 Hedged to CAD Index ETF0.39%CAD Hedged
ZNQ.TOBMO Nasdaq 100 Equity Index ETF (unhedged)0.39%CAD
XQQ.TOiShares NASDAQ 100 Index ETF (CAD-Hedged)0.39%CAD Hedged
TEC.TOTD Global Technology Leaders Index ETF0.35%CAD
HXQ.TOGlobal X NASDAQ-100 Index Corporate Class ETF0.28%CAD
XIT.TOiShares S&P/TSX Capped Info Tech Index ETF0.61%CAD

What is VGT?

VGT employs an indexing investment approach designed to track the performance of the MSCI US Investable Market Index (IMI)/Information Technology 25/50 — an index made up of stocks of large, mid-size, and small U.S. companies within the information technology sector.

VGT has a very low expense ratio of 0.10%, making it one of the cheapest ways to access the U.S. tech sector — but it trades in USD on the NYSE, which means Canadian investors face currency conversion costs and potential withholding tax issues outside an RRSP.

Key VGT stats (March 2026):

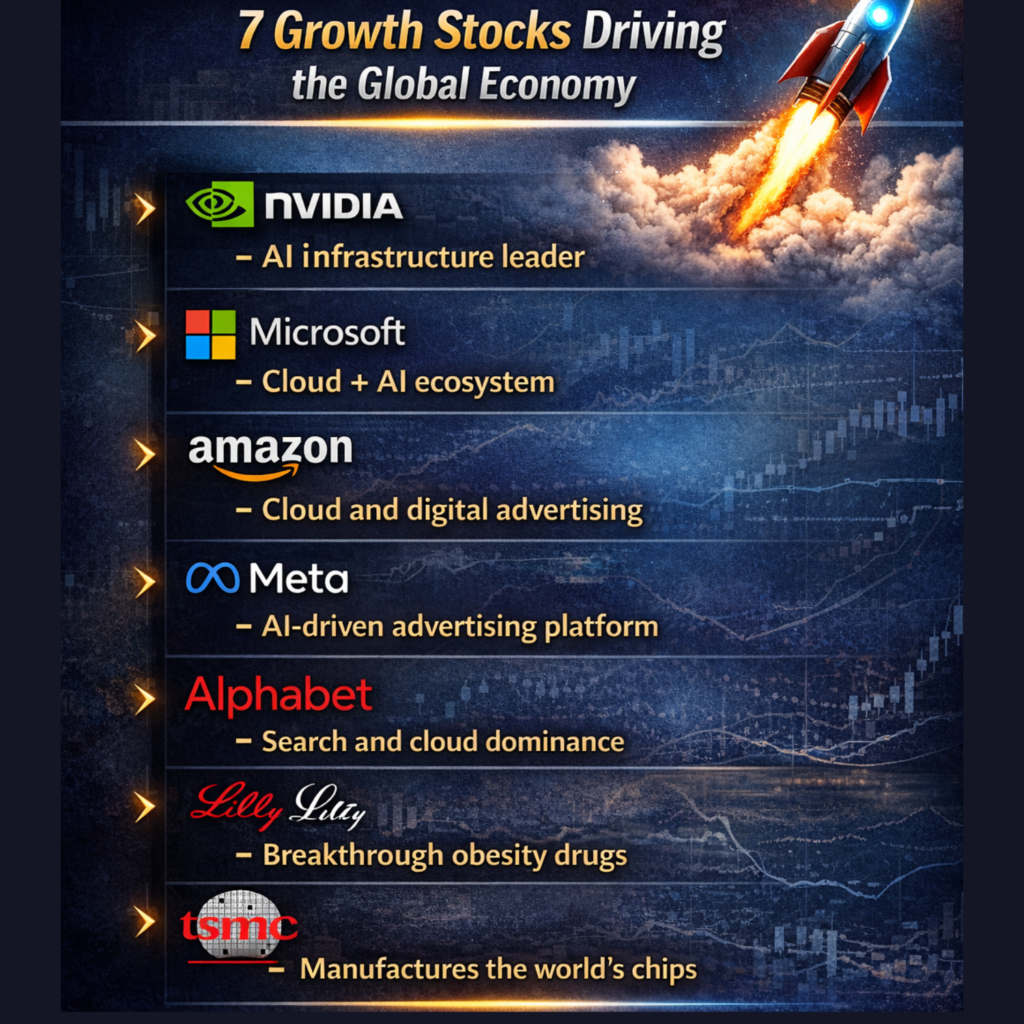
VGT holds 323 individual stocks. The top holdings are NVIDIA at 18.07%, Apple at 15.84%, Microsoft at 10.39%, Broadcom at 4.34%, and Micron Technology at 2.37%. Total assets have grown to $108 billion USD.

The big shift since this article was last written: NVIDIA has overtaken Apple and Microsoft as the dominant holding, reflecting the AI infrastructure boom that has reshaped the tech sector since 2023.


Why Canadian Investors Can’t Simply Buy VGT

Before diving into the alternatives, it’s worth understanding why a direct VGT purchase isn’t always ideal for Canadians:

  • Currency risk: VGT is priced in USD. A strengthening CAD erodes your returns.
  • Withholding tax: U.S.-listed ETFs held in a TFSA are subject to a 15% withholding tax on dividends — you lose this permanently. In an RRSP, the tax treaty exempts you.
  • FX conversion fees: Buying USD costs money. Without Norbert’s Gambit, your broker’s spread can cost 1.5–2% per transaction.
  • T1135 reporting: Holding more than CAD $100,000 in foreign property outside registered accounts requires CRA reporting.

Canadian-listed equivalents eliminate most of these frictions.


The Best VGT Canadian Equivalents in 2026

1. QQC.TO — Invesco NASDAQ 100 Index ETF (Unhedged) ⭐ Best Value

Our top pick for most investors. QQC tracks the NASDAQ-100 Index in Canadian dollars without currency hedging, and comes with one of the lowest expense ratios in its category at effectively 0.20% or less Cursor IDE — roughly half the cost of competing NASDAQ-100 ETFs from BMO and iShares.

The unhedged structure means you retain full USD/CAD currency exposure, which has historically benefited Canadian investors as the USD has tended to strengthen against CAD over long periods.

Key details:

  • Tracks: NASDAQ-100 Index
  • MER: ~0.20% (among the lowest for NASDAQ ETFs in Canada)
  • Currency: Unhedged CAD
  • AUM: ~$2.6B CAD
  • Top holdings: Apple, Microsoft, NVIDIA, Amazon, Broadcom

Best for: Cost-conscious investors who want maximum NASDAQ-100 exposure and are comfortable with CAD/USD fluctuations.


2. QQC-F.TO — Invesco NASDAQ 100 Index ETF (CAD-Hedged)

The hedged sibling of QQC, QQC.F carries a total expense ratio of 0.25% and eliminates currency risk by hedging the USD exposure back to CAD. It tracks the Nasdaq-100 index by investing in two of Invesco’s popular U.S.-listed Nasdaq-100 ETFs through a “fund of funds” structure.

The trade-off: hedging costs money and has historically reduced long-term returns for Canadian investors. The unhedged version has outperformed over the last three years, returning more than 11% annually versus 8.54% annually for the CAD-hedged version. That gap can narrow or reverse depending on the USD/CAD exchange rate.

Best for: Investors who want NASDAQ-100 exposure and are specifically concerned about short-term CAD/USD volatility — for example, those close to drawing down their portfolio.


3. ZQQ.TO — BMO Nasdaq 100 Hedged to CAD Index ETF

ZQQ is the most popular Canadian NASDAQ-100 ETF, holding over $2.25 billion in assets. It tracks the index by owning its underlying stocks in their exact proportions, with a built-in currency hedge to reduce U.S. dollar volatility for Canadian investors.

Over 50% of its portfolio is allocated to major tech names like Apple, Microsoft, Nvidia, and Meta — many of which have led the market in AI infrastructure, cloud services, and semiconductors.

The main drawback vs. QQC/QQC-F: its MER of 0.39% is nearly double Invesco’s offering for a virtually identical product. Brand recognition and long track record (2010 inception) are the primary reasons investors still choose it.

Best for: Investors who prefer BMO as a provider and want a CAD-hedged NASDAQ-100 ETF with a long track record.


4. TEC.TO — TD Global Technology Leaders Index ETF ⭐ Best for Global Tech

TEC is the standout differentiator in this list. While all the others track the NASDAQ-100, TEC tracks the Solactive Global Technology Leaders Index, which holds a market-cap weighted index of large- and mid-cap tech stocks from around the world. Country exposure is 84% U.S. tech stocks, with the rest in European, Japanese, and Canadian tech companies.

As of March 2026, TEC is trading around $49.91 with a market cap of $3.76 billion — making it one of the largest Canadian-listed tech ETFs available.

This global tilt gives you some diversification beyond pure U.S. tech concentration, with names like Taiwan Semiconductor (TSMC) added alongside Apple, Microsoft, and Alphabet. The MER of 0.35% is competitive.

Best for: Investors who want tech exposure beyond the U.S., particularly those concerned about concentration risk in NVIDIA, Apple, and Microsoft.


5. HXQ.TO — Global X NASDAQ-100 Index Corporate Class ETF

HXQ is a NASDAQ-100 ETF with a 0.28% MER. Its corporate class fund structure means it issues no distributions, making it uniquely tax-efficient for non-registered accounts — you pay no tax on dividends until you actually sell, deferring the tax hit entirely.

This is a significant advantage for high-income investors who hold tech ETFs outside their TFSA/RRSP and want to minimize annual taxable distributions.

Best for: Non-registered account holders in higher tax brackets who want to defer taxes on tech gains.


6. XQQ.TO — iShares NASDAQ 100 Index ETF (CAD-Hedged)

XQQ is the second-most popular NASDAQ-100 ETF in Canada, with over $4 billion in assets. Its structure directly holds the index’s underlying stocks, offering CAD-hedged exposure without an unhedged version.

The story here is similar to ZQQ — solid product, long track record, but priced at 0.39% when Invesco offers a comparable hedged product for 0.25%. The main reason to choose XQQ over QQC-F is if you specifically want an iShares/BlackRock product, or your brokerage offers commission-free trading on iShares ETFs.

Best for: Investors who prefer iShares as a provider and want a long-established CAD-hedged NASDAQ-100 option.


7. XIT.TO — iShares S&P/TSX Capped Info Tech ETF (Canadian Tech Only)

XIT is the only ETF on this list that invests exclusively in Canadian technology companies, tracking the S&P/TSX Capped Information Technology Index.

XIT holds just 27 Canadian technology stocks, with Constellation Software (CSU) and Shopify (SHOP) accounting for roughly 50% of total holdings at around 25% each. As a result, XIT tends to be fairly top-heavy and under-diversified compared to other sector ETFs.

At a MER of 0.61%, it’s the most expensive option on this list — and given its concentration in two stocks, the risk profile is much higher than any NASDAQ-100 ETF. That said, in 2025, XIT benefited from the strong performance of Shopify and Constellation Software.

Best for: Investors who specifically want exposure to Canadian tech companies and are comfortable with Shopify/CSU concentration risk.


VGT vs Canadian Equivalents: Head-to-Head Comparison

VGTQQCTECXIT
MER0.10%~0.20%0.35%0.61%
CurrencyUSDCADCADCAD
# Holdings323~100~200~27
Geographic focusU.S. onlyU.S. onlyGlobalCanada only
NVIDIA exposure~18%~7%~5%0%
TFSA-friendly⚠️ Withholding tax
RRSP-friendly

VGT vs QQC: What’s the Real Difference?

This is the most common question. Both give heavy tech exposure, but they track different indices:

  • VGT tracks the MSCI US IMI Information Technology 25/50 — a pure tech sector index including semiconductors, software, and hardware companies of all sizes.
  • QQC/ZQQ/XQQ track the NASDAQ-100 — the 100 largest non-financial companies on the NASDAQ exchange. This includes tech but also Amazon (consumer discretionary), Netflix (communication services), and Costco.

The result: VGT is a purer tech play with deeper semiconductor exposure (higher NVIDIA weighting). The NASDAQ-100 ETFs are slightly more diversified across sectors.

For Canadian investors, TEC comes closest to VGT’s pure-tech mandate while trading in CAD.


Which VGT Canadian Equivalent Should You Choose?

  • Best overall / lowest cost: QQC.TO (Invesco, unhedged)
  • Want currency hedging: QQC-F.TO (Invesco, hedged) or ZQQ.TO (BMO)
  • Global tech diversification: TEC.TO (TD)
  • Tax efficiency in non-registered accounts: HXQ.TO (Global X)
  • Canadian tech only: XIT.TO (iShares)

Context: Why Tech ETFs Matter in 2026

Technology remains one of the fastest-growing drivers of global equity returns heading into 2026. Worldwide IT spending surpassed US$5 trillion in 2025 and is expected to grow at a high-single-digit annual rate through 2027, led by artificial intelligence, cloud computing, cybersecurity, and enterprise software.

The NASDAQ-100 entered 2026 following a robust 2025 performance of approximately 22%, underpinned by a significant shift where corporate earnings — rather than rising valuations — became the primary driver of returns. Notably, the semiconductor industry continued its dominance, with Nvidia surpassing a $4 trillion market capitalization.

Looking ahead, the rise of agentic AI — moving beyond simple generative models toward AI agents capable of executing complex workflows — is driving a new wave of software productivity, while edge computing and the demand for specialized, power-efficient chips continue to shape semiconductor demand.


Disclaimer: This article is for informational purposes only and does not constitute investment advice. Always verify MER and fund data directly with the fund provider before investing. Data current as of March 2026.

How to Buy the U.S. Total Stock Market in CAD — VUN, XUU, ITOT and More

Best Pick VUN / XUUMER (VUN) 0.16%Index Tracked CRSP US TotalCurrency CAD (unhedged)
⚡ Bottom Line Up Front Canadian investors cannot directly buy VTI in a TFSA or RRSP without currency conversion. The best Canadian equivalents are VUN (Vanguard, 0.16% MER) and XUU (iShares, 0.07% MER) — both track the same CRSP US Total Market Index as VTI and trade in CAD on the TSX. XUU has the lowest cost; VUN has the longest track record.

Why Can’t Canadians Just Buy VTI?

VTI is a U.S.-domiciled ETF listed on the NYSE Arca. While Canadian investors technically can purchase VTI through a broker, there are three significant obstacles:

  • Currency conversion — You must convert CAD to USD to buy VTI, incurring exchange fees (typically 1.5–2% at big banks, or using Norbert’s Gambit to reduce this)
  • TFSA withholding tax — U.S.-listed ETFs held in a TFSA are subject to a 15% U.S. withholding tax on dividends under the Canada-U.S. tax treaty. Canadian-listed equivalents like VUN avoid this in an RRSP.
  • Administrative complexity — Managing USD accounts alongside CAD accounts adds complexity for most investors

This is why dedicated Canadian-listed VTI equivalents exist — they give you the same exposure to the U.S. total stock market while trading in Canadian dollars on the TSX.

The Best VTI Canadian Equivalents (2026)

Here are the top Canadian ETFs that replicate VTI’s strategy of tracking the U.S. total stock market:

TickerIssuerMERIndexNotes
VUNVanguard Canada0.16%CRSP US TotalMost popular, holds VTI directly
XUUiShares Canada0.07%S&P Total MarketLowest MER, slightly different index
ZSPBMO0.09%S&P 500S&P 500 only — not total market
VFVVanguard Canada0.09%S&P 500S&P 500 only — not total market
ITOTiShares (U.S.)0.03%S&P Total MarketU.S.-listed, requires USD
📌 Important Distinction ZSP and VFV track only the S&P 500 (500 large-cap stocks), NOT the total U.S. market. True VTI equivalents must track the entire U.S. market including small and mid-cap stocks. Only VUN and XUU qualify as true total market equivalents among Canadian-listed ETFs.

VUN ETF — The Most Popular VTI Equivalent for Canadians

The Vanguard U.S. Total Market Index ETF (VUN) is the closest direct equivalent to VTI for Canadian investors. It is structured as a “wrapper” fund — VUN holds units of VTI directly, so you are effectively getting VTI’s exposure packaged in a CAD-traded TSX-listed ETF.

Key FactVUN Value
Full NameVanguard U.S. Total Market Index ETF
TickerVUN.TO
ExchangeToronto Stock Exchange (TSX)
IssuerVanguard Canada
Index TrackedCRSP US Total Market Index
MER0.16%
CurrencyCAD (unhedged — USD exposure)
Number of Holdings~3,700+ U.S. stocks (via VTI)
Distribution FrequencyQuarterly
TFSA / RRSP EligibleYes

VTI vs VUN — Side-by-Side Comparison

Both VTI and VUN track the same index and hold the same underlying stocks. The differences are structural:

FeatureVTI (U.S.-listed)VUN (Canadian-listed)
Target InvestorsU.S. investorsCanadian investors
Index TrackedCRSP US Total MarketCRSP US Total Market
ExchangeNYSE Arca (U.S.)TSX (Canada)
CurrencyUSDCAD (USD underlying)
MER0.03%0.16%
HoldingsDirect — 4,000+ stocksHolds units of VTI
Currency HedgingN/ANone — unhedged
TFSA Withholding Tax15% on dividends15% (TFSA) / 0% (RRSP)
Best AccountRRSP (USD)TFSA or RRSP (CAD)
💰 The MER Gap Explained VUN charges 0.16% vs VTI’s 0.03% — a 0.13% gap. This extra cost covers Vanguard Canada’s administration of the Canadian wrapper fund. On a $100,000 portfolio, this is approximately $130/year extra. For most investors, the convenience of trading in CAD and avoiding currency conversion costs makes VUN the better practical choice.

What Is the CRSP US Total Market Index?

Both VTI and VUN track the CRSP US Total Market Index — the most comprehensive measure of the U.S. stock market. Here’s what makes it distinct:

  • Covers nearly 100% of investable U.S. market capitalization — from mega-caps like Apple and Microsoft down to small and micro-cap stocks
  • Includes stocks from NYSE, NASDAQ, NYSE American, and other U.S. exchanges
  • Market-cap weighted — larger companies have proportionally more influence on returns
  • Represents all major sectors: technology, healthcare, financials, consumer, industrials, energy, and more
  • Regularly rebalanced by CRSP (Center for Research in Security Prices at the University of Chicago) to reflect mergers, delistings, and new listings

This breadth is why VTI and VUN are considered “total market” funds — they do not cherry-pick the 500 largest companies like the S&P 500. They include the entire investable U.S. market, which historically provides slightly better long-term returns due to small-cap exposure.

Understanding Currency Risk with VUN

VUN trades in Canadian dollars but holds U.S. stocks priced in U.S. dollars. This creates currency exposure — a factor that significantly affects Canadian investors’ returns.

How Currency Affects Your Returns

ScenarioU.S. MarketYour VUN Return in CAD
USD strengthens vs CADFlatPositive — currency boost
USD weakens vs CADFlatNegative — currency drag
USD strengthens + market upUp 10%More than 10% in CAD
USD weakens + market upUp 10%Less than 10% in CAD
USD weakens + market downDown 10%More than -10% in CAD

VUN does not hedge currency risk. This is generally considered appropriate for long-term investors, since over 10+ year periods, currency effects tend to average out. Short-term investors or those close to retirement may want to consider a hedged alternative like VSP (Vanguard S&P 500 Index ETF — CAD-hedged).

💡 RRSP Advantage — The Withholding Tax Benefit When you hold VUN in an RRSP, the Canada-U.S. tax treaty eliminates the 15% U.S. dividend withholding tax on the underlying VTI distributions. This makes the RRSP the most tax-efficient account for holding VUN. In a TFSA, the 15% withholding tax still applies to dividends, though growth remains tax-free.

VUN vs XUU — Which Canadian VTI Equivalent Is Better?

The two main Canadian VTI equivalents are VUN (Vanguard) and XUU (iShares). Here’s how they compare:

FeatureVUN (Vanguard)XUU (iShares)
IndexCRSP US Total MarketS&P Total Market Index
MER0.16%0.07%
StructureHolds VTI directlyHolds ITOT directly
Holdings (approx.)~3,700 stocks~4,000 stocks
Inception20132015
AUMLarger, more liquidLarge, liquid
DistributionQuarterlyQuarterly
Historical performanceNearly identicalNearly identical
🏆 Which Should You Choose? For pure cost efficiency, XUU wins at 0.07% MER vs VUN’s 0.16%. For investors who want the Vanguard brand and direct VTI exposure, VUN is excellent. The performance difference between the two over 10+ years will be minimal. If cost is your priority, XUU. If simplicity and brand familiarity matter, VUN. Either choice is excellent.

Where to Buy VUN in Canada

VUN and XUU are available at all major Canadian discount brokerages:

  • Questrade — Commission-free ETF purchases (sells only have a small fee). Best for regular contributions.
  • Wealthsimple Trade — Commission-free buying and selling for all ETFs. Simple interface for beginners.
  • TD Direct Investing, RBC Direct, BMO InvestorLine — Available at all major bank brokerages. Higher commission fees.
  • CIBC Investor’s Edge — Available with competitive pricing for active traders.
💡 Best Strategy for Canadians Buy VUN or XUU in your TFSA first (up to the annual contribution limit), then in your RRSP. For maximum tax efficiency on dividends, favour your RRSP for VUN since the RRSP eliminates U.S. dividend withholding tax under the Canada-U.S. tax treaty.

How to Use VUN in a Canadian Portfolio

VUN is typically used as the U.S. equity component of a DIY Canadian portfolio. Here are the most common approaches:

Option A — Simple 3-ETF Portfolio

ETFAllocationExposure
XIC or VCN25–30%Canadian stocks
VUN or XUU40–45%U.S. total market
XEF or VIU20–25%International developed
XEC (optional)5%Emerging markets

Option B — Use an All-in-One ETF Instead

If you prefer not to manage multiple ETFs, consider XEQT or VEQT — they include VUN-equivalent U.S. exposure automatically alongside Canadian, international, and emerging market stocks. This is the simplest approach for most investors.

Frequently Asked Questions

Can I buy VTI in my TFSA?

Yes — but it’s generally not recommended. VTI is a U.S.-listed ETF, so you’d need to convert CAD to USD and pay currency conversion fees. You’d also face a 15% U.S. withholding tax on dividends in a TFSA that you can’t recover. Buy VUN or XUU in your TFSA instead.

Is VUN the same as VTI?

Functionally yes — VUN holds units of VTI directly and tracks the same CRSP US Total Market Index. The main differences are that VUN trades in CAD on the TSX, charges a slightly higher MER (0.16% vs 0.03%), and is designed for Canadian registered accounts.

What is the best VTI equivalent for Canadians?

For lowest cost: XUU at 0.07% MER. For most popular and familiar: VUN at 0.16% MER. Both are excellent choices that track the total U.S. stock market in CAD.

Does VUN hedge currency risk?

No. VUN is unhedged — your returns in CAD will be affected by USD/CAD exchange rate fluctuations. When the USD strengthens, VUN returns in CAD are boosted. When USD weakens, returns are reduced. For long-term investors (10+ years), currency effects tend to even out.

Is VUN better than VFV or ZSP?

VUN and VFV/ZSP are different products. VUN tracks the entire U.S. stock market (3,700+ stocks), while VFV and ZSP track only the S&P 500 (500 large-cap stocks). VUN provides broader diversification including small and mid-cap stocks. Historically, total market and S&P 500 returns have been very similar, but they are not identical.

Disclaimer

This article is for educational purposes only and does not constitute financial advice. ETF fees and details are subject to change. Always verify current data with the fund provider before making investment decisions. Past performance does not guarantee future results.

© 2026 WyzeInvestors.com

If you’re looking to invest in Canada’s stock market through a low-cost index ETF, two names come up instantly: XIU and XIC — both issued by iShares (BlackRock). They track different indices, carry different fee structures, and appeal to slightly different types of investors. This guide gives you a complete, up-to-date comparison so you can decide which one belongs in your portfolio.


Quick Comparison: XIU vs XIC (2026)

XIUXIC
Full nameiShares S&P/TSX 60 Index ETFiShares Core S&P/TSX Capped Composite Index ETF
Index trackedS&P/TSX 60S&P/TSX Capped Composite
# of holdings60~240
MER0.18%0.06%
AUM~$20.6B CAD~$12B CAD
InceptionSeptember 1999February 2001
Dividend yield~2.9%~1.8%
Dividend frequencyQuarterlyQuarterly
1-year return~33.3%~37.5%
10-year annualized~13.9%~13.9%

What is an Index ETF?

An Exchange Traded Fund (ETF) is a type of investment fund traded on stock exchanges just like individual stocks. Index ETFs — the first kind of ETF introduced to North American markets — aim to replicate the performance of a specific market index by holding all or most of the securities within it. Their core appeal: broad diversification at very low cost, without active management decisions that often underperform the market over time.

Do Index ETFs Pay Dividends?

Yes. Since XIU and XIC hold shares of dividend-paying Canadian companies, those dividends flow through to ETF unitholders on a quarterly basis. XIC pays dividends quarterly — the last distribution in January 2026 was $0.28 per unit, with a current yield of approximately 1.80%. XIU’s dividend yield runs slightly higher at around 2.9%, reflecting the heavier weighting of Canadian banks in a tighter portfolio.


The Indices: What’s the Difference?

S&P/TSX Capped Composite Index (XIC)

This is the broadest measure of the Canadian equity market. It includes over 200 of the top-ranked Canadian stocks by market capitalization, representing approximately 95% of the entire Canadian equity market. Individual positions are capped at 10% to prevent any single stock from dominating the index. XIC holds 240 large-, mid-, and small-cap stocks — the same top 10 holdings as XIU, but with over 180 additional small and mid-cap companies that XIU excludes.

S&P/TSX 60 Index (XIU)

This index comprises the 60 largest companies listed on the TSX by market capitalization, offering concentrated exposure to Canada’s biggest, most liquid corporations. XIU originally traces its history to the first ETF in the world — the Toronto 35 Index Participation Fund launched in March 1990. It has since grown into Canada’s largest ETF by assets.


XIU vs XIC: Key Metrics Compared

1. Management Fees (MER)

This is the starkest difference between the two funds. XIU has an MER of 0.18% compared to XIC at 0.06% — a difference of around $14 per year on a $10,000 portfolio, which compounds significantly as your portfolio grows.

On a $500,000 portfolio, that gap becomes $600/year in fees — money that stays in your pocket with XIC. The clear winner on cost is XIC.

2. Assets Under Management (AUM)

XIU’s assets under management stand at approximately $20.56 billion CAD, making it the largest ETF in Canada. XIC has approximately $10–12 billion in AUM. Both are more than large enough to ensure excellent liquidity, tight bid-ask spreads, and no risk of closure.

3. Performance

This is where many investors are surprised. Despite XIU’s higher fees, both ETFs have delivered nearly identical 10-year annualized returns — XIU at approximately 13.94% and XIC at 13.92%. Over the very long term, the broader diversification of XIC doesn’t significantly alter outcomes because the small and mid-caps it adds represent a small fraction of total weight.

In the past year specifically, XIU delivered a total return of approximately 33.3% including dividends. XIC’s yearly performance shows a 37.45% increase — giving XIC the edge in the most recent period, driven partly by the strong 2025 performance of Canadian financials and materials companies.

4. Diversification

XIC is still concentrated in the financials and energy sectors, but there is a more balanced allocation to other sectors — including materials, industrials, technology, utilities, and telecoms — as a result of its small and mid-cap holdings. The proportion of small and mid-caps is still small, but does introduce additional volatility compared to XIU.

XIU sector breakdown (2026):

SectorWeight
Financial Services37.1%
Energy17.2%
Basic Materials16.5%
Industrials8.1%
Technology8.4%
Consumer Cyclical4.1%
Consumer Defensive3.5%
Utilities2.7%
Communication Services2.2%
Real Estate0.2%

5. Volatility

Both ETFs carry similar risk profiles given their overlapping top holdings. The correlation between XIC and XIU is 0.96 — extremely high, meaning they move almost in lockstep. XIC’s beta is marginally higher due to its small and mid-cap exposure, but the practical difference for most buy-and-hold investors is negligible.

6. Liquidity

XIU is the more liquid of the two — both in terms of the underlying holdings (60 of Canada’s largest companies) and trading volume on the TSX. That said, XIC’s liquidity is also excellent given its $12B+ in assets. Neither fund presents any liquidity concerns for retail investors.


Taxation Considerations

Both XIC and XIU distribute Canadian eligible dividends quarterly, which qualify for the dividend tax credit — making them more tax-efficient in non-registered accounts than interest income or foreign dividends.

If you want to avoid all distributions entirely for maximum tax deferral in a non-registered account, consider HXT from Global X. HXT replicates the S&P/TSX 60 Index (same as XIU) but is structured to defer all income distributions, meaning no dividend payments and no immediate tax liability — with a substantially lower MER of 0.03%.

Account type guidance:

  • TFSA: Either XIU or XIC — distributions are tax-free regardless
  • RRSP: Either — distributions are tax-sheltered until withdrawal
  • Non-registered: Consider HXT for tax deferral, or XIC/XIU if you prefer regular quarterly income

Alternatives to XIU and XIC

If you’re comparing beyond just these two iShares options, two other Canadian broad market ETFs are worth knowing:

ZCN (BMO S&P/TSX Capped Composite Index ETF) — essentially the same exposure as XIC but from BMO, with a similarly low MER of 0.06%. A direct swap for XIC if you prefer BMO as a provider.

VCN (Vanguard FTSE Canada All Cap Index ETF) — Vanguard’s Canadian market ETF, with an MER of 0.05%, holding over 180 Canadian stocks including small caps. Slightly cheaper than XIC, comparable diversification.


XIU vs XIC: Which One Should You Choose?

Choose XIU if:

  • You want maximum liquidity and Canada’s most established ETF
  • You prefer a tighter, large-cap-only portfolio with slightly higher dividend yield
  • You are comfortable paying 0.18% for the simplicity of the S&P/TSX 60

Choose XIC if:

  • You want the lowest possible cost (0.06% MER)
  • You prefer slightly broader exposure including mid and small caps
  • You want to minimize fees compounding against you over decades

Our take: For most long-term Canadian investors, XIC is the better choice — broader diversification at a fraction of the cost. That said, XIU is an excellent fund and you truly can’t go wrong with either one. The 10-year returns are virtually identical, which means the fee difference is the clearest differentiator over time.


How to Buy XIU or XIC

Buying either ETF is identical to buying a stock. Log into your online brokerage account (Questrade, Wealthsimple Trade, CIBC Investor’s Edge, TD Direct Investing, etc.), search for the ticker symbol XIU.TO or XIC.TO, and place your order. Both trade on the Toronto Stock Exchange in Canadian dollars with no currency conversion required.


Video

Disclaimer: This article is for informational purposes only and does not constitute investment advice. Performance data sourced from Yahoo Finance and PortfoliosLab as of March 2026. Always verify current data with the fund provider before investing.

The stock market environment in 2026 is shaped by several major forces that directly influence growth stocks:

• the spectacular rise of artificial intelligence
• massive investments in data centers and cloud infrastructure
• the transformation of the healthcare and biotechnology sectors
• the acceleration of automation and robotics

After several years dominated by large technology companies, investors are now looking to identify businesses capable of sustaining exceptional growth over the coming years. For Canadian investors, these companies often represent an excellent diversification opportunity, since the Canadian market is heavily concentrated in the following sectors:

• financial
• energy
• natural resources

Investing in technology or innovative companies therefore adds a powerful long-term growth engine to a portfolio. In this article, we analyze 7 companies that have some of the strongest growth profiles in 2026.

Executive Summary


The Criteria Used to Select These Companies

Before presenting the companies, it is important to understand the criteria used to identify a true growth stock.

Here are the key elements we looked for:

Strong revenue growth


The best growth companies typically show annual revenue increases above 15% or 20%.

Leadership in a rapidly expanding sector


Companies that dominate sectors such as:

• artificial intelligence
• cloud computing
• semiconductors
• innovative healthcare

often benefit from a durable competitive advantage.

High margins


The most successful technology companies often have high margins, allowing them to reinvest heavily in research and innovation.

Sustainable competitive advantage


This may include:

• a unique technology
• a massive user network
• a dominant platform.

Long-term growth potential


The selected companies must be able to continue growing for many years, rather than simply benefiting from a temporary trend.

1. Nvidia (NVDA) — The Heart of the Artificial Intelligence Revolution

Nvidia is no longer just a component manufacturer; it has become an indispensable architect of the global digital economy, with a market capitalization exceeding $4.5 trillion.

The company exerts near-hegemonic control over critical technologies:

Market dominance: Nvidia holds roughly 92% of the discrete graphics processing unit (GPU) market as of early 2026.
AI infrastructure: Its chips power more than 80% of AI servers used to train language models such as GPT.
Strategic clients: The “Hyperscalers” (Microsoft, Amazon, Google, and Meta) alone represent about 40% of the company’s revenue, reinvesting heavily in the new Blackwell chips.

Why Nvidia remains an exceptional growth company despite its size:

Explosive revenue growth: For fiscal year 2026, revenue is expected to grow by approximately 57%, driven by insatiable demand for data centers.
Record profitability: The company reports a gross margin close to 75% and an exceptional net profit margin of 53%, figures rarely seen for a hardware company.

For many analysts, Nvidia is one of the companies best positioned to benefit from the artificial intelligence revolution over the next decade.


2. Microsoft (MSFT) — The Most Powerful Technology Ecosystem

Microsoft no longer just sells software; it manages the digital infrastructure of the planet. It is the quiet giant that combines double-digit growth with absolute financial stability.

Key figures for 2026:

Azure growth: The Cloud segment (Azure) maintains strong growth of +33%, driven by the massive integration of AI.
AI monetization: Copilot (AI integrated into Office 365) is estimated to add about $10 billion in additional annual revenue through premium subscriptions.
Operating margins: The company maintains an extraordinary operating margin of around 43%, while heavily reinvesting in data centers.

Why include it in a portfolio?

Office dominance: More than 400 million paying users (Office 365) are now deeply integrated into its AI ecosystem (Excel, Word, Teams).
Dividend strength: Microsoft has increased its dividend every year for the past 20 years, with an average annual growth rate of about 10%.
Cash reserves: With more than $100 billion in cash, it has the financial firepower to acquire virtually any future technological innovation.

The verdict: Microsoft is the ultimate core portfolio holding. It offers exposure to AI with significantly less volatility than semiconductor manufacturers.

Result: a company that combines growth, profitability, and market dominance.

3. Amazon (AMZN) — An Undervalued Technology Giant

Much more than just an e-commerce website, Amazon has become a powerful cash-flow machine thanks to its high-margin services.

Key figures for 2026:

Cloud dominance (AWS): Amazon maintains its position as the global leader with about 31% market share, generating more than $100 billion in annual revenue with operating margins close to 30%.
Advertising explosion: This is the hidden engine. Its advertising revenue is growing by +20% per year, exceeding $50 billion. It has become a pure profit engine that now rivals Google and Meta.
Logistics optimization: Thanks to AI-driven automation, Amazon has reduced its delivery costs by more than 15% while increasing shipping speed.

Why buy it now?

Attractive valuation: Despite its size, Amazon trades at a price-to-cash-flow ratio historically low compared with its 5-year average, making it appear “undervalued.”
Net income growth: Analysts expect earnings per share (EPS) to increase by +35% for fiscal year 2026.
AI synergy: Amazon plans to invest $150 billion over 15 years in data centers to support global demand for generative AI through AWS.

The verdict: Amazon is the ideal stock for investors seeking exposure to both retail consumption and the cloud revolution, with a more diversified risk profile than pure technology companies.


4. Meta Platforms (META) — AI at the Service of Advertising

Meta is no longer just a social network; it is the largest AI-optimized advertising targeting platform in the world. After a historic restructuring, the company shows extremely strong financial health heading into 2026.

The power of the ecosystem in numbers:

Massive reach: More than 3.3 billion people use at least one Meta application (Facebook, Instagram, WhatsApp) every day.
AI efficiency (Advantage+): AI-driven advertising tools have increased advertisers’ return on ad spend (ROAS) by 32%.
Profit margins: Meta has recovered operating margins of around 40%, thanks to cost reductions and increased automation.

Why Meta remains a growth stock in 2026:

Earnings growth (EPS): Analysts expect annual earnings growth of +14% over the next two years.
Share buybacks: Meta has authorized a massive $50 billion share repurchase program, directly supporting shareholder value.
WhatsApp monetization: The “Business Messaging” segment on WhatsApp is beginning to generate substantial revenue, with growth of +60% year over year.

The verdict: Meta is the ideal stock for investors betting on user data and digital advertising. It is the company that best converts artificial intelligence into immediate advertising dollars.

5. Alphabet (GOOGL) — The Engine of the Digital Economy

Alphabet dominates search and has successfully transitioned toward generative AI (Gemini), while transforming Google Cloud into a powerful profit engine.

Dominance in numbers for 2026:

Search monopoly: Google holds more than 90% of the global search market share, generating over $60 billion in free cash flow annually.
Cloud growth: Google Cloud has reached sustainable profitability with annual growth of +28%.
YouTube power: With more than 2.7 billion active users, YouTube generates over $35 billion in annual advertising revenue.

Why Alphabet is an opportunity in 2026:

AI integration: The “Gemini” AI is integrated into Android (3 billion devices) and Google Workspace.
War chest: With more than $110 billion in net cash, Alphabet has the financial strength to repurchase its own shares.

Alphabet is a stock that combines stability, growing dividends, and innovation.


6. Eli Lilly (LLY) — The Revolution in Obesity Medications

Eli Lilly does not just sell medications; it holds the solution to one of the world’s biggest public health challenges: obesity. In 2026, the company stands as the most valuable healthcare company in the world.

The explosion of numbers in 2026:

Revenue growth: Driven by the phenomenal success of Zepbound and Mounjaro, annual revenue growth exceeds 30%, an unprecedented pace for a pharmaceutical giant.
Massive market: Analysts estimate that the global weight-loss drug market (GLP-1) will reach $150 billion by 2030. Eli Lilly currently captures nearly half of that market.
Production capacity: The company has invested more than $18 billion since 2020 to build new manufacturing facilities to meet demand that still exceeds supply.

Why Eli Lilly is a powerful growth engine:

Expanded indications: Its treatments are in late-stage trials for sleep apnea and kidney disease, significantly expanding its reimbursed patient base.
Alzheimer’s pipeline: Beyond obesity, its new Alzheimer’s treatment (Donanemab) is beginning to contribute meaningfully to results in 2026.
Stock performance: The stock has delivered more than 500% returns over the past five years, significantly outperforming the S&P 500.

The verdict: Eli Lilly is the ultimate healthcare growth stock. For Canadian investors, it offers valuable diversification in a sector where innovation creates extremely profitable monopolies.

7. Taiwan Semiconductor (TSM) — The Company That Manufactures the World’s Chips

If Nvidia is the brain of artificial intelligence, TSMC is its exclusive factory. Without this company, Apple, Nvidia, and AMD would practically cease to exist. In 2026, TSMC confirms its status as an indispensable technological monopoly.

Dominance in numbers for 2026:

Overwhelming market share: TSMC manufactures more than 90% of the world’s most advanced semiconductors (3nm and below).
Revenue growth: Thanks to the explosion of AI, the company expects a compound annual growth rate of 15% to 20% over the coming years.
Iron margins: Despite massive investments, it maintains an impressive gross margin of 53%, effectively dictating prices to its clients.

Why TSMC is a pillar of growth:

The transition to 2nm: In 2026, TSMC begins mass production of 2-nanometer chips, widening a technological gap that competitors (Intel, Samsung) struggle to close.
Rising dividends: Unlike many growth stocks, TSMC pays a stable dividend that has increased by nearly 10% per year on average.
Reasonable valuation: It often trades at a more attractive price-to-earnings (P/E) ratio than major U.S. software giants, offering a “value entry point” within a growth sector.

The verdict: This is the most strategic stock in your portfolio. By owning TSM, you are indirectly investing in the success of Apple, Nvidia, and the entire robotics and automotive revolution.


How to Invest in These Companies (For Canadian Investors)

Although many investors prefer to buy individual stocks such as Nvidia or Microsoft, there is also a simple way to gain exposure to these companies: ETFs (Exchange-Traded Funds).

ETFs allow investors to invest in multiple companies at once, which reduces the risk associated with holding a single stock.

Here are a few ETFs popular among Canadian investors that include several of the companies mentioned in this article.

VFV – Vanguard S&P 500 ETF

The VFV ETF tracks the S&P 500 index and includes several of the largest growth companies in the world.

Notably, it includes:

• Nvidia
• Microsoft
• Amazon
• Meta
• Alphabet

This ETF therefore provides broad exposure to leading U.S. technology companies.

Advantages:

• immediate diversification
• very low management fees
• exposure to the world’s largest companies.


QQC – Invesco Nasdaq-100 ETF

The QQC ETF tracks the Nasdaq-100 index, which is heavily concentrated in technology and growth companies.

This fund includes several companies mentioned in this article:

• Nvidia
• Microsoft
• Amazon
• Meta
• Alphabet

For investors who want to maximize their exposure to technology companies, this ETF is often considered one of the best options.


Buying the Stocks Directly

Some investors also prefer to buy individual stocks in order to concentrate their portfolio on their favorite companies.

In this case, the stocks can easily be purchased through a Canadian broker in accounts such as:

• TFSA
RRSP
• non-registered account.


Tax Optimization for Canadian Investors

One element often overlooked by investors is the tax impact of the investment account they choose.

U.S. Stocks in an RRSP

When U.S. stocks such as Nvidia, Microsoft, or Amazon are held in an RRSP, Canadian investors benefit from an important tax advantage.

Thanks to the tax treaty between Canada and the United States:

• U.S. dividends are not subject to the 15% withholding tax.

This makes the RRSP particularly attractive for holding U.S. dividend-paying stocks.


U.S. Stocks in a TFSA

In a TFSA, the 15% U.S. withholding tax on dividends still applies.

However, the TFSA offers a major advantage:

• all capital gains are completely tax-free in Canada.

For growth companies such as Nvidia or Amazon — which pay little or no dividends — the TFSA remains an excellent investment vehicle.

Investing in Growth Stocks in a Volatile Market

The current market environment is characterized by increased volatility, particularly due to geopolitical tensions such as the conflict in the Middle East, as well as uncertainties surrounding interest rates and global economic growth. These factors can trigger rapid market corrections, even for very high-quality companies.

It is therefore not uncommon to see certain technology stocks decline by 10% to 20% over short periods, before resuming their long-term trajectory. For patient investors, these periods can represent attractive investment opportunities.

A first approach is to adopt a gradual entry strategy into the market. Rather than investing all capital in a single transaction, many investors prefer to spread their purchases over several weeks or months. This strategy helps reduce the risk of poor timing and allows investors to benefit from potential market pullbacks.

Another popular strategy is to take advantage of market dips, often referred to as buy the dip. During periods of uncertainty, markets can react excessively to economic or geopolitical news. This can temporarily lower the prices of high-quality companies, giving investors the opportunity to accumulate shares at more attractive valuations.

Finally, it is important to maintain a long-term perspective. Despite economic cycles and international tensions, several structural trends continue to support global growth, including artificial intelligence, cloud computing, semiconductors, and innovation in the healthcare sector.

The companies presented in this article are positioned at the center of these transformations. For this reason, many investors choose to use periods of volatility to gradually strengthen their positions while maintaining an investment horizon of several years.


Conclusion

Growth stocks remain one of the best ways to build long-term wealth.

In 2026, several companies clearly stand out thanks to their dominant position in rapidly expanding sectors.

Among the most promising:

• Nvidia
• Microsoft
• Amazon
• Meta
• Alphabet
• Eli Lilly
• Taiwan Semiconductor.

For Canadian investors, these companies provide direct exposure to major global technological and economic trends, which are often underrepresented in the Canadian market.

Of course, growth stocks can be volatile. A prudent strategy is therefore to diversify your portfolio and invest with a long-term perspective.

For a Canadian investor with $200,000, targeting $1,000 per month in passive income (about 6% annual yield) represents a real turning point.

At this level, you move:

From pure accumulation
To a strategic income management approach

The goal is no longer just growth, but predictable cash flow.

Here are three concrete portfolio structures, adapted to different investor profiles:
from direct stock ownership to hybrid models using covered call ETFs.

Executive summary


🔹 Model 1: Stock Selection

🎯 Who is it for?

This model is designed for investors who want to maintain some control over their portfolio while improving diversification through a dividend ETF. By combining a few strong Canadian stocks with a diversified ETF, it is possible to generate stable income while reducing the risk tied to any single company.

This approach suits investors who want to:

  • limit sector concentration
  • benefit from the Canadian dividend tax credit
  • simplify portfolio management

The sectors historically known for strong dividends remain:

  • Energy
  • Telecommunications
  • Banks
  • Utilities

Adding an ETF like XEI helps create a diversified base composed of several major Canadian companies.


Example Allocation

This allocation prioritizes dividend stability and improved diversification.

Stock / ETFAllocation%Est. YieldAnnual Income
iShares XEI$60,00030%4.20%$2,520
Enbridge (ENB)$30,00015%5.33%$1,599
Bank of Nova Scotia (BNS)$30,00015%4.53%$1,359
Telus (T)$30,00015%9.28%$2,784
Fortis (FTS)$30,00015%3.25%$975
BCE (BCE)$20,00010%4.85%$970
Total$200,000100%5.10%$10,207

💵 Estimated monthly income: ~ $850

This example highlights an important reality for income investors: with solid and diversified companies, portfolio yields often land around 5%. Reaching $1,000 per month purely from dividends would typically require about 6% yield, which often means higher concentration or more risk.


✅ Advantages

Combining individual stocks with an ETF allows investors to benefit from attractive dividends and better diversification.

  • Instant diversification through the ETF
  • Tax advantage from Canadian dividend credits
  • Exposure to several key sectors of the economy

Investors can also adjust positions over time as market conditions evolve.


⚠️ Risks

Even with an ETF, certain risks remain.

Sector concentration
The Canadian market remains heavily exposed to a few sectors such as energy, banks, and telecommunications.

Interest rate sensitivity
High-dividend stocks can react negatively when interest rates rise.

Company-specific risk
Some stocks may show high yields because their share price is under pressure.


Income Enhancement with Covered Calls

To get closer to the $1,000 per month goal, some investors use a covered call strategy on certain portfolio positions.

The principle is to sell call options on stocks already owned, collecting an option premium. A conservative approach typically involves selling options with a 30% delta and about one-month expiration.

Depending on the stock’s volatility, this strategy can generate 0.5% to 1% additional income per month. On a $200,000 portfolio, that can represent $1,000 to $2,000 per year, helping close the gap between $850 and the $1,000 monthly target.

However, this strategy also has limitations. If the stock rises above the strike price, the shares may be called away, limiting capital gains. If the stock falls, the option premium only partially offsets the loss.

Covered calls can increase income, but they require active and disciplined management.

This approach still offers reasonable growth potential while generating attractive monthly income, making it suitable for investors seeking both stability and yield.


🔹 Model 2: Core–Satellite (Stability + Yield Boost)

🎯 Who is it for?

The Core–Satellite model is a strategic approach combining stability with improved yield. It allows investors to maintain a solid diversified base while using part of the portfolio to increase monthly distributions.

This structure reduces risk compared to a fully high-yield strategy, while still helping investors approach the $1,000 per month goal with $200,000 invested.

This model is especially suited for:

  • investors seeking the stability of a diversified ETF
  • those wanting to increase their monthly income
  • those preferring a simple and structured portfolio

In practice, the portfolio is divided into two complementary components:

Core → diversified and relatively stable foundation
Satellite → strategies designed to enhance income

The core provides stability, while the satellite portion acts as a measured lever to increase total income.


Example Allocation

ComponentTypeAllocation%Est. YieldAnnual Income
iShares XEICore Foundation$120,00060%4.20%$5,040
BMO ZWCSatellite (Stability)$40,00020%5.84%$2,336
Hamilton HDIVSatellite (Diversified)$40,00020%10.55%$4,220
TOTAL$200,000100%5.80%$11,596

💵 Estimated monthly income: ~ $966


CORE – Portfolio Foundation

iShares S&P/TSX Composite High Dividend ETF (XEI) forms the base of the portfolio. This ETF provides exposure to several dozen Canadian dividend-paying companies.

It includes:

  • banks
  • energy companies
  • telecommunications
  • utilities
  • some industrial sectors

Advantages of the CORE:

  • broad sector diversification
  • exposure to strong Canadian companies
  • regular distributions
  • simple structure without leverage

XEI acts as the stable foundation of the portfolio, combining income with long-term growth potential.


SATELLITE – Yield Enhancement

The satellite portion aims to increase portfolio distributions using income-focused strategies.

BMO ZWC primarily invests in major Canadian banks while using covered calls to generate additional option premiums.

Hamilton HDIV adds further diversification by combining multiple sectors and income strategies, helping boost overall portfolio yield.

Advantages of the satellite portion:

  • higher monthly distributions
  • improved overall yield
  • additional diversification

Total Income

Core: ~ $5,040
Satellite ZWC: ~ $2,336
Satellite HDIV: ~ $4,220

Total: ~ $11,596 per year

💵 Monthly income: ~ $966


Why This Model Works

This portfolio relies on a balance between stability and enhanced yield.

Most capital is invested in XEI, providing diversification across many strong Canadian companies.

The satellite portion, using strategies such as covered calls, increases monthly distributions without relying solely on individual stocks.

This structure provides a balanced approach between:

  • diversification
  • income
  • risk management
  • simplicity

while helping investors approach the goal of $1,000 in monthly income with $200,000 invested.


🔹 Model 3: The 50/50 Hybrid (Growth + Volatility Monetization)

🎯 Who is it for?

Investors who want:

  • stable income
  • protection in sideways markets
  • a more robust strategy

Here, capital is divided between a base of dividend exposure and a higher-yield income strategy.


50% – XEI ($100,000)

iShares S&P/TSX Composite High Dividend (XEI)

Yield: ~4.20%
Annual income: $4,200

Exposure:

  • about 70 Canadian companies
  • broad sector diversification
  • banks, energy, telecom, utilities

XEI acts as the portfolio foundation, providing stable income and growth potential.


50% – HDIV ($100,000)

Hamilton Enhanced Multi-Sector Covered Call ETF (HDIV)

Yield: ~10.50%
Annual income: $10,500

Strategy:

  • multi-sector portfolio
  • covered calls to generate option premiums
  • exposure to banks, energy, and utilities

HDIV aims to monetize market volatility to increase monthly distributions.


Total Income

$4,200
$10,500

Total: $14,700

💵 Monthly income: ~ $1,225

Overall yield: ~7.35%


Why This Model Is Robust

  • XEI captures growth and stabilizes the portfolio
  • HDIV generates option premiums and boosts distributions
  • the combination increases yield without relying only on traditional dividends

This model works particularly well if:

  • markets stagnate
  • volatility remains elevated
  • interest rates remain relatively stable

In that environment, covered call strategies can continue generating additional income, allowing investors to achieve higher passive income while maintaining a diversified base.


⚠️ Risks and Limitations of Covered Call ETFs

Covered call ETFs can offer higher yields, but they also have limitations.

Limited upside potential
If markets rise strongly, shares may be called away due to the options sold, limiting participation in large market gains.

Income depends on volatility
Option premiums increase with volatility. In calmer markets, distributions may decline.

For this reason, covered call ETFs are often used as an income complement within a diversified strategy, rather than as the sole foundation of a portfolio.


📊 Strategy Comparison

StrategyAnnual IncomeMonthly IncomeComplexityGrowth PotentialDiversification
Stock Selection + ETF~ $10,207~ $850HighGoodModerate
Core–Satellite~ $11,596~ $966LowGoodHigh
Hybrid 50/50~ $14,700~ $1,225MediumModerateVery good

Important Tax Note

The tax structure of the account used directly impacts the net return of your income strategy.

In a taxable account:
Canadian dividends benefit from the dividend tax credit, reducing taxes compared to interest income. Covered call premiums are often treated as capital gains when used non-speculatively, which can be tax-efficient. Only 50% of capital gains are taxable, improving after-tax returns.
👉 Models 1 (individual stocks) and 3 (hybrid approach with options) can therefore be more tax-efficient in a taxable account.

In a TFSA:
All income — dividends, capital gains, and option premiums — is 100% tax-free.

In an RRSP:
Taxes are deferred until withdrawal at retirement, which may be advantageous if your current tax rate is high.


⚠️ Common Pitfalls

Trying to generate $1,000 per month with $200,000 is realistic, but several pitfalls can undermine the strategy.

1. Chasing very high yields (>9%)
Very high yields often signal higher risk or potential dividend cuts.

2. Ignoring capital erosion
Stable income is not enough if portfolio value declines over time.

3. Underestimating sector cyclicality
Banks and energy can provide strong dividends but remain sensitive to economic cycles.

4. Not rebalancing annually
Without rebalancing, a portfolio may become overly concentrated.


🚀 Growth Strategy: From $200,000 to $500,000

If you reinvest:

Average return: 6%
Annual contributions: $10,000

Approximate projection:

~ $350,000 in 10 years
~ $500,000 in 15–18 years

At $500,000:

6% = $30,000 per year
$2,500 per month

That’s when passive income becomes truly transformative.


🎯 Conclusion: $1,000 per Month Is Realistic… but Strategic

Generating $1,000 per month with $200,000 is not unrealistic. It’s not marketing hype — it’s an achievable goal for a disciplined investor.

But the result does not rely solely on yield. It depends on portfolio architecture.

What makes the difference:

Structure: choosing the right vehicles (stocks, ETFs, covered calls)
Tax efficiency: optimizing account types
Diversification: avoiding reliance on one sector
Discipline: rebalancing and resisting market hype

The real challenge is not achieving 6% for one exceptional year, but building a durable, predictable, and resilient income stream.

A well-constructed $200,000 portfolio can become much more than an investment — it can become a financial freedom engine, funding projects, reducing career pressure, or accelerating financial independence.

Since January 1, 2026, the global stock market has been experiencing a significant sector rotation. After several years of undisputed dominance by technology — driven by mega-caps such as Apple, Nvidia, Microsoft, and Alphabet — investors have gradually shifted their capital toward more tangible, cyclical, or defensive sectors.

This shift is not accidental. It reflects a macroeconomic environment that is fundamentally different from 2021–2024: structurally high inflation, cautious central banks, rising geopolitical uncertainty, and record public debt levels across several G7 economies.

In this context, three major sector themes have clearly stood out since the beginning of the year:

  • Gold and gold mining
  • Silver
  • Energy (oil and gas)

Let’s take a deeper look at why these sectors are leading and which Canadian ETFs have stood out year-to-date.

Executive summary


Gold and Mining: The Big Winners of 2026

Why Is Gold Outperforming in 2026?

Gold traditionally serves three key roles in a portfolio: a safe haven during uncertainty, a hedge against inflation, and a hedge against currency devaluation. In 2026, all three catalysts are present simultaneously — a rare combination that explains the magnitude of the rally.

Key drivers pushing gold to new all-time highs:

  • More persistent inflation than expected: Despite central bank efforts, inflation remains above target in several developed economies, particularly due to energy and commodity pressures.
  • Cautious central banks on rate cuts: The Fed and ECB have signaled a slower-than-expected pace of rate reductions, supporting gold’s appeal.
  • Rising geopolitical tensions: Ongoing conflicts, global supply chain fragmentation, and gradual de-dollarization in some emerging economies are fueling institutional demand.
  • Record central bank purchases: China, India, Turkey, and others continue accumulating gold reserves.
  • Record public debt: Soaring deficits in the U.S. and eurozone raise long-term fiat currency concerns.

As a result, gold reached new highs in 2026, boosting mining company profits, as margins expand when gold prices rise while operating costs remain relatively stable in the short term.

Top Gold ETFs YTD

BetaPro Gold Miners 2x Daily Bull ETF (GDXU)

GDXU seeks to deliver 2x the daily performance of a gold miners index before fees. It uses derivatives to amplify daily price movements of gold mining equities. When gold stocks are in a strong, sustained uptrend, this leverage can significantly enhance short-term gains.

However, the leverage resets daily. Over multiple days, performance can diverge from exactly 2x due to compounding effects (beta slippage), particularly in volatile or sideways markets. Drawdowns can also be amplified just as quickly as gains. GDXU is therefore designed for short-term tactical trading and active portfolio management, not long-term buy-and-hold investing.

BMO Junior Gold Index ETF (ZJG)

ZJG provides exposure to junior gold mining companies, typically smaller-cap exploration and early-stage production firms. These companies often have higher growth potential but also greater operational and financing risk.

Juniors tend to exhibit strong operational leverage to gold prices. Because many operate with higher fixed costs and thinner margins, rising gold prices can lead to disproportionately large increases in profitability and share prices. This makes ZJG more volatile than large-cap mining ETFs, but potentially more rewarding during strong gold bull markets.

iShares S&P/TSX Global Gold Index ETF (XGD)

XGD tracks a diversified index of large, established gold producers, including companies such as Barrick Gold, Agnico Eagle, and Newmont. These firms typically have diversified assets, stronger balance sheets, and more stable production profiles.

Compared to junior-focused funds, XGD offers lower volatility while still capturing the upside of rising gold prices. It is often used as a core gold equity holding within a portfolio, providing balanced exposure to the gold mining sector with reduced single-company risk.

Physical Gold vs Mining Stocks

Physical GoldGold Mining Stocks
VolatilityLowerHigher
Operational RiskNoneOperational, management, and geological risks
Leverage to Gold Price1:1Amplified (2x to 5x depending on the company)
DividendsNoYes (large producers)
Pure ProtectionExcellentPartial (correlated with equity markets)

Physical gold typically exhibits lower volatility compared to gold mining equities because it reflects only the price movement of the metal itself. It carries no operational, management, geopolitical, or cost-inflation risks. There are no earnings reports, production disruptions, or balance sheet concerns. As a result, physical gold often acts as a portfolio stabilizer and a pure hedge against inflation, currency debasement, and systemic risk.

Gold mining stocks, on the other hand, provide leveraged exposure to the price of gold. When gold prices rise, mining company margins can expand disproportionately, leading to amplified equity returns. Many large producers also pay dividends, adding an income component that physical gold does not offer. However, mining equities carry operational risks (cost overruns, labor issues, reserve depletion), geopolitical exposure (mining jurisdictions), and are partially correlated with broader equity markets during risk-off events.

ETFs such as BMO Gold Bullion ETF (ZGLD) and iShares Gold Bullion ETF (CGL) provide direct exposure to physical gold held in vaults. These funds are designed to closely track the spot price of gold, minus fees, offering investors a convenient and liquid way to gain bullion exposure without storage or insurance concerns.


Silver: The Hybrid Metal

Silver is both a precious metal and an essential industrial metal (solar panels, electronics, EVs, medical applications). This dual nature allows silver to outperform gold when economic activity remains solid while uncertainty persists.

Industrial demand drivers:

  • Solar panels (approx. 20 grams per panel)
  • Electric vehicles (2–3x more silver than combustion vehicles)
  • Electronics and semiconductors

Silver ETFs

BetaPro Silver 2x Daily Bull ETF (SLVU)


SLVU seeks to deliver twice the daily performance of silver futures before fees. It achieves this exposure through derivatives, primarily futures contracts, rather than holding physical silver. Because the leverage resets every day, performance over multiple days can differ materially from 2x the cumulative return of silver due to compounding effects, especially in volatile or sideways markets.

This structure makes SLVU extremely sensitive to short-term price movements. During strong, sustained uptrends, gains can be amplified significantly. However, sharp pullbacks or choppy price action can quickly erode returns. It is designed for active traders implementing short-term tactical strategies, not for buy-and-hold investors.

iShares Silver Bullion ETF (SVR)


SVR provides direct exposure to physical silver bullion stored in secure Canadian vaults. The fund is structured to closely track the spot price of silver, minus management fees and expenses.

Unlike leveraged ETFs or silver mining stocks, SVR does not introduce derivative leverage or operational mining risk. It offers a straightforward way to gain exposure to silver prices within a traditional brokerage account. This makes it suitable for long-term portfolio diversification, inflation hedging, or strategic precious metals allocation.

Canadian Silver Reserves ETR (MNS)
MNS is backed by allocated physical silver. It provides transparent, direct exposure to bullion prices without operational risk.

Silver vs Gold

Silver frequently amplifies gold’s performance during precious metals bull cycles. Several structural factors explain this dynamic:

  • The silver market is smaller and less liquid, making price movements more sensitive to capital inflows.
  • Speculative participation tends to be stronger in silver due to its higher volatility.
  • Industrial demand adds an additional layer of structural support.
  • Historically elevated gold/silver ratios often create catch-up potential for silver.

When both safe-haven demand and economic activity remain strong, silver can outperform gold significantly over a cycle.


Energy: Back in Force in 2026

After several years marked by ESG-related capital constraints, regulatory pressure, and volatile oil prices, the energy sector staged a powerful rebound in 2026. Underinvestment in new production capacity during the 2015–2022 period created structural supply tightness just as global demand stabilized, setting the stage for higher and more sustained commodity prices.

Several key catalysts explain the sector’s strength:

  • Constrained global supply: OPEC+ has maintained strict production discipline, actively managing quotas to support crude prices. Years of reduced capital expenditures globally have limited spare capacity, making supply less responsive to demand shocks.
  • Resilient global demand: Despite recession concerns, global oil consumption remains solid, supported by emerging markets, aviation recovery, petrochemical demand, and ongoing economic activity in Asia.
  • Stronger balance sheets and shareholder returns: Canadian energy producers have shifted toward capital discipline. Rather than pursuing aggressive growth, companies are prioritizing free cash flow, debt reduction, dividends, and share buybacks—enhancing total shareholder returns.
  • Geopolitical instability: Ongoing tensions in the Middle East, disruptions in key shipping routes, and broader geopolitical fragmentation have embedded a structural risk premium in oil prices.

Together, these factors have improved the quality of the sector compared to previous cycles, making energy equities more cash-flow driven and less expansion-dependent than in the past.

Leading Energy ETFs

iShares S&P/TSX Capped Energy Index ETF (XEG)


XEG is the benchmark Canadian energy ETF. It tracks the S&P/TSX Capped Energy Index and provides concentrated exposure to large-cap oil and gas producers such as Canadian Natural Resources, Suncor, and Cenovus.

Although the index is capped, the top holdings typically represent a significant portion of the portfolio, meaning performance is heavily driven by a handful of major producers. XEG is highly sensitive to movements in crude oil prices, particularly Western Canadian Select (WCS), and tends to amplify sector momentum during strong commodity cycles.

BMO Equal Weight Oil & Gas Index ETF (ZEO)


ZEO uses an equal-weight methodology, giving each constituent a similar allocation regardless of market capitalization. This structure reduces dependence on mega-cap producers and increases exposure to mid-sized companies.

Global X Equal Weight Canadian Oil & Gas Index ETF (NRGY)


NRGY follows a similar equal-weight approach focused exclusively on Canadian energy producers. It provides competitive fees and diversified exposure across upstream oil and gas companies.

Like ZEO, it reduces concentration risk compared to cap-weighted funds and allows smaller producers to contribute more meaningfully to returns.

While energy remains a cyclical sector, its structure has improved materially. Canadian producers now emphasize capital discipline, free cash flow generation, dividends, and share buybacks rather than aggressive expansion. This shift provides stronger balance sheets and offers partial downside support during commodity pullbacks.


Conclusion: The Real Lesson of 2026

Sector leadership changes over time. In 2026, tangible assets — precious metals and energy — are outperforming as investors respond to inflation, geopolitical risk, and public debt concerns.

YTD 2026 ranking:

  • Gold & Gold Mining
  • Silver
  • Energy (Canadian Oil & Gas)

Sector rotation is real and may continue if macro conditions persist.


Disclaimer: This article is for informational purposes only and does not constitute investment advice. Past performance does not guarantee future results. Consult a licensed financial advisor before making investment decisions.

Investing in private giants like SpaceX or OpenAI has traditionally been reserved for institutional or “accredited” investors. However, an accessible solution for retail investors involves using U.S.-listed vehicles (ETFs or closed-end funds) that hold these shares in their portfolios before their Initial Public Offering (IPO).

Why Choose Specialized Funds?

Waiting for an IPO might seem logical, but in reality, a large portion of a tech company’s growth occurs pre-IPO. By the time companies like SpaceX or OpenAI go public, their valuations often already reflect massive expectations. Specialized funds allow you to access this growth phase early, offering better long-term potential.

  • Secondary Market Access: These funds buy shares directly from employees, early investors, or historical holders looking to sell before the IPO. This opens a door that was once bolted shut for retail investors.
  • Strategic Diversification: Rather than betting on a single company, you invest in a portfolio of several technological “unicorns,” reducing specific risk.
  • Liquidity: Unlike traditional Private Equity, where capital can be locked up for years, these funds trade on major stock exchanges and can be bought or sold easily through a brokerage platform.

The 2026 “Mega-IPO” Wave: What’s at Stake?

The year 2026 is being hailed as the most significant year for technology listings in over a decade. For the first time, a cluster of “generational” companies—firms that have defined the AI and space-tech eras—are moving toward public markets simultaneously. For pre-IPO investors, the primary goal today is to secure positions in these giants before they hit public exchanges at potentially record-breaking valuations.

Wait-and-see strategies often miss the most explosive growth phases, as these 2026 targets represent critical infrastructure that the market is eager to own.

SpaceX: The Trillion-Dollar Frontier ($1.5 Trillion Target)

SpaceX is widely reported to be targeting a mid-2026 IPO, with rumors narrowing the window to June or July.

  • Strategic Evolution: Following its February 2026 all-stock acquisition of xAI, SpaceX has transformed into a combined Space-and-AI infrastructure powerhouse. This merger allows SpaceX to integrate advanced AI into its satellite navigation and autonomous manufacturing.
  • Revenue Engines: The Starlink satellite division remains its primary driver of high-margin recurring revenue, boasting over 10 million subscribers. Simultaneously, the deployment of Starship V3 is expected to cement a global monopoly on heavy-lift orbital launches.

OpenAI: The Infrastructure Race ($850B – $1T Target)

Reports from early 2026 indicate OpenAI is preparing for a Q4 2026 listing.

  • Massive Capital Needs: The company is reportedly closing a historic $100 billion funding round at an $830 billion valuation, backed by SoftBank, Amazon, and Microsoft.
  • Growth Outlook: This capital is essential to fuel OpenAI’s ambitious AI hardware and infrastructure plans, which include building its own specialized chip foundries and data centers. An IPO is the logical next step to provide the massive liquidity required for these decade-long projects.

Anthropic: The “Profitable” Challenger ($350B – $380B Target)

Often viewed as the “safety-focused” alternative to OpenAI, Anthropic has accelerated its own IPO preparations for late 2026.

  • Technical Lead: In February 2026, Anthropic’s latest models took a significant lead in coding and technical rankings, making it a critical “hedging” position for AI-focused portfolios.
  • Financial Path: Unlike some of its peers, Anthropic has shared projections showing it could reach breakeven by 2028, a major selling point for public market investors. It recently secured $30 billion in Series G funding, pushing its valuation to $380 billion.

Why the IPO Date Matters for Fund Investors

If you wait for these companies to list on the NYSE or NASDAQ, you are buying at the “retail price.” By using specialized funds like DXYZXOVR, or RONB now, you are effectively buying at the “wholesale price” established in private secondary markets. The goal is to benefit from the price “pop” and the massive institutional demand that often occurs when a highly-anticipated stock finally becomes accessible to the general public.

The Best Investment Options for 2026

Destiny Tech 100 (DXYZ)

The Destiny Tech 100 (DXYZ) represents a revolution for retail investors seeking Private Equity exposure. Listed as a Closed-End Fund (CEF) on the NYSE, DXYZ democratizes access: a single share allows you to indirectly become a shareholder in the world’s most coveted private companies.

Its portfolio structure is its main asset. With approximately 25% of its assets allocated to SpaceX, the fund links its destiny to Elon Musk’s space dominance. This concentration is balanced by AI pillars like OpenAI and Anthropic, as well as digital entertainment leaders like Epic Games.

However, this accessibility comes with a technical quirk: the Premium to Net Asset Value (NAV). Unlike a standard ETF, DXYZ’s price can deviate significantly from the actual value of the underlying shares, reflecting market hype. It is a bet on scarcity, offering daily liquidity where venture capital funds impose multi-year lockups. For those anticipating the 2026 IPOs, this is the most direct positioning tool available via brokers like Interactive Brokers.

Entrepreneur Private-Public Crossover ETF (XOVR)

Launched by EntrepreneurShares, XOVR marks a historic milestone as the first ETF authorized to directly hold private company securities within its structure.

Key features of this hybrid fund:

  • Crossover Pioneer: Unlike traditional ETFs limited to public markets, XOVR uses a regulatory exemption to allocate a significant portion to unlisted companies. SpaceX is its flagship position, representing about 10% of total assets.
  • “Entrepreneurial” Selection: Supervised by Dr. Joel Shulman, the fund prioritizes founder-led companies (like Musk for SpaceX), believing these leaders maximize long-term value.
  • Venture Capital Access: It offers daily liquidity on assets normally locked away.
  • Fees and Structure: With an expense ratio of 0.70%, it is significantly cheaper than most venture capital structures or closed-end funds like ARKVX.

Baron First Principles ETF (RONB)

Launched in December 2025 by Baron Capital, RONB is an active fund that boasts one of the highest exposures to SpaceX among publicly traded products.

The essentials of this fund:

  • Massive Bet on SpaceX: The fund allocates a significant portion of its portfolio to Musk’s aerospace company, with weightings generally fluctuating between 14% and 22%.
  • The Musk Ecosystem: Beyond SpaceX, the fund holds positions in Tesla (~13.8%) and the AI startup xAI (~5.4%), bringing its total exposure to Elon Musk-linked companies to nearly 40%.
  • “First Principles” Strategy: Managed by the legendary Ron Baron and his sons, the fund applies a philosophy of breaking down problems into fundamental truths to identify high-growth companies with durable competitive advantages.
  • Regulatory Innovation: To include so many private assets, Baron Capital classifies these securities as “less liquid” rather than “illiquid,” bypassing the standard 15% SEC cap for illiquid assets.

The Verdict: Which fund should you choose?

CriteriaDXYZXOVRRONB
Product TypeClosed-End Fund (CEF)Hybrid ETFActive ETF
SpaceX ExposureHigh (~23%)Medium (~10%)Very High (14-22%)
Fees (MER)High (~2.50%+)Low (0.70%)Moderate (1.00%)
LiquidityDaily (NYSE)DailyDaily
Main RiskHigh Premium to NAVSector VolatilityConcentration (40% Musk)
Ideal For…Pure access to unicornsLow fees and securityBetting on Elon Musk

This comparison table summarizes the key features of the three vehicles analyzed. While they all offer access to private tech giants, their structures and costs vary considerably.

If your priority is minimizing fees, XOVR is the most rational choice. If you are looking for a concentrated bet on Elon Musk’s vision, RONB is unbeatable. Finally, for maximum diversification among unicorns, DXYZ remains the gold standard, provided you monitor the premium to NAV.

Wyze Note: These funds are all tradable on U.S. exchanges (NYSE/NASDAQ). If you use a platform like Interactive Brokers, you can add them to your watchlist today using their respective tickers.


Risks and Precautions

Investing in private companies via listed funds is a unique opportunity, but it carries specific risks:

  • Premium to NAV: The main risk for funds like DXYZ. The market price can be much higher than the actual value of the assets. If you buy at a 50% premium, you are overpaying, exposing yourself to a brutal correction if hype fades.
  • Opaque Valuation: Unlike Apple or Nvidia, the value of SpaceX or OpenAI is estimated during funding rounds or on restricted secondary markets. There is a lag between the displayed fund value and market reality.
  • High Management Fees: Managing private assets requires complex expertise. Expense ratios are significantly higher than a classic S&P 500 index ETF.
  • IPO Failure: Success depends on a future exit (IPO). If a star company fails to go public or its valuation collapses during the listing, the fund will suffer a major loss.

FAQ: Everything about investing in SpaceX and OpenAI

Is SpaceX publicly traded in 2026?

No, SpaceX remains a private company. While rumors suggest an IPO for mid-2026, no official date is set. Currently, retail investors use funds like DXYZ or XOVR for indirect exposure.

How can a retail investor buy OpenAI shares?

You cannot buy OpenAI shares directly on platforms like Wealthsimple or Questrade yet. The simplest way for a retail investor is to buy Microsoft (MSFT) shares, which holds a major stake, or use specialized “Pre-IPO” funds like DXYZ.

Which ETF holds the most SpaceX stock?

In 2026, three vehicles stand out:

  1. XOVR: Holds about 21% of its assets in SpaceX via a Special Purpose Vehicle (SPV).
  2. RONB: Allocates between 14% and 22% to Musk’s company.
  3. DXYZ: Holds approximately 23% of the portfolio in SpaceX.

When will the OpenAI IPO happen?

According to 2026 reports, OpenAI is considering an IPO toward the fourth quarter of 2026 to fund massive AI infrastructure costs.


If you follow institutional flows in the Canadian ETF market, you know that a million-dollar inflow barely registers. A hundred-million-dollar inflow might earn a headline. But a $1.73 billion surge in a single month represents something far more structural — a repositioning of capital at scale.

Source: Fund Inflows Statistics – Tradingview as of February 12th, 2026

That is exactly what happened recently with the iShares 0–5 Year TIPS Bond Index ETF (CAD-Hedged), trading under ticker XSTH. The magnitude of this inflow is not random. It reflects institutional conviction about inflation risk, interest-rate direction, and portfolio defensiveness heading into 2026.

For income investors, this move is not just informative — it is actionable. Understanding why capital is flowing into short-duration inflation-protected bonds can help you better position your own portfolio for the evolving macro environment.


Part 1 — What Is XSTH? The “Safety-First” Inflation Hedge

XSTH provides exposure to U.S. Treasury Inflation-Protected Securities, commonly known as TIPS. Unlike traditional bonds that pay a fixed coupon on a static principal, TIPS adjust their principal value based on inflation, as measured by the Consumer Price Index (CPI).

When inflation rises, the principal value of the underlying bonds increases. Because coupon payments are calculated as a percentage of that principal, the income generated by the bond rises as well. At maturity, investors receive the fully inflation-adjusted principal, preserving real purchasing power.

What makes XSTH particularly defensive is its focus on short-term maturities — bonds with durations between zero and five years. This dramatically reduces interest-rate sensitivity. Long-term bonds can experience significant price declines when yields rise, but short-term TIPS are far more stable because they mature quickly and can be reinvested at new rates.

The ETF is also currency-hedged back to Canadian dollars. Since the underlying securities are denominated in U.S. dollars, hedging eliminates exchange-rate volatility for Canadian investors. This ensures returns reflect inflation protection and bond performance — not CAD/USD swings.


Part 2 — Decoding the $1.7 Billion Institutional Surge

Large inflows into niche fixed-income ETFs rarely occur without a macro catalyst. Pension funds, insurers, and sovereign allocators do not deploy billions tactically — they reposition strategically.

The $1.73 billion surge into XSTH signals that institutional investors are increasingly concerned about persistent — not transitory — inflation.

Several macro forces are converging in early 2026.

Global trade tensions and tariff risks are resurfacing, particularly across industrial supply chains and energy markets. Commodity volatility remains elevated, with oil and natural gas prices reacting to geopolitical instability. At the same time, fiscal spending across developed economies continues to run above historical norms, supporting demand-side inflation pressures.

In this environment, institutional capital is seeking protection — not just yield. TIPS provide what nominal bonds cannot: contractual inflation adjustment backed by the U.S. Treasury.

There is also a liquidity dimension. When billions enter a fixed-income ETF, secondary-market liquidity deepens. Bid-ask spreads tighten, and execution efficiency improves. For retail investors, that institutional participation effectively creates a liquidity floor, making the ETF easier to trade even during volatile markets.


Part 3 — The Income Investor’s Perspective: Yield and Cash Flow Stability

From an income standpoint, XSTH plays a different role than high-yield dividend ETFs or covered-call strategies.

Its yield is composed of two components: the real yield embedded in TIPS and the inflation adjustment to principal. As inflation rises, distributions can increase because the underlying bond principal rises. This creates a dynamic income stream that adjusts to macro conditions rather than remaining fixed.

Distributions are paid monthly, making the ETF operationally compatible with income portfolios structured around regular cash flow.

However, the purpose of XSTH is not yield maximization — it is yield stabilization. High-yield equities may offer 6% to 10% distributions, but those payouts are tied to market risk. If equities correct, capital losses can overwhelm income.

XSTH, by contrast, provides lower but more resilient income, backed by government securities and inflation indexing. It acts as a ballast rather than a growth engine.


Part 4 — Why 2026 Is the Year of the “TIPS Hedge”

As of early 2026, monetary policy sits at an inflection point. Central banks, including the Bank of Canada and the Federal Reserve, have paused aggressive tightening, but inflation has not fully normalized to target levels.

Markets are now navigating three simultaneous risks.

The first is tariff-driven inflation. Trade restrictions increase import costs, feeding directly into CPI. TIPS automatically adjust to this environment, whereas nominal bonds lose purchasing power.

The second is equity volatility. Dividend stocks, REITs, and utilities — staples of income portfolios — remain sensitive to interest-rate expectations and recession fears. During risk-off events, capital often rotates into government securities, benefiting TIPS.

The third is the yield-chasing trap. Many investors pursue double-digit yields through covered-call ETFs or leveraged income funds. While attractive on paper, these strategies can suffer capital erosion during drawdowns. Inflation-protected bonds provide a defensive counterweight, preserving portfolio stability.


Portfolio Integration: How XSTH Fits in an Income Strategy

If your portfolio were a house, your dividend stocks and high-yield funds would be the engine that generates power. XSTH is the foundation. It doesn’t move much, but it keeps the whole house from sinking.

Here are four simple ways to use XSTH to protect and grow your wealth:

1. Better Than a Standard Savings Account: Most people keep “safe money” in a savings account. However, if inflation is 4% and your bank pays you 3%, you are actually losing money every year in terms of what you can buy.

  • The XSTH Edge: Because it’s a TIPS fund (Treasury Inflation-Protected Securities), it is designed to grow its value specifically when the cost of living goes up. It’s “inflation-proof” cash.

2. The “Zing” Protector for Income Investors

Many popular “income” ETFs (like those that pay 8% or 10% dividends) can be very volatile. Their prices often drop when the stock market gets nervous.

  • The XSTH Edge: XSTH rarely moves in the same direction as the stock market. Adding a “slice” of XSTH to your portfolio acts like a shock absorber in a car—it smooths out the bumps so you don’t panic-sell when the market gets rocky.

3. Protecting Your “Buying Power”

Inflation is the “hidden tax” that makes groceries, gas, and rent more expensive. If you are retired or living off your investments, a sudden spike in prices is your biggest enemy.

  • The XSTH Edge: XSTH is one of the few investments that has a “contractual” link to inflation. When the government’s inflation numbers go up, the value of the bonds inside XSTH is adjusted upward. It’s like a built-in raise for your savings.

4. Your “Dry Powder” for Sales

When the stock market crashes, the best thing to have is “dry powder”—cash that hasn’t lost its value—so you can buy great stocks at a discount.

  • The XSTH Edge: Because XSTH is made of short-term government bonds, it is very liquid and stable. While other people are watching their portfolios drop 20%, your XSTH slice should remain steady, giving you the funds (and the confidence) to buy the dip.

Costs, Efficiency, and Structural Advantages

One of the most compelling aspects of XSTH is cost efficiency. With a management expense ratio near 0.10%, it represents one of the lowest-cost inflation-protected vehicles available to Canadian investors.

The ETF structure also provides daily liquidity, transparent pricing, and automatic reinvestment of inflation adjustments — advantages not easily replicated through direct bond purchases.

For retail investors, accessing a laddered portfolio of short-term U.S. TIPS with currency hedging would be operationally complex. XSTH packages that exposure into a single, tradeable instrument.


Risks and Considerations

Despite its defensive profile, XSTH is not risk-free.

If inflation declines faster than expected, TIPS breakeven rates compress, reducing relative performance. In disinflationary environments, nominal bonds may outperform inflation-protected securities.

Currency hedging, while stabilizing returns, introduces hedging costs that can marginally reduce yield. Additionally, because duration is short, capital appreciation potential is limited compared to long-duration bonds during rate cuts.

Investors should therefore view XSTH as protection — not performance leverage.


The Bottom Line

The $1.7 billion inflow into XSTH is not noise. It is a signal that institutional investors are repricing inflation risk and reinforcing portfolio defenses.

In an era where protecting purchasing power is as critical as generating income, short-term TIPS provide a rare combination of government credit quality, inflation adjustment, and low duration risk.

For Canadian income investors, XSTH offers monthly distributions, currency-hedged exposure, and structural resilience against macro shocks — all at a minimal cost.

Following “smart money” does not mean copying trades blindly. It means understanding the macro thesis behind capital flows.

Right now, that thesis is clear: inflation may be moderating, but the world’s largest investors are still buying insurance.

And XSTH is one of the most direct ways to own it.

When markets turn volatile, most investors instinctively ask the same question: “Where can I invest without constantly worrying about my portfolio?”

The answer is rarely found in speculative growth stocks or high-yield names with fragile balance sheets. Instead, it lies with defensive dividend aristocrats — companies that have proven, over decades, their ability to generate cash, protect dividends, and survive multiple economic cycles. In this article, we focus on Canadian Dividend Aristocrats that combine:

  • essential businesses,
  • resilient cash flows,
  • and a long track record of dividend increases.

These are not stocks designed to “beat the market” every year. They are stocks designed to protect income, reduce volatility, and compound steadily — exactly what many investors want in uncertain environments.


What Makes a Dividend Stock “Defensive”?

A defensive dividend stock typically shares several characteristics:

  1. Essential services
    Utilities, food, infrastructure, insurance — businesses people rely on regardless of economic conditions.
  2. Predictable cash flows
    Revenues are often regulated, contracted, or recurring.
  3. Strong balance sheets
    Conservative leverage and access to capital.
  4. Dividend discipline
    Long histories of dividend payments and increases, even during recessions.

Dividend Aristocrats take this one step further: they have consistently raised their dividends for many years, demonstrating management discipline and business resilience.


Why Defensive Dividend Aristocrats Matter Right Now

Periods of higher interest rates, slower growth, or market uncertainty tend to expose weak business models. Defensive dividend aristocrats, on the other hand, tend to:

  • fall less during market corrections,
  • recover faster after downturns,
  • and continue paying (and often increasing) dividends when others cut.

They form the core of many long-term Canadian portfolios.


Executive summary

CompanyDefensive StrengthDividend Profile
Fortis (FTS)
Utilities
Regulated electric & gas assets; highly predictable earnings50+ years dividend growth; steady increases
Canadian Utilities (CU)
Utilities
Majority regulated / contracted cash flows35+ years dividend increases; stable high yield
Enbridge (ENB)
Energy Infrastructure
Toll-road pipeline model; contracted revenuesHigh yield; consistent dividend growth
Metro (MRU)
Consumer Staples
Essential grocery & pharmacy spendingLower yield; strong dividend growth rate
Loblaw (L)
Consumer Staples
National food & drug retail dominanceLow yield; growth + share buybacks
Hydro One (H)
Utilities
Monopoly-like transmission network; regulated returnsModerate yield; steady dividend growth
Intact Financial (IFC)
Insurance
Pricing power; diversified P&C insurance20+ years dividend growth; low payout ratio

1.    Fortis (FTS)

Sector: Utilities

Fortis is one of the most reliable income stocks available to Canadian investors. It represents the very definition of a defensive dividend aristocrat, designed not to chase rapid growth, but to deliver steady, predictable cash flow through all market cycles.

The company owns and operates regulated electric and gas utilities across Canada, the United States, and the Caribbean. Because roughly 99% of Fortis’ assets are regulated, its earnings are largely insulated from economic slowdowns, commodity price swings, and market volatility. Rates are set by regulators, providing visibility and stability that few sectors can match.

Fortis has increased its dividend for more than 50 consecutive years, placing it among a small and elite group of North American dividend aristocrats. Today, the stock offers a forward dividend yield of approximately 3.5%, supported by a conservative payout ratio near 70% and a clear policy of annual dividend growth.

What makes Fortis especially attractive for income investors is the predictability of its growth. Management has laid out a multi-year capital investment plan exceeding $25 billion, which expands its regulated rate base and supports dividend growth of 4%–6% annually. This growth is often linked to inflation, helping protect purchasing power over time.

Why Fortis fits an income portfolio

  • Regulated utilities = highly predictable earnings
  • Inflation-linked revenue adjustments
  • Conservative payout ratio and strong balance sheet
  • Decades-long dividend growth track record

Fortis will not make investors rich overnight — but for those seeking durable income, capital preservation, and peace of mind, it remains one of the strongest defensive anchors in a long-term income portfolio.


2. Canadian Utilities (CU)

Sector: Utilities

Canadian Utilities is one of the most conservative and income-oriented stocks in the Canadian market. For investors whose primary objective is reliable, long-term dividend income, CU stands as a true cornerstone holding.

The company holds one of the longest dividend growth streaks in Canada, with 36 consecutive years of dividend increases. This track record reflects a deeply embedded culture of capital discipline, risk management, and shareholder income prioritization. Canadian Utilities operates across electricity generation, transmission, and natural gas distribution, with the vast majority of its assets either regulated or backed by long-term contracts.

From an income sustainability perspective, CU is particularly attractive. The stock currently offers a forward dividend yield of approximately 4.2%, supported by a conservative payout ratio near 55%. This leaves ample room to absorb higher interest costs, regulatory delays, or economic slowdowns without putting the dividend at risk.

Unlike higher-growth utilities, Canadian Utilities emphasizes capital preservation over expansion. Dividend growth has historically been modest — around 1% annually over the past five years — but this slower growth comes with exceptional stability. For retirees and income investors, predictability often matters more than acceleration.

Another key strength is parent support from the ATCO Group, which provides financial flexibility, operational expertise, and strategic stability during challenging periods.

Why Canadian Utilities fits an income portfolio

  • Extremely long dividend growth history
  • High proportion of regulated and contracted earnings
  • Conservative payout ratio and balance sheet
  • Strong sponsorship from ATCO

Canadian Utilities is not designed to maximize total return. Instead, it excels at delivering what income investors value most: consistency, durability, and peace of mind.


3. Enbridge (ENB)

Sector: Energy Infrastructure (Midstream)

Enbridge is often misunderstood because it sits in the energy sector, but it is not a commodity producer. It does not drill for oil or gas, nor does its cash flow depend directly on energy prices. Instead, Enbridge operates critical energy infrastructure — pipelines, storage, and utility assets — that function much like toll roads.

The vast majority of Enbridge’s earnings are generated from long-term, take-or-pay contracts, meaning customers pay regardless of short-term fluctuations in commodity prices. This structure provides high visibility and predictability of cash flows, which is why Enbridge behaves far more like an infrastructure or utility company than a cyclical energy stock.

For income investors, Enbridge’s appeal is clear. The stock currently offers a forward dividend yield near 6%, one of the highest among large, established Canadian dividend payers. Enbridge has increased its dividend for 12 consecutive years, supported by stable distributable cash flow and regulated utility operations in addition to its pipeline network.

That said, Enbridge is best viewed as high-income, moderate-risk infrastructure. Its payout ratio is elevated, and the company carries meaningful debt, which makes it more sensitive to interest rates than utilities like Fortis or Canadian Utilities. However, management has shifted toward balance-sheet repair, asset sales, and capital discipline, reducing risk over time.

Why Enbridge fits an income portfolio

  • Contracted, infrastructure-like cash flows
  • Strong earnings visibility
  • Attractive, above-average dividend yield
  • Long history of dividend growth

Enbridge offers something rare in the Canadian market: high current income combined with infrastructure stability. For investors willing to accept moderate financial risk in exchange for a generous and reliable payout, ENB can serve as a powerful income engine within a diversified dividend portfolio.


4. Metro (MRU)

Sector: Consumer Staples

Metro is one of Canada’s highest-quality defensive consumer staples companies, operating in a sector that remains resilient regardless of economic conditions. Food and pharmacy spending is non-discretionary — consumers may cut back on travel or entertainment, but they continue to buy groceries and essential medications. This makes Metro’s business model inherently defensive.

The company operates a large network of grocery stores and pharmacies across Canada, supported by strong private-label brands that enhance margins and pricing power. These private labels not only protect profitability during inflationary periods, but also help stabilize cash flow when consumer budgets are under pressure.

From an income perspective, Metro is not a high-yield stock. Its forward dividend yield is approximately 1.8%, which may appear modest at first glance. However, what Metro lacks in yield, it more than compensates for with exceptional dividend growth and sustainability. The company has increased its dividend for 25 consecutive years, supported by a very low payout ratio near 30%. This conservative payout leaves ample room for continued dividend increases, even during economic slowdowns.

Over the past five years, Metro’s dividend has grown at an impressive double-digit annual rate, reflecting strong earnings growth, disciplined capital allocation, and consistent free cash flow generation. This makes MRU an attractive option for investors who want income that grows faster than inflation over time.

Why Metro fits a defensive income portfolio

  • Essential consumer spending exposure
  • Strong margins driven by private-label products
  • Consistent free cash flow generation
  • Long dividend growth track record with low payout ratio

Metro may not deliver high immediate income, but for investors seeking defensive stability, rising dividends, and long-term compounding, it is one of the best consumer staples holdings in Canada.


5. Loblaw Companies (L)

Sector: Consumer Staples

Loblaw Companies is Canada’s largest food and pharmacy retailer, operating an unmatched national network that includes Loblaws, No Frills, Shoppers Drug Mart, Real Canadian Superstore, and several private-label brands. This scale gives Loblaw a structural advantage in purchasing power, pricing flexibility, and cost efficiency — all critical in a defensive investment.

Like Metro, Loblaw benefits from non-discretionary consumer spending. Regardless of economic conditions, consumers continue to buy groceries and essential healthcare products. This makes Loblaw’s revenue base highly resilient, even during recessions or periods of elevated inflation.

From an income perspective, Loblaw is not designed to maximize yield. Its forward dividend yield is under 1%, but this low yield is paired with an exceptionally conservative payout ratio of roughly 17%. This gives the company significant flexibility to continue increasing dividends while also aggressively returning capital through share buybacks.

Dividend growth has been strong and consistent, with a double-digit five-year growth rate, supported by robust free cash flow and disciplined capital allocation. Buybacks play a key role in Loblaw’s shareholder return strategy, reducing share count and enhancing per-share earnings and dividend growth over time.

Another important defensive advantage is Loblaw’s ability to pass inflation through pricing. Its private-label offerings and scale allow it to protect margins even when input costs rise, helping stabilize cash flow.

Why Loblaw fits a defensive income portfolio

  • Essential exposure to food and healthcare
  • Strong free cash flow generation
  • Very low payout ratio with room for dividend growth
  • Dividend growth enhanced by consistent buybacks

Loblaw may not appeal to investors seeking immediate income, but for those focused on defensive growth, rising dividends, and long-term capital preservation, it is one of the strongest consumer staples holdings in Canada.


6. Hydro One (H)

Sector: Utilities

Hydro One operates Ontario’s electricity transmission and distribution network, making it one of the most stable and predictable businesses in the Canadian market. As a near-monopoly provider of an essential service, Hydro One benefits from demand that is virtually immune to economic cycles. Homes and businesses need electricity regardless of inflation, recession, or market volatility.

The company’s earnings are largely governed by regulatory frameworks that set allowed returns on invested capital. While this regulation caps upside potential, it also significantly limits downside risk — a trade-off that is highly attractive for defensive income investors. Hydro One’s cash flows are steady, visible, and supported by long-term infrastructure assets with extremely long useful lives.

From an income perspective, Hydro One offers a forward dividend yield of roughly 2.5%, supported by a moderate payout ratio near 60%. The dividend has grown consistently, with an average annual growth rate in the mid-single digits over the past five years. This balance between current income and steady growth makes Hydro One suitable for investors seeking reliability rather than high yield.

Another important strength is Hydro One’s low earnings volatility. Because revenues are decoupled from commodity prices and consumer spending patterns, the company provides a stabilizing effect during market drawdowns. This makes it a valuable complement to higher-yield or more cyclical income holdings.

Why Hydro One fits a defensive income portfolio

  • Monopoly-like electricity transmission assets
  • Highly regulated and predictable returns
  • Low earnings and cash-flow volatility
  • Stable, steadily growing dividend

Hydro One may not generate excitement, but that is precisely its strength. For investors focused on capital preservation, dependable income, and portfolio stability, Hydro One plays a quiet yet critical role as a defensive anchor.


7. Intact Financial (IFC)

Sector: Financials (Property & Casualty Insurance)

Intact Financial offers a differentiated way to gain exposure to the financial sector while maintaining a defensive income profile. Unlike banks, whose earnings are heavily influenced by credit cycles and interest rate fluctuations, insurance companies tend to benefit from inflation and rising premiums. This makes Intact particularly attractive during periods of elevated costs and economic uncertainty.

As Canada’s largest property and casualty insurer, Intact operates a diversified insurance platform across auto, home, and commercial lines, both in Canada and internationally. The company has demonstrated exceptional underwriting discipline, consistently maintaining strong combined ratios that reflect profitable insurance operations rather than reliance on investment income alone.

From an income standpoint, Intact offers a forward dividend yield of just over 2%, supported by a very conservative payout ratio below 30%. This low payout provides substantial flexibility for continued dividend growth, even during periods of elevated claims or economic stress. Intact has increased its dividend for 20 consecutive years, with a near double-digit five-year growth rate, highlighting management’s long-term commitment to shareholder returns.

Another defensive advantage lies in Intact’s pricing power. Insurance premiums can be adjusted annually, allowing the company to pass higher costs onto policyholders over time. This dynamic helps protect margins and cash flow in inflationary environments, unlike many other financial institutions.

Why Intact fits a defensive income portfolio

  • Pricing power through premium adjustments
  • Diversified insurance operations across regions and lines
  • Strong underwriting and disciplined risk management
  • Long, consistent dividend growth record

Intact Financial combines defensive earnings, growing income, and inflation resilience. For investors seeking exposure to financials without the volatility associated with banks, IFC represents one of the strongest long-term income and stability plays in the Canadian market.


How to Use Defensive Dividend Aristocrats in a Portfolio

Defensive dividend aristocrats are best used as core holdings, not short-term trades.

Portfolio roles

  • Income stability
  • Volatility reduction
  • Capital preservation
  • Long-term compounding

A common approach is to combine:

  • utilities,
  • consumer staples,
  • infrastructure,
  • and insurance

This diversification reduces reliance on any single economic factor.


Best Accounts for Defensive Dividend Aristocrats

Choosing the right account can enhance the tax efficiency of defensive Dividend Aristocrats.

The TFSA is particularly well suited for dividend growth stocks. All income and capital gains generated inside the account are tax-free, making it an effective vehicle for investors seeking reliable, inflation-resilient cash flow without increasing their taxable income.

The RRSP can also be appropriate, especially for long-term compounding. While withdrawals are taxed, the upfront tax deduction and tax-deferred growth can be advantageous for investors still in higher tax brackets or planning structured retirement withdrawals.

A non-registered account remains a viable option as well. Eligible Canadian dividends benefit from the dividend tax credit, which reduces the effective tax rate compared to interest income.

Because Defensive Dividend Aristocrats primarily pay eligible Canadian dividends, they are generally considered tax-efficient holdings for Canadian investors across multiple account types.


Final Thoughts

Defensive dividend aristocrats are not designed to excite headlines or chase momentum. Their strength lies in discipline, consistency, and durability.

In uncertain markets, these companies allow investors to:

  • stay invested,
  • sleep better at night,
  • and continue compounding wealth without unnecessary risk.

For Canadian investors seeking stability without abandoning growth entirely, defensive dividend aristocrats remain one of the most reliable strategies available.

At first glance, DGS (Dividend Growth Split Corp.) looks like a powerful income vehicle. It offers high monthly distributions, exposure to well-known Canadian dividend growth companies, and a long operating history.

However, DGS is not a traditional ETF, and it does not behave like one. It is a split share corporation, a structure that can enhance income and returns in favorable markets—but also introduces unique risks that investors must understand before allocating capital.

This article explains how DGS works, where its income really comes from, and the key risks embedded in the structure, so investors can evaluate whether it fits their portfolio objectives. DGS is issued and managed by Brompton Funds, a Canadian firm specializing in income-oriented products, particularly split-share corporations.


1. What Is DGS?

DGS is a split share fund that holds a diversified portfolio of large-cap Canadian dividend growth stocks. Instead of issuing a single class of units like a standard ETF, it issues two separate securities:

  • Preferred Shares (DGS.PR.A)
    Designed to provide relatively stable income and capital priority.
  • Class A Shares (DGS)
    Designed to provide higher income and potential capital appreciation.

Each “unit” of the fund consists of:

  • 1 Preferred share
  • 1 Class A share

This structure creates embedded leverage for the Class A shares.


2. What Does DGS Invest In?

DGS holds a portfolio of established Canadian dividend-paying companies, primarily large-cap issuers with a history of earnings growth and cash-flow generation.

The portfolio includes:

  • Major Canadian banks and insurers
  • Infrastructure and utilities
  • Consumer staples and defensive growth companies
  • Select resource and industrial names

This is not a speculative portfolio. The underlying assets are fundamentally strong businesses commonly found in dividend growth and quality-focused strategies.


3. How the Split Share Structure Works

The defining feature of DGS is capital prioritization:

  1. Preferred shareholders are paid first
    They have priority on dividends and on capital at maturity.
  2. Class A shareholders receive what remains
    Income and capital gains accrue only after preferred obligations are met.

As a result:

  • Class A shares benefit from leveraged exposure to the underlying portfolio
  • Returns are magnified in rising markets
  • Losses are magnified in declining markets

This leverage is structural, not optional.


4. Where Do Class A Distributions Come From?

Class A distributions are monthly and are primarily return of capital (ROC).

This means distributions may be funded by:

  • Dividends received from portfolio holdings
  • Capital gains
  • Portfolio cash flow
  • A return of investors’ original capital

Return of capital is not inherently negative, but it has two important implications:

  • It reduces the fund’s net asset value (NAV) if not offset by asset appreciation
  • It lowers the investor’s adjusted cost base (ACB) in taxable accounts

Income investors should focus on NAV sustainability, not just headline yield.


5. The Most Important Risk: Distribution Suspension

The single most important risk for investors in Class A shares (DGS) is the risk of distribution suspension. This risk is structural and embedded in how split share funds are designed.

How the rule works

Class A distributions are not guaranteed. They are paid only if two conditions are met:

  1. Preferred shareholders are fully paid first
    If preferred share distributions (DGS.PR.A) are in arrears, Class A receives nothing.
  2. NAV coverage test is respected
    After paying the Class A distribution, the Net Asset Value per unit must remain above a predefined minimum level.
    If paying income would push NAV below that threshold, the distribution is automatically suspended.

This is not a discretionary decision by the manager—it is a hard rule written into the fund’s structure.

What this means in real markets

During sharp or prolonged market declines:

  • Class A distributions can stop entirely
  • The Class A share price often falls faster than the underlying stocks because leverage works in reverse
  • Income-focused investors may experience months (or longer) with zero cash flow

Meanwhile, preferred shares continue to receive priority payments as long as coverage allows.

Why this matters

Many investors focus on the headline yield of Class A shares without fully appreciating that:

  • The income is conditional
  • The leverage is structural and permanent
  • Income risk increases precisely when markets are under stress

Understanding this risk is essential before using DGS Class A as an income replacement rather than a tactical or satellite position in a portfolio.


6. Leverage Risk and Market Drawdowns

Because Class A shares are effectively leveraged:

  • Gains are amplified in rising markets
  • Drawdowns are deeper during market stress

A moderate decline in the portfolio can translate into a disproportionate decline in Class A NAV. This makes DGS unsuitable for investors who require stable income in all market environments.


7. Interest Rate Sensitivity

Although DGS holds equities, it is indirectly sensitive to interest rates:

  • Preferred shares are rate-sensitive instruments
  • Rising interest rates can pressure preferred valuations
  • That pressure flows through to Class A NAV

This means DGS can underperform during periods of rising rates even if equity markets are stable.


8. Term and Extension Risk

DGS has a stated maturity date, after which:

  • The fund may be terminated, or
  • The term may be extended by the board

At maturity or extension:

  • Dividend terms may change
  • Market prices may diverge from NAV
  • Investors face reinvestment risk

This makes DGS less predictable than perpetual ETFs.


9. Is DGS “Safe”?

DGS is not a low-risk product, but it is also not inherently flawed.

It may be suitable for:

  • Experienced income investors
  • Portfolios that can tolerate income variability
  • Tactical allocations during stable or rising equity markets

It is not suitable as:

  • A bond substitute
  • A guaranteed income vehicle
  • A core retirement holding requiring steady cash flow

Historical performance


Source: Brompton Funds site

Preferred Shares: Stable, Bond-Like Returns

The Preferred series shows very consistent returns, generally in the 5.4%–6.9% range year after year.
This reflects its senior, quasi-fixed-income nature:

  • Fixed distribution paid first (~6%)
  • Priority claim on assets
  • Low volatility
  • Limited participation in portfolio upside

👉 Preferred shareholders are buying income stability, not growth.


Class A: Residual + Embedded Leverage

The Class A returns are dramatically higher—but also far more volatile:

  • 1-Year: 37.6%
  • 5-Year: 32.7%
  • 10-Year: 19.1%
  • Individual years range from +92% to −41%

This happens because Class A:

  • Receives only what remains after the Preferred distribution is paid
  • Absorbs all upside and downside beyond the Preferred claim
  • Has structural leverage built into it

In practical terms:

The Preferred distribution acts like a fixed financing cost, and Class A is the equity layer above it.

When markets are strong, this structure amplifies returns.
When markets are weak, losses are magnified.

10. How DGS Fits in a Portfolio

DGS should be viewed as a satellite income position, not a core holding. Its split-share structure introduces structural leverage and conditional distributions, which can enhance income in favorable markets but increase downside risk during periods of stress. For this reason, position sizing is critical.

A prudent approach is to limit exposure and integrate DGS alongside more stable income assets. It pairs best with traditional dividend ETFs, which provide diversified, unlevered exposure to dividend-paying companies, as well as utilities or infrastructure investments that offer regulated, predictable cash flows. Adding bonds or cash equivalents can further stabilize the portfolio and provide liquidity during market drawdowns, when DGS distributions may be suspended.

Importantly, investors should focus less on headline yield and more on NAV trends. A declining NAV can signal rising risk to Class A distributions, regardless of current payout levels. In practice, DGS works best as an opportunistic income enhancer within a diversified, risk-aware portfolio—not as a primary income foundation.

Summary:

  • Treat DGS as a satellite income position
  • Limit position size
  • Combine with:
    • Traditional dividend ETFs
    • Utilities or infrastructure
    • Bonds or cash equivalents

Monitoring NAV trends is more important than monitoring yield alone.


Final Thoughts

DGS can be a powerful income tool when used correctly. Its appeal lies in its ability to convert a high-quality dividend growth portfolio into enhanced income through structural leverage.

However, that same structure introduces:

  • Income interruption risk
  • Amplified volatility
  • Sensitivity to market cycles and interest rates

The key question for investors is not:

“Is the yield attractive?”

But rather:

“Can I tolerate leveraged drawdowns and suspended income during market stress?”

Answering that honestly is essential before investing in DGS