If you search “best Canadian dividend ETF,” every list you find ranks funds by yield and calls it a day.
That approach has quietly cost Canadian investors thousands of dollars — in missed returns, hidden fees, and dividend cuts they never saw coming.
Here is the truth: the ETF with the highest yield is often the worst choice for your portfolio. And in 2026, with market volatility rising, US stocks losing momentum, and the TSX outperforming the S&P 500 for the second consecutive year, knowing the difference between a strong dividend ETF and a yield trap has never mattered more.
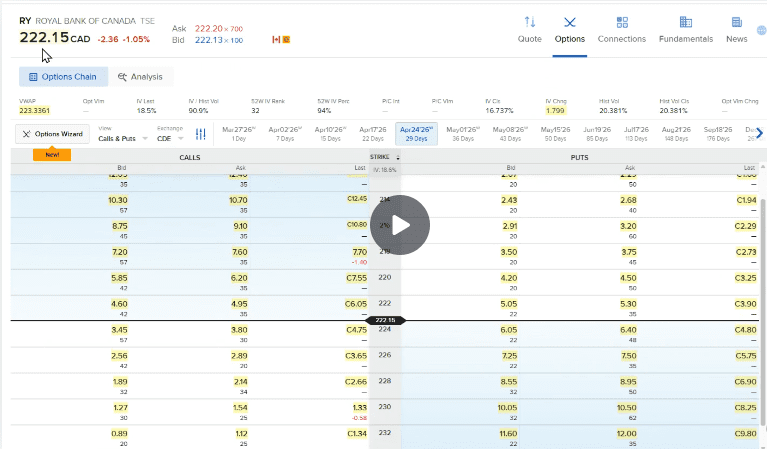
In this article, I rank the best Canadian dividend ETFs for 2026 using real April 2026 market data — covering yield, MER, assets under management, and index strategy. I also break down covered call ETFs separately, because comparing them to traditional dividend funds by yield alone is one of the most common mistakes Canadian DIY investors make.
By the end, you will know exactly which ETF fits your income goal — and how to build a complete passive income portfolio around it.
Why 2026 Is a Turning Point for Canadian Income Investors
A shift is happening that most investors are not fully appreciating yet.
For years, US growth stocks dominated. Investors poured money into the S&P 500 and watched tech stocks compound. Canadian dividend ETFs looked boring by comparison.
That narrative is changing fast.
The TSX outperformed the S&P 500 by more than 10 percentage points in 2025. Geopolitical uncertainty, US tariff risk, and elevated volatility are pushing investors away from pure capital gains strategies and toward income and stability. The Bank of Canada has cut rates, which historically benefits dividend-paying sectors like utilities, pipelines, and financials — the backbone of every Canadian dividend ETF.
Canadian dividend ETFs are not just a conservative fallback in 2026. For many investors, they are the right primary strategy.
The question is not whether to own one. The question is which one — and that answer is not as obvious as most articles suggest.
The #1 Mistake Investors Make When Choosing a Dividend ETF
Before the rankings, you need to understand one thing clearly.
A 10% yield and a 3.5% yield are not the same type of number. They come from completely different strategies with completely different risk profiles.
Look at the current data:
- HHIS (Harvest Diversified High Income Shares ETF): 27.56% yield
- UMAX (Hamilton Utilities YIELD MAXIMIZER): 14.63% yield
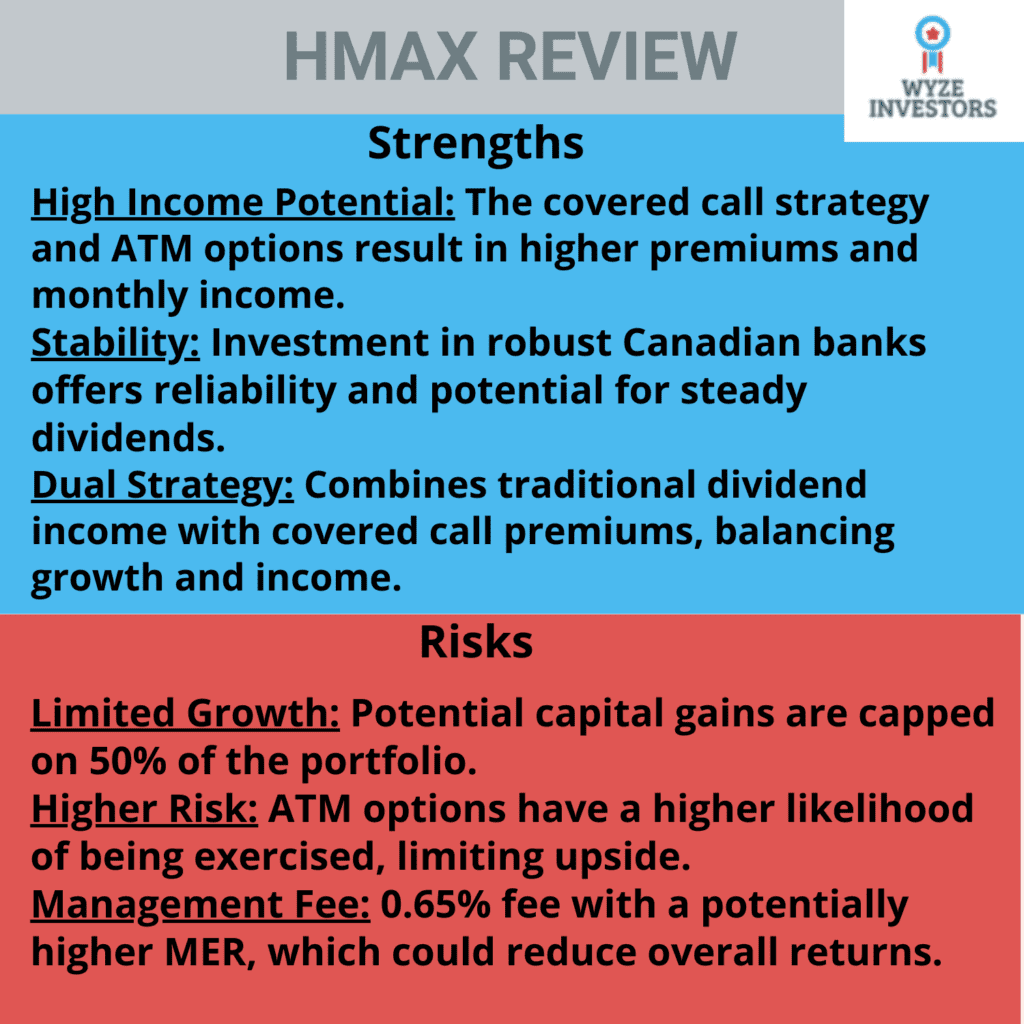
- HMAX (Hamilton Canadian Financials YIELD MAXIMIZER): 11.81% yield
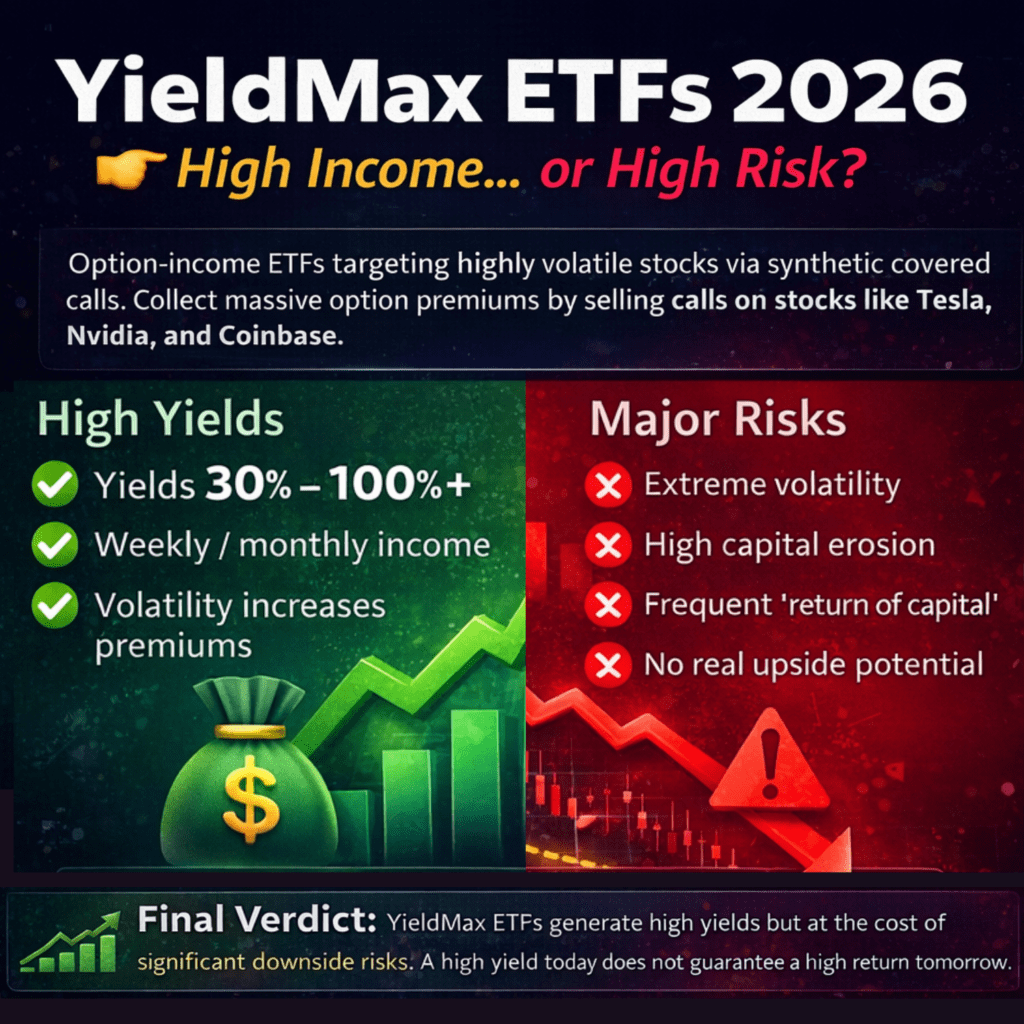
None of these are traditional dividend ETFs. They are covered call ETFs — funds that sell options on their holdings to generate elevated distributions, trading away upside potential in exchange for higher monthly income.
That is a legitimate strategy. But it is a fundamentally different product than VDY or XEI, and ranking them together by yield is like comparing a GIC to a leveraged fund.
This article separates both categories clearly, because that distinction will determine whether your income portfolio performs — or disappoints.
The Best Canadian Dividend ETFs for 2026: Pure Dividend Category
These funds hold Canadian dividend-paying stocks and pass through the income those companies generate. No options, no leverage. Transparent, tax-efficient, and predictable.
VDY — Vanguard FTSE Canadian High Dividend Yield Index ETF
| Metric | Data |
|---|---|
| Price | $68.80 CAD |
| AUM | $7.13B |
| MER | 0.23% |
| Yield | 3.12% |
| Recent Flows | +$870M |
VDY is Canada’s largest dividend ETF and the default choice for income investors who want simplicity. It tracks the FTSE Canada High Dividend Yield Index using market-cap weighting, concentrating naturally in Canada’s biggest dividend payers: the major banks, Enbridge, and Canadian Natural Resources.
The $7.13 billion in assets and +$870 million in recent inflows confirm this remains the most trusted dividend ETF in Canada. The 0.23% MER is competitive, and the market-cap weighting approach keeps the portfolio aligned with Canada’s strongest businesses.
The honest limitation: VDY allocates over 55% to financials. Owning VDY means making a significant bet on Canadian banks — a bet that has paid off historically, but concentration risk is real.
Best for: Investors who want the simplest, most liquid exposure to Canada’s largest dividend payers at a competitive cost.
XDIV — iShares Core MSCI Canadian Quality Dividend Index ETF
| Metric | Data |
|---|---|
| Price | $40.42 CAD |
| AUM | $4.71B |
| MER | 0.12% |
| Yield | 3.50% |
| Recent Flows | +$591M |
XDIV is the most underrated dividend ETF in Canada, and the one I recommend most often to investors who ask where to start.
At 0.12% MER, it is the cheapest dividend ETF available in Canada — less than half the cost of VDY and roughly one-fifth the cost of CDZ. On a $300,000 portfolio, that cost difference compounds into tens of thousands of dollars over a 20-year horizon.
What makes XDIV different is the quality screen built into its methodology. MSCI filters holdings using return on equity, earnings stability, and debt-to-equity ratios before selecting for yield. That screen systematically avoids companies paying a large dividend while carrying an unsustainable balance sheet — the exact pattern that led to BCE’s 56% dividend cut in 2025.
You get comparable quality exposure to VDY at roughly half the cost. The +$591 million in recent inflows shows institutional and retail investors are discovering this fund.
Best for: Cost-conscious investors who want quality-filtered dividend income. The strongest risk-adjusted option in the passive category.
XEI — iShares S&P/TSX Composite High Dividend Index ETF
| Metric | Data |
|---|---|
| Price | $36.67 CAD |
| AUM | $3.70B |
| MER | 0.23% |
| Yield | 3.88% |
| Recent Flows | +$435M |
XEI offers the highest yield among pure passive Canadian dividend ETFs at 3.88%, with broader sector exposure than VDY — approximately 33% energy and 29% financials as of April 2026.
The trade-off is real: a yield-first selection process with no quality filter means XEI can and does hold companies whose high yield reflects financial stress rather than strength. The +$435 million in recent inflows confirms strong investor appetite, and the 0.23% MER matches VDY’s cost.
XEI selects for current yield within the TSX Composite with no growth or quality screen. Investors who choose XEI are prioritizing monthly cash flow over dividend safety — a conscious trade-off worth understanding before buying.
Best for: Income-focused investors who want monthly cash flow and broader sector exposure than VDY, and who consciously accept the energy sector tilt and yield-trap risk.
CDZ — iShares S&P/TSX Canadian Dividend Aristocrats Index ETF
| Metric | Data |
|---|---|
| Price | $43.53 CAD |
| AUM | $1.16B |
| MER | 0.67% |
| Yield | 3.28% |
| Recent Flows | -$7.63M |
CDZ applies the most rigorous quality filter on this list: every holding must have increased its dividend for at least five consecutive years. A company cannot maintain five consecutive years of dividend growth while its balance sheet deteriorates — making this the most disciplined passive approach to dividend safety available in Canada.
The problem is the cost. At 0.67% MER, CDZ is nearly six times more expensive than XDIV. The fund is seeing outflows of -$7.63M recently, suggesting investors are questioning whether the premium fee is justified.
The Dividend Aristocrats methodology is sound. The price is not justified by the results.
Best for: Long-term investors who specifically value dividend growth discipline and accept a premium fee for that philosophy.
The Best Covered Call ETFs for Canadian Income in 2026
Covered call ETFs generate elevated income by selling call options on their holdings. The trade-off is straightforward: higher monthly cash flow today, limited participation in bull markets.
In 2026’s environment — tariff uncertainty, muted growth forecasts, elevated volatility — this trade-off is more attractive than it has been in years. Covered call strategies perform best in flat or volatile markets, and that describes 2026 precisely.
ZWB — BMO Covered Call Canadian Banks ETF
| Metric | Data |
|---|---|
| Price | $27.43 CAD |
| AUM | $4.12B |
| MER | 0.83% |
| Yield | 5.03% |
| Recent Flows | +$17.52M |
ZWB is the benchmark covered call ETF in Canada. It holds the Big Six banks and sells covered call options on those positions, delivering a 5.03% yield versus the roughly 3% you would receive owning the banks passively through VDY.
Canadian banks as underlying holdings combined with options premium income have made ZWB one of the most consistent covered call products in Canada. With $4.12 billion in assets, this is a mainstream product with strong institutional adoption.
The MER of 0.83% is higher than passive alternatives, which is expected given the active options management involved. The trade-off is legitimate: approximately 2 percentage points more annual income than VDY in exchange for capped upside on bank stocks.
Best for: Investors who want meaningful income from Canadian bank exposure and are comfortable with limited upside participation during strong bank stock rallies.
ZWC — BMO Canadian High Dividend Covered Call ETF
| Metric | Data |
|---|---|
| Price | $21.86 CAD |
| AUM | $2.21B |
| MER | 0.92% |
| Yield | 5.63% |
| Recent Flows | +$143M |
ZWC applies the covered call strategy across a broader basket of high-dividend Canadian stocks rather than exclusively banks. The 5.63% yield is the highest in the non-leveraged covered call category.
ZWC competes directly with HDIV for income-seeking investors, but without leverage. The +$143 million in recent inflows shows continued investor appetite for this broader covered call approach.
Best for: Investors who want sector diversification beyond Canadian banks within a covered call income strategy.
HDIV — Hamilton Enhanced Canadian Covered Call ETF
| Metric | Data |
|---|---|
| Price | $22.26 CAD |
| AUM | $1.47B |
| MER | 2.84% |
| Yield | 9.55% |
| Recent Flows | +$242M |
HDIV is generating more investor interest than any other ETF in this data set — $242 million in recent inflows, the highest of any fund shown here, and a 9.55% yield that makes it the most talked-about income ETF in Canada right now.
The essential detail: HDIV uses 25% leverage. It holds a portfolio of covered call ETFs and borrows to amplify income and distributions. That leverage explains both the exceptional income in strong markets and the 2.84% MER, which includes borrowing costs.
Leverage works in both directions. HDIV is not a conservative product, regardless of how its monthly distributions feel in your account. It belongs in a portfolio where you understand and accept the amplified risk.
Best for: Experienced investors who understand leverage, want maximum Canadian income, and accept higher volatility as the explicit price of that income.
Which ETF Would I Choose with $100,000?
Choosing the right Canadian dividend ETF depends on your income goal, timeline, and risk tolerance. Here are three clear scenarios.
Scenario 1 — Conservative Investor
Goal: Reliable monthly income, capital preservation, minimal complexity.
Allocation:
- 60% XDIV — quality dividend exposure at the lowest cost
- 40% ZWB — moderate yield boost with Canadian bank stability
Estimated blended yield: approximately 3.9% Estimated monthly income on $100,000: approximately $325/month
This portfolio prioritizes safety and sustainability over maximum yield. Both funds have strong institutional backing, transparent methodologies, and deep liquidity.
Scenario 2 — Balanced Income Investor
Goal: Strong monthly income with meaningful participation in Canadian markets.
Allocation:
- 40% VDY — core large-cap Canadian dividend exposure
- 40% ZWC — covered call income across diversified Canadian equities
- 20% XDIV — quality anchor to reduce concentration risk
Estimated blended yield: approximately 4.3% Estimated monthly income on $100,000: approximately $358/month
This portfolio balances passive dividend income with covered call premium income, maintaining diversification across strategies and sectors.
Scenario 3 — Aggressive Income Investor
Goal: Maximum monthly income, accepts volatility and leverage risk.
Allocation:
- 50% HDIV — leveraged covered call income
- 30% ZWB — bank-focused covered call income
- 20% XEI — broad dividend base for diversification
Estimated blended yield: approximately 6.8% Estimated monthly income on $100,000: approximately $567/month
This portfolio is designed for investors who understand what they own. HDIV’s leverage amplifies both income and risk. Monitor this portfolio actively — it is not a set-and-forget allocation.
The Easiest Way to Build a Complete Income Portfolio
Choosing the right dividend ETF is an important first step. But picking a single fund and calling it a portfolio is where most DIY investors stop short.
A complete passive income portfolio answers more than just “which ETF?” It answers:
- How much of your portfolio goes into dividend ETFs vs covered call ETFs?
- Which accounts hold which ETFs for maximum tax efficiency?
- When do you rebalance, and what triggers a change?
- How do you generate additional income beyond distributions — without taking on more risk?
That last question is where covered call strategies on individual positions become relevant. Selling covered calls on stocks you already own — on top of your ETF distributions — is one of the most effective ways to accelerate passive income from a Canadian portfolio. It is also one of the least understood strategies among DIY investors.
At WyzeInvestors, we have built two resources to address exactly this:
The Canadian ETF Portfolio Guide walks you through building a complete income or growth ETF portfolio step by step — with model allocations for conservative, balanced, and aggressive income investors, account placement strategies for TFSA, RRSP, and non-registered accounts, and a passive income calculator to project your monthly distributions.
The Options Income Guide teaches the covered call strategy from the ground up — how to select strikes, manage positions, generate weekly or monthly premium income on stocks you already hold, and combine that income with your ETF distributions.
Both guides are written specifically for Canadian DIY investors, in plain language, with Canadian tax context built in.
If you are serious about building a passive income portfolio in 2026, these are the tools that close the gap between picking ETFs and actually living off your portfolio.
The Bottom Line: Best Canadian Dividend ETFs for 2026
The best Canadian dividend ETF for 2026 is not the one with the highest yield. It is the one that matches your income goal, tax situation, and risk tolerance — and fits inside a coherent portfolio strategy.
| ETF | Strategy | MER | Yield |
|---|---|---|---|
| XDIV | Quality dividend | 0.12% | 3.50% |
| VDY | High dividend yield | 0.23% | 3.12% |
| XEI | High dividend yield | 0.23% | 3.88% |
| CDZ | Dividend Aristocrats | 0.67% | 3.28% |
| ZWB | Covered call — banks | 0.83% | 5.03% |
| ZWC | Covered call — Canada | 0.92% | 5.63% |
| HDIV | Covered call — leveraged | 2.84% | 9.55% |
Canadian income investing in 2026 is not about picking the biggest number. It is about understanding what you own, why you own it, and how it fits into a portfolio built to generate income for the long term.
The shift toward income and stability is already underway. The investors who will benefit most are not the ones chasing the highest yield — they are the ones who took the time to understand what they were actually buying.
This article is for educational purposes only and does not constitute financial advice. Market data sourced from TradingView, April 2026. Always verify current figures directly with the fund provider before investing. Past performance does not guarantee future results. Yields are indicated and subject to change. Consult a qualified financial advisor for advice tailored to your situation.