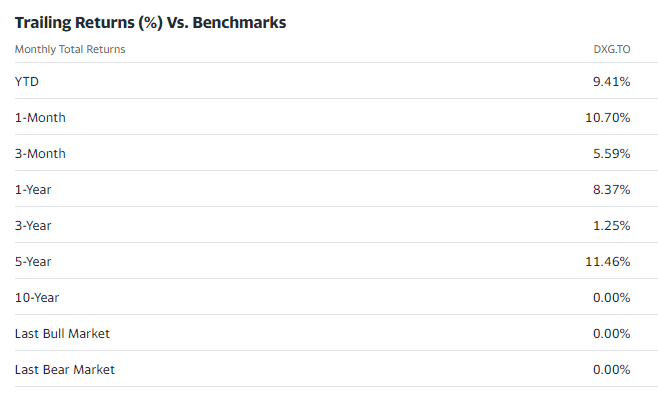
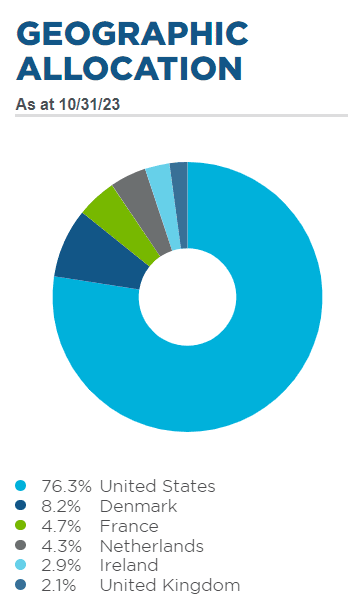
DXG ETF is a actively managed fund. The fund invests primarily in a diversified portfolio of equity securities of businesses located around the world that pay or are expected to pay a dividend or distribution. These securities are selected actively based on size, profitability and liquidity. Around 70% of the funds holdings are invested in US companies.
Combination of index and actively managed ETFs for portfolio risk mitigation.
Market Exposure
Provides exposure to both US and international markets.
Volatility
Low Beta (0.84) indicates lower volatility compared to the overall market.
Sector Diversification
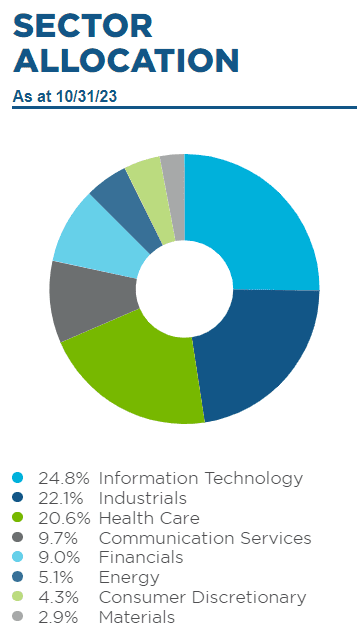
Offers a well-rounded investment approach.
Disadvantages
Tax Implications
Withholding taxes due to international market investments.
Alternative Options
Index ETFs may be more cost-effective for exclusive US market exposure (lower MER).
Dividend Distributions
Lacks monthly or quarterly distributions; dividends are either reinvested or paid annually.
Considering the merits of purchasing DXG, several advantages and disadvantages warrant attention. On the positive side, the combination of index and actively managed ETFs presents a compelling strategy for diversification, effectively mitigating portfolio risk. DXG emerges as an attractive choice for investors seeking exposure to both US and international markets simultaneously, underscored by its 5-star rating on Morningstar. Notably, the fund has outperformed both peers in its category and the MSCI world index, showcasing its competitive edge. With a commendably low Beta of 0.84, DXG exhibits lower volatility compared to the overall market, enhancing its appeal. Additionally, the fund boasts sector diversification, contributing to a well-rounded investment approach.
However, potential downsides include the taxation implications of investing in international markets, leading to withholding taxes. For those seeking exclusive exposure to the US market, alternative options such as index ETFs may be more cost-effective due to lower Management Expense Ratio (MER). Moreover, DXG lacks monthly or quarterly dividend distributions, with dividends either reinvested or paid annually, a factor investors should consider based on their income preferences.
Are you looking to amplify your investment returns? 2x and 3x Leveraged Exchange-Traded Funds (ETFs) might be your ticket to potentially higher gains. This article delves into the mechanics, benefits, risks, and strategies associated with these powerful investment tools, guiding both US and Canadian investors through the complex world of leveraged ETFs.
What Are 2x and 3x Leveraged ETFs?
Leveraged ETFs are investment vehicles that use financial derivatives and debt to magnify the returns of an underlying index. A 2x leveraged ETF aims to double the daily performance of its index, while a 3x leveraged ETF strives to triple it. These ETFs reset daily, targeting short-term traders who wish to capitalize on daily market movements.
How Do Leveraged ETFs Work?
Using derivatives like futures, options, and swap agreements, leveraged ETFs amplify the daily return of an index. If the index rises by 1%, a 2x ETF aims to rise by 2%, and a 3x ETF by 3%. It’s crucial to note that this amplification applies daily, leading to potential compounding effects when held for more than one day.
The Appeal of Leveraged ETFs
Leveraged and inverse ETFs offer the potential for enhanced returns, attracting investors looking for significant gains in a short period. These ETFs use financial derivatives and debt to amplify the returns of an underlying index. While the promise of increased returns is alluring, it’s crucial to understand that these products are typically best suited for short-term strategies. They are particularly suited for traders who monitor daily market movements closely and have a solid grasp of the risks involved.
Market adaptability is another key advantage. Whether the market sentiment is bullish or bearish, leveraged and inverse ETFs provide tools that can adapt to various investment strategies. For bullish markets, leveraged ETFs aim to deliver multiples of the daily performance of the index they track. Conversely, in bearish markets, inverse ETFs seek to profit from a decline in the value of an underlying index.
However, it’s crucial for investors, especially those in the Canadian market, to approach these ETFs with caution. The risks associated with these products are significantly higher due to their complex nature and the potential for rapid losses. They are not typically recommended for long-term investment strategies due to their volatility and the impact of daily market fluctuations on their performance. Understanding these aspects is vital for anyone considering leveraged or inverse ETFs as part of their investment portfolio. As always, conducting thorough research and possibly consulting a financial professional are advisable steps before investing in these high-risk products.
Risks and Considerations
Volatility and the compounding effect are critical aspects to understand when considering leveraged ETFs. These funds aim to provide amplified returns of an underlying index, but this same mechanism greatly increases risk, especially in volatile markets. Volatility can significantly affect the performance of these ETFs due to the compounding effect. This means that daily returns are reinvested, and thus, gains or losses are magnified over time. In stable market conditions, this can lead to substantial growth, but during turbulent times, it can result in severe and rapid losses.
The daily reset feature is another crucial factor. Leveraged ETFs reset their leverage daily, meaning they aim to deliver the multiple of the index’s daily returns, not its long-term performance. This mechanism can cause the ETF’s performance to deviate substantially from the expected long-term returns of the underlying index, especially in volatile markets. This makes them unsuitable for long-term investments.
Lastly, higher fees are a notable downside. Leveraged ETFs often incur higher expense ratios compared to traditional ETFs. These fees can eat into potential returns, especially over longer periods. The combination of compounding effects, daily reset, and higher fees makes leveraged ETFs complex financial instruments that require a thorough understanding and cautious approach, particularly for investors in the Canadian market looking to manage risks effectively.
Strategies for Using 2x and 3x Leveraged ETFs
Leveraged ETFs are particularly designed for short-term trading due to their daily reset mechanism. They are adept at capitalizing on daily market movements, making them an attractive tool for traders who are closely monitoring market trends and looking to make quick, short-term gains. However, due to their complex structure and the risks associated with leverage, they require a deep understanding of market dynamics and timing.
These ETFs can also serve as hedging instruments. Investors may use them to protect against losses in other parts of their portfolio or to profit from market downturns. For instance, an inverse ETF might be used to hedge against market declines, effectively allowing investors to seek positive returns when their other investments are losing value. This can be a strategic way to manage risk, especially during times of market uncertainty.
Despite these potential advantages, it’s crucial to limit exposure to leveraged ETFs. Their high-risk nature, due to leverage and daily resetting, makes them unsuitable as a significant portion of a long-term investment portfolio. Wise investors often use them sparingly, as part of a diversified strategy, to manage and mitigate overall risk. This cautious approach helps in safeguarding the portfolio against the unpredictable swings often associated with these high-stake instruments. For Canadian investors, considering the proportion of investment in leveraged ETFs is crucial in maintaining a balanced and risk-mitigated portfolio.
Investing in Leveraged ETFs: A Guide
Before investing, consider the following:
Understand the Product: Ensure you fully grasp how leveraged ETFs work, including their daily reset and compounding effects.
Assess Risk Tolerance: They are suitable for investors comfortable with high risk and capable of closely monitoring their investments.
Consider Investment Horizon: Align your investment with your short-term market views and investment goals.
Seek Professional Advice: Especially if you’re new to leveraged ETFs, consulting with a financial professional can be invaluable.
Popular leveraged ETFs in US and Canada
When looking into leveraged ETFs, it’s important to consider offerings from various markets. In Canada and the United States, several providers offer 2x and 3x leveraged ETFs. Here are some examples from both countries:
United States
Direxion Daily S&P 500 Bull 3X Shares (SPXL): Aims to provide 3x the daily performance of the S&P 500 Index.
ProShares UltraPro QQQ (TQQQ): Seeks to deliver 3x the daily results of the NASDAQ-100 Index.
Direxion Daily Financial Bull 3X Shares (FAS): Targets 3x the daily performance of the Russell 1000 Financial Services Index.
ProShares Ultra S&P500 (SSO): Seeks to provide 2x the daily performance of the S&P 500.
Canada
Horizons BetaPro S&P/TSX 60 Bull Plus ETF (HXU): Aims to deliver 2x the daily performance of the S&P/TSX 60 Index.
Horizons BetaPro NASDAQ-100 Bull Plus ETF (HQU): Seeks to provide 2x the daily performance of the NASDAQ-100 Index.
BetaPro S&P 500 VIX Short-Term Futures™ 2x Daily Bull ETF (HVU): Offers 2x the daily performance of the S&P 500 VIX Short-Term Futures Index.
Horizons BetaPro S&P/TSX Capped Financials Bull Plus ETF (HFU): Targets 2x the daily performance of the S&P/TSX Capped Financials Index.
Conclusion
2x and 3x leveraged ETFs offer an exciting, albeit risky, opportunity for investors looking to amplify their returns on short-term market movements. They can significantly enhance gains but also come with the potential for amplified losses, especially in volatile markets. Understanding these instruments’ intricacies, their proper use cases, and your own risk tolerance is crucial before considering them as part of your investment strategy. Whether you’re in the US or Canada, these powerful tools require a combination of knowledge, vigilance, and strategic planning to navigate effectively. Remember, with great power comes great responsibility — handle with care and consideration.
I
In today’s investment landscape, All-in-One ETFs have become a staple for investors seeking diversified portfolios with a single purchase. Among these, iShares Core Equity – XEQT and Vanguard All-Equity – VEQT stand out as popular choices. In this post, we’ll dive deep into a comparative analysis of these two prominent ETFs: iShares Core Equity – XEQT and Vanguard All-Equity – VEQT. We’ll explore their historical performance, management fees, and asset allocation to help you understand how they fit into a long-term investment strategy.
All-in-One ETFs, also known as “wrapper” or “multi-asset” ETFs, are designed to offer a complete portfolio in a single ETF. They invest in a collection of other ETFs, providing exposure to a wide range of asset classes, including stocks and bonds across various geographic regions and sectors. This approach simplifies portfolio construction and management for investors, offering a diversified investment with just one trading decision.
XEQT vs VEQT Full comparison
Portfolio of holdings
VEQT (Vanguard All-Equity ETF Portfolio): VEQT diversifies its holdings across four Vanguard Canada ETFs. It’s exclusively invested in Canadian dollar-denominated ETFs, providing a blend of U.S., Canadian, and other global equities.
Vanguard FTSE Developed All Cap ex North America Index ETF (VIU)
18.91%
Vanguard FTSE Emerging Markets All Cap Index ETF (VEE)
7.12%
XEQT (iShares Core Equity ETF Portfolio): XEQT holds a selection of iShares ETFs, including both Canadian and U.S. dollar-denominated funds. The ETF primarily targets U.S., developed international, and emerging markets.
iShares ETFs
Proportion
iShares Core S&P Total U.S. Stock Market ETF (ITOT)
In terms of currency denomination, VEQT exclusively invests in Canadian-denominated ETFs. This approach offers a streamlined currency experience, reducing the currency risk associated with foreign exchange fluctuations for Canadian investors. On the other hand, XEQT includes U.S. dollar-denominated ETFs such as ITOT. This aspect of XEQT allows for broader currency exposure, which might appeal to investors looking to benefit from the diversification and potential gains from U.S. currency movements.
Market Exposure
Regarding market exposure, VEQT and XEQT differ in their geographic emphasis. VEQT tends to overweight Canadian equities and emerging markets. This focus might appeal to investors who are looking for more exposure to the Canadian market and growth potential in emerging economies. Conversely, XEQT leans more heavily towards developed markets outside of Canada. This allocation strategy provides a different balance in geographical exposure, potentially attracting investors who wish to increase their investment in more stable, developed international markets.
Indexing Strategy
Finally, the indexing strategy between VEQT and XEQT shows distinct approaches. VEQT is aligned with FTSE indices for its international holdings, and the Vanguard U.S. Total Market Index ETF (VUN) uses the CRSP Total U.S. Market Index. This strategy might affect the specific stocks and sectors included in the ETF. In contrast, XEQT employs a combination of S&P and MSCI indices for its underlying holdings. This diverse indexing approach can lead to slight variations in stock selection and regional weighting compared to VEQT. These differences in indexing strategies can be a significant consideration for investors focused on specific index performance or sector allocation.
Methodology
VEQT and XEQT, two ETFs, differ mainly in their criteria for portfolio allocation and management. VEQT exhibits a moderate home-country bias by allocating 30% to Canadian equities, aiming to reduce volatility, improve tax efficiency, and lower currency risk for Canadian investors. The remaining 70% of VEQT follows world market cap weights, adjusting as the global market composition changes. In contrast, XEQT allocates fixed weights, with 25% in Canada, 45% in the U.S., 25% in developed, and 5% in emerging markets. Both ETFs allow some discretion in rebalancing, but if significant market changes occur, both VEQT and XEQT are likely to adjust their allocations accordingly.
XEQT and VEQT have the same number of holdings and both offer similar dividend yield and liquidity.
Geographic allocation comparison
XEQT
Fund
United States
43.79
Canada
24.00
Japan
5.88
United Kingdom
3.75
France
2.75
Switzerland
2.53
Australia
2.08
Germany
2.02
China
1.72
Netherlands
1.20
VEQT
Fund
United States of America
42.5%
Canada
30.2%
Japan
4.5%
United Kingdom
3.1%
China
2.5%
XEQT and VEQT are both globally diversified ETFs offered by Vanguard Canada, but they have some differences in their geographic allocation.
XEQT has a more diversified allocation among countries with its top 3 allocations being United States (43.79%), Canada (24.00%), and Japan (5.88%). XEQT also has exposure to a broad range of countries, including France, Switzerland, Australia, Germany, and the Netherlands, which are not included in VEQT’s top allocations.
VEQT, on the other hand, has a higher allocation to Canada (30.2%) and the United States (42.5%), and has smaller allocations to Japan (4.5%) and the United Kingdom (3.1%). Additionally, VEQT includes exposure to China (2.5%), which is not included in XEQT’s top allocations.
Overall, both ETFs provide broad exposure to global markets, but their geographic allocations differ slightly. Investors may choose to invest in one or the other based on their personal preferences, risk tolerance, and investment goals.
VEQT Vanguard All-Equity invests in four different ETFs managed by Vanguard. These ETFs are highly diversified and aim to capture the whole US and Canadian Market. The indexes used by Vanguard seem to offer a better coverage than those used iShares.
If we take a look at the Canadian market, Vanguard is using the FTSE Canada All Cap Index, whereas iShares is relying on the S&P/TSX Capped Composite. I personally prefer the FTSE Canada All Cap Index; I don’t see the advantage of using a capped index.
Vanguard’s VEQT invests more in emerging markets than XEQT iShares Core Equity (7.3% vs 4.6%). This further confirm Vanguard’s VEQT offers more diversification.
Considering all the above, I personally would opt for VEQT!
Additional sources of info
In this article, we’ll delve into 15 top monthly dividend stocks in Canada, renowned as “Dividend Aristocrats.” These are stalwarts of the TSX, offering consistent monthly dividends to shareholders, making them ideal for generating steady passive income. You’ll notice a significant presence of REITs (Real Estate Investment Trusts) in this list, reflecting their popularity in the monthly dividend space. For each entity, we will detail crucial information like dividend yield, payout ratio, and historical performance.
The “Canadian Dividend Aristocrats” are part of an esteemed index managed by Standard and Poors, known as the S&P Canadian Dividend Aristocrats. To qualify, companies must have increased their dividends for at least five consecutive years. For those interested in exploring the entire roster of these prestigious stocks, we’ll direct you to the comprehensive list of Canadian Dividend Aristocrats.
If you are asking yourself, what is the typical profile of a dividend aristocrat stock? I have listed some common characteristics below:
Dividend aristocrats tend to dominate their industry
• The vast majority are companies that are well established in their sector. They manage to generate significant profits thanks to their comfortable position against the competition. They also sometimes operate in regulated markets such as electric utilities with almost no competition;
Safe heaven during turbulent times
• “Dividend aristocrats” are sometimes considered by the financial market as safe havens in the event of a market correction or decline. Indeed, dividend aristocrats are generally less volatile than the market, and there are less targeted by speculators;
Strong financial statements
• “Dividend aristocrats” will tend to have a better financial situation in terms of liquidity than the rest of the market. Their levels of liquidity or debt are generally better than the rest of the market;
Limited growth but there are exceptions
• In general, dividend aristocrats are mature businesses. That is, the growth potential is quite limited. However, some companies can pay dividends and invest in their growth. Usually, the dividend payout ratio is a good indicator. If the rate is low, it means the business is saving some money to grow. Business with high dividend pay out ratio have no financial resources left to grow.
The dividend payout ratio is the amount of dividend distributed by a company divided by the total earnings. For example, a company makes a profit of $ 100 and pays $ 40 in dividends. Its payout ratio is 40%.
If the ratio is high, the company pays almost all of its profits in dividends. There will be little money left in the coffers to innovate or expand to new markets;
It is preferable to invest in a company where the dividend payout ratio is low or medium. The reasoning is that these companies will have money set aside to invest in new projects and thus create growth;
Another variation of payout ratio (Trailing div / Earnings) is the payout ratio to cash (Div / Free cash flows). Earnings can be easily manipulated, so analysts use the payout ratio to cash to assess the safety of dividends better. The website ‘Marketbeat‘ provides the payout ratio to cash for Canadian stocks.
Focus on total return
When one wishes to invest in a dividend-paying stock, it is essential to pay attention to its performance and growth potential. The most common mistake is to invest in stocks with high dividend yields. This strategy is risky. Here’s why :
• A stock can pay a high dividend yield, but is it sustainable? Some companies have a payout ratio that is close to and even exceeds 100%. They manage to post desirable dividend yields, but if we look at the growth prospects, it’s almost nil;
• Investors sometimes shun companies for lack of growth potential or actual risk of lower revenues in the future. These companies experience a drop in the price of their shares, and this causes the dividend yield to become abnormally high. Sooner or later, these businesses will have to cut their dividend.
Monthly dividend stocks Canada (Aristocrats)
The most important measure to evaluate dividend aristocrats’ stocks is without a doubt the dividend streak. It’s simply the number of years, in a row, that the company has increased its dividends.
The yield is a measure of the amount of dividends paid out by a company relative to its stock price. A higher dividend yield may be attractive to investors seeking income, but it may also indicate that the company is paying out a large proportion of its earnings as dividends, which could limit its ability to reinvest in the business.
Payout ratio measures the percentage of a company’s earnings that are paid out as dividends. A high payout ratio may indicate that the company is prioritizing dividends over reinvestment, which could limit growth prospects.
P/E ratio is a valuation ratio that measures the price of a stock relative to its earnings per share. A high P/E ratio may indicate that investors have high expectations for future growth, while a low P/E ratio may indicate that investors have lower expectations or concerns about the company’s future prospects.
Monthly dividend stocks Canada
SIS – Savaria Corp
A Global Leader in Accessibility Solutions
Savaria Corporation, with a market capitalization of $1 billion, is a global leader in the accessibility industry. The company specializes in designing, manufacturing, distributing, and installing a wide array of accessibility equipment, catering to the needs of elderly and physically challenged individuals worldwide.
Comprehensive Product Portfolio
Savaria’s product portfolio is extensive, including solutions such as stairlifts for both straight and curved stairs, vertical and inclined wheelchair lifts, as well as elevators designed for residential and commercial use. This comprehensive range of offerings ensures that Savaria can meet the diverse needs of its customers.
Expanding Horizons
Beyond accessibility equipment, Savaria extends its product line to encompass pressure management products for the medical market, medical beds tailored for long-term care facilities, and specialized medical equipment for the safe handling of patients, such as ceiling lifts and slings. The company also engages in vehicle conversions and adaptations for personal and commercial purposes, further diversifying its reach.
Investor Appeal as a Dividend Aristocrat
Savaria stands out as a Canadian Dividend Aristocrat, reflecting its commitment to shareholder value. With an impressive five-year dividend growth rate of 12.2%, the company offers investors an attractive monthly dividend yield of 3.5%. While the current payout ratio is relatively high at about 83% of adjusted earnings, Savaria’s potential for growth in the coming years could facilitate a reduction in this ratio, making it a more comfortable proposition.
Unlocking Value: Analyst Consensus
Market analysts have set a 12-month price target of $19.50 for Savaria stock, which represents a significant discount of 24% from its current trading price of $14.78 per share. This potential upside of nearly 32% underscores Savaria’s appeal as an investment opportunity, particularly in light of the growing demand for accessibility solutions amid an aging global population. Additionally, the company’s commitment to dividend growth adds another layer of appeal for income-focused investors. Savaria is poised to continue its leadership in the accessibility industry, offering investors a promising combination of growth potential and income generation.
GRT-UN Granite REIT
Granite REIT (GRT-UN) is a Canadian-based real estate investment trust specializing in industrial properties, including warehouses and logistics and distribution centers. A significant strength of Granite REIT is its high-quality portfolio of assets, strategically located in key markets in North America and Europe. This positioning allows it to serve a broad range of tenants, including many multinational corporations. The trust benefits from the growing demand for industrial and logistics spaces, driven by e-commerce and global trade, ensuring a stable and often growing income stream.
However, Granite faces challenges typical to the industrial real estate sector. Market fluctuations can impact the industrial sector differently than residential or commercial spaces, with shifts in global trade policies or economic downturns affecting demand. Its international presence, while a strength, also exposes it to currency risk and varying regulatory environments. Additionally, as with all real estate investments, it is sensitive to interest rate changes, which can affect financing costs. Despite these challenges, Granite’s focus on essential and high-demand real estate, along with its robust tenant base, provides a resilient and promising investment structure.
Allied is a leading owner, manager and developer of data centers and centrally located urban workspaces.
Assets
Allied Properties holds a portfolio of assets strategically located in major Canadian cities, which I consider favorable from a geographical standpoint. During the pandemic, the company managed to increase its cashflows, surpassing pre-pandemic levels, demonstrating its resilience. The majority of Allied’s portfolio consists of urban workspaces and offices, which could be of interest to investors who anticipate a faster return to office environments for businesses.
It’s important to note that unlike RioCan, which has a diversified portfolio including residential and commercial retail, Allied’s focus is primarily on office buildings and data centers. Additionally, Allied Properties has a track record of increasing its dividend for 11 consecutive years, which may be appealing to income-oriented investors.
Risks
However, there are factors to consider. The increasing adoption of hybrid work arrangements in the business world may have an impact on the real estate sector overall. Furthermore, rising costs, including financing expenses, have the potential to affect profit margins. The 2023 results, while solid, indicated the influence of rising interest expenses on the company’s financial performance. On a positive note, Allied strategically completed a significant asset sale, alleviating some pressure on its balance sheet.
In conclusion, Allied Properties offers an interesting investment opportunity with its central urban assets and strong cashflow rebound. Nevertheless, investors should remain cautious and monitor the evolving workplace trends and the potential challenges associated with rising costs in the real estate sector. Allied’s commitment to dividend growth and its focused portfolio should be considered when evaluating it as an investment option.Ass
Exchange Income Corporation (EIF) is a diversified, acquisition-oriented company focused on opportunities in aerospace, aviation, and manufacturing sectors, primarily in North America. A significant strength lies in its diversified portfolio of companies, which helps mitigate risk and allows for steady revenue streams, particularly from its aerospace and aviation services that often include long-term contracts. The company’s strategic acquisitions have historically expanded its market presence and driven growth.
However, EIF’s weaknesses include exposure to industry-specific risks. The aerospace and aviation sectors are highly susceptible to economic cycles and regulatory changes, which can impact demand for its services. Additionally, these sectors are capital-intensive, requiring continual investment in technology and equipment to remain competitive. Global economic volatility, such as fluctuating fuel prices or currency exchange rates, also poses challenges. Despite these concerns, EIF’s focus on niche markets with high barriers to entry and its strong history of dividend payments showcase its resilience and strategic planning.
First National Financial (FN)
First National Financial Corporation (FN) is one of Canada’s largest non-bank lenders, offering a wide array of residential and commercial mortgages. A significant strength of First National is its strong reputation and established position in the Canadian mortgage market, which has allowed for a stable and diverse client base. The company’s innovative approach to mortgage servicing and underwriting, along with its efficient online platform, enhances customer experience and operational efficiency.
On the downside, as a financial institution, First National is sensitive to interest rate fluctuations and regulatory changes in the housing market. Changes in mortgage rules or economic downturns can affect borrowing and lending patterns, potentially impacting revenues. Additionally, intense competition from banks and other non-bank lenders could pressure profit margins. While First National has a robust risk management framework, its focus on the Canadian real estate market does expose it to regional economic shifts and property market corrections.
Canadian Apartment Properties (CAR.UN)
Canadian Apartment Properties REIT, known as CAPREIT (CAR.UN), is a prominent Canadian real estate investment trust specializing in apartment buildings, townhouses, and land lease communities. A key strength is its diverse portfolio, offering a wide range of residential properties across Canada, which helps mitigate risks associated with regional market fluctuations. This diversification is bolstered by its consistent performance in occupancy rates and rent growth, contributing to stable revenue streams.
However, CAPREIT faces certain weaknesses. As with many in the real estate sector, it is sensitive to interest rate changes. Rising rates can increase borrowing costs, impacting profitability. Additionally, the company is subject to regulatory changes in the housing market, including rent control laws that can limit income growth. The reliance on the Canadian market also exposes it to specific economic and geographical risks. Despite these challenges, CAPREIT’s strategic portfolio and management have historically navigated market conditions effectively.
Interrent REIT (IIP.UN)
InterRent REIT (IIP.UN) is a growth-oriented real estate investment trust focused on increasing shareholder value through the acquisition and management of properties primarily within the multi-residential sector. A major strength of InterRent is its strategic growth approach, concentrating on expanding its portfolio in high-growth urban markets, which has historically led to robust income growth and capital appreciation. The company’s effective property management strategies aim to enhance the value of its assets and optimize operational efficiencies, contributing to a strong occupancy rate and stable cash flows.
However, InterRent faces typical industry-related weaknesses. Its focus on multi-residential properties means it is susceptible to market fluctuations, including changes in occupancy rates and rent controls that can limit income growth. The real estate market is also affected by broader economic factors, such as interest rate hikes, which can increase borrowing costs and affect profitability. Despite these challenges, InterRent’s commitment to portfolio quality and geographic diversification within Canada helps it maintain a resilient operational structure.
Parkland Corporation (PKI)
Parkland Corporation is a leading marketer of fuel and petroleum products. Investors have benefited from steadily rising dividends for 9 consecutive years.
One of its key strengths is its diversified business model, which includes retail fuel locations, commercial and wholesale operations, and supply arrangements, allowing for multiple revenue streams. The company’s extensive distribution network and strategic acquisition practices have historically driven growth and expanded market presence.
However, Parkland also faces certain challenges. The company operates in a highly competitive and regulated market, with fluctuations in global oil prices directly impacting costs and profitability. Its operations are capital intensive, requiring continual investment in infrastructure and compliance with environmental regulations. Additionally, as a fuel distributor, it is susceptible to shifts in consumer demand, particularly with increasing environmental concerns and the transition towards renewable energy sources. Despite these challenges, Parkland’s commitment to expanding its convenience retail offerings and growing its renewable energy segments illustrates its adaptability and focus on long-term sustainability.
CT REIT (CRT.UN)
CT REIT, a real estate investment trust, owns and manages retail properties in Canada. It has maintained a dividend streak of 9 years, delivering consistent income to investors.
CRT.UN focuses on retail properties, largely anchored by Canadian Tire, which is a significant tenant. A major strength of CT REIT is the long-term, stable lease agreements with Canadian Tire, providing a reliable income stream. The quality and location of its properties, often in prime retail spots, add to its appeal and stability. The REIT’s conservative leverage and strong affiliation with Canadian Tire offer financial stability and growth opportunities through property development and acquisitions.
However, CT REIT’s focus on retail properties, particularly with a significant tenant like Canadian Tire, presents concentration risks. Changes in the retail landscape, consumer habits, or the financial health of its primary tenant can impact its performance. The retail sector is also vulnerable to economic downturns, affecting occupancy rates and rental income. Additionally, as with many REITs, it is sensitive to interest rate fluctuations, which can affect borrowing costs and capital expenses. Despite these challenges, CT REIT’s strategic management and strong tenant relationships provide a solid foundation for navigating the retail real estate sector.
Chartwell Retirement Res (CSH.UN)
Chartwell Retirement Res operates senior living and long-term care facilities. While it has a relatively shorter dividend streak of 6 years, it has been a reliable income generator.
Chartwell is one of the largest operators in the Canadian senior living sector, focusing on retirement and long-term care facilities. A significant strength is its extensive portfolio of properties across various regions, providing a diversified revenue base. The aging population in Canada suggests a growing demand for senior living options, positioning Chartwell to capitalize on this demographic trend. The company’s focus on providing a range of services from independent living to assisted living and long-term care caters to various needs, enhancing its marketability.
However, Chartwell faces challenges inherent in the healthcare and residential care industry. Operational costs are high, including staffing, maintenance, and regulatory compliance, which can impact margins. The sector is highly regulated, and changes in government funding or regulations can affect profitability. Additionally, the sensitivity to economic downturns can impact occupancy rates and the ability of residents to afford services. Despite these potential issues, Chartwell’s established presence and focus on quality care and community living provide a solid foundation within the growing senior care market.
SmartCentres REIT (SRU.UN)
SmartCentres REIT specializes in retail real estate and operates shopping centers and other retail properties. With 7 consecutive years of dividend increases, it offers both income and growth potential.
A key strength is its strong tenant base, with Walmart as a major anchor, providing a stable and predictable income stream. The trust’s focus on value-oriented retail properties strategically located in prime areas ensures high foot traffic and tenancy demand, contributing to its overall occupancy and financial stability. SmartCentres’ ability to adapt by diversifying into mixed-use developments also illustrates its commitment to growth and resilience.
However, SmartCentres faces challenges typical of the retail real estate sector. The evolving retail landscape, driven by e-commerce and changing consumer preferences, poses risks to traditional brick-and-mortar retail spaces. The concentration in retail might limit flexibility compared to more diversified REITs. Additionally, economic downturns can impact consumer spending and retail health broadly, potentially affecting occupancy rates and rents. Despite these concerns, SmartCentres’ strategic partnership with Walmart and focus on community-centric mixed-use developments provide a strong base to navigate the changing retail environment.
Badger Infrastructure Sol (BDGI)
Badger Infrastructure Solutions provides non-destructive excavation services. While its dividend streak is 6 years, it has shown commitment to rewarding shareholders with regular payouts.
A major strength of Badger is its specialized service, which is critical in infrastructure development, maintenance, and utility work, providing a niche market with less competition. The company’s extensive fleet and geographic reach across North America offer scalability and accessibility to various markets, enhancing its customer base and operational flexibility.
However, BDGI faces certain industry-specific challenges. Its services are closely tied to the health of construction, infrastructure, and utilities sectors, making it susceptible to economic cycles and capital spending in these areas. Regulatory changes and environmental considerations can also impact operational practices and costs. Moreover, while specialized, the market for hydrovac services is competitive, and maintaining technological edge and operational efficiency is crucial. Despite these challenges, Badger’s established reputation, commitment to safety, and operational expertise position it as a key player in the excavation and infrastructure service industry.
Video – Monthly Dividend Stocks Canada
Introduction:
Wealthsimple has become a familiar name in the Canadian financial scene, offering an effortless approach to investing through its Managed Investing service. This service is ideal for a range of investors, from beginners to those with busy lifestyles. Let’s delve into Wealthsimple Managed Investing, its features, fee structure, and the various portfolio options available.
What is Wealthsimple Managed Investing?
Wealthsimple Managed Investing is a robo-advisor service automating investment management. It uses algorithms to create and maintain a diversified portfolio based on your risk tolerance and investment goals. The service is designed for a “set it and forget it” investment strategy.
Key Features of Wealthsimple Managed Investing:
Automated Portfolio Management: Ensures your portfolio is consistently rebalanced and adjusted.
Diversified Investments: Spans across a range of asset classes, including stocks and bonds.
Low Fees: Offers a competitive fee structure, enhancing long-term returns.
User-Friendly Interface: Accessible through an intuitive app and website.
Socially Responsible Options: Provides portfolios focused on socially responsible investing.
Fee Disclosure:
Wealthsimple’s investment management fees are tiered based on net deposits:
Under $99,999: 0.50% fee on AUM.
Above $100,000: Reduced fee of 0.40% on AUM.
Portfolio Types:
Classic portfolios
Wealthsimple’s Classic Portfolio stands out as a versatile investment option, catering to a wide range of investor preferences and objectives. This portfolio is characterized by its diversity and growth orientation, featuring a mix of investments with varied geographic exposures. A significant focus is placed on lower volatility stocks, which aim to provide stability. Additionally, the inclusion of riskier government bonds and gold is a strategic move, optimized to enhance performance during economic downturns.
Another notable aspect of this portfolio is its tax optimization. Wealthsimple employs an automatic selection of tax-efficient Exchange-Traded Funds (ETFs), designed to enhance returns at tax time. This feature can be particularly appealing to investors looking to maximize their after-tax returns. Moreover, the Classic Portfolio offers risk-appropriate options tailored to individual investor profiles.
These range from conservative choices, focusing on high-interest options, to more aggressive, high-growth strategies that are equity-heavy. Such versatility ensures that investors can find a fit that aligns with their risk tolerance and investment goals, making the Classic Portfolio a comprehensive choice for a broad spectrum of investors.
Socially Responsible Investing:
Socially Responsible Investing (SRI) is gaining traction among investors who are increasingly conscious of how their investments impact the world. Wealthsimple offers a portfolio that aligns with this ethos, adhering to certain standards and exclusions. Notably, the funds in this portfolio are in line with the International Energy Agency (IEA) Sustainable Development Scenario and the goals of the Paris Agreement, emphasizing a commitment to environmental sustainability.
Ethical exclusions are also a key feature of this portfolio; for instance, it excludes the top 25% of carbon emitters from each industry. Additionally, there’s an emphasis on corporate governance, with a requirement for companies to have a minimum of either 25% or three women on their boards. Wealthsimple has also developed proprietary Exchange-Traded Funds (ETFs) like WSRI and WSRD, focusing on environmental and social impacts. Balancing this, the Wealthsimple Green Bond ETF (WSGB) supports global green initiatives, providing investors with a diversified approach to SRI. This portfolio reflects a blend of ethical considerations and investment strategies, catering to those who wish to invest responsibly while seeking financial growth.
Faith-Based Investing (Hallal):
Wealthsimple’s Shariah-compliant fund, known as WSHR, offers a unique investment opportunity for those looking to adhere to Islamic financial principles. This fund is not only certified but also regularly audited to ensure its compliance with these principles. A key aspect of its adherence to Shariah law is the restriction on income sources. Companies included in the WSHR fund derive less than 5% of their income from sources considered prohibited under Islamic law.
This ensures that investments align with ethical and religious standards. To maintain this level of compliance, the fund undergoes rigorous and regular reviews. These include quarterly compliance reviews and biannual audits, which are essential for ensuring the fund’s ongoing adherence to Shariah law. This approach allows investors to participate in financial markets while staying true to their religious and ethical beliefs, offering a harmonious blend of faith and finance.
ETFs used by Wealthsimple’s Managed Investing
Wealthsimple crafts each of its portfolios with 8-10 selected ETFs, sourced from a variety of investment firms. The portfolios include a diverse range of ETFs, each holding a mix of stocks and bonds aligned with their specific investment goals. Below is an insight into some of the ETFs incorporated within Wealthsimple’s strategies:
Wealthsimple offers tailored support to its users through various channels. Customers can reach out via live chat, telephone, or email to get assistance tailored to their needs. This level of customer service ensures that individuals can receive help in a manner that suits them best, whether they have queries about their portfolio or need guidance on navigating the platform.
Conclusion:
Wealthsimple’s Managed Investing in Canada offers a straightforward, low-maintenance path into investing, suitable for a range of investor profiles. It’s important to consider how it aligns with your financial goals, risk tolerance, and investment preferences. Remember, diversification and understanding your investment choices are key to a successful investment strategy.
Disclaimer: This post is for educational purposes only and should not be taken as financial advice. Always consult with a financial advisor before making investment decisions.
The concept of the metaverse, a collective virtual shared space created by the convergence of virtually enhanced physical reality and persistent virtual spaces, is no longer a sci-fi fantasy. It’s rapidly becoming a digital reality with significant investment implications. This post delves into the burgeoning world of Metaverse Exchange-Traded Funds (ETFs), offering investors a gateway to this revolutionary space.
Understanding the Metaverse and Its Investment Appeal
Before diving into the specifics of Metaverse ETFs, it’s crucial to grasp what the metaverse is and why it’s garnering so much attention. The metaverse is an expansive network of 3D virtual worlds focused on social connection, gaming, virtual commerce, and more. It’s built on technologies like virtual reality (VR), augmented reality (AR), artificial intelligence (AI), and blockchain.
The investment allure of the metaverse lies in its vast potential to revolutionize how we interact, work, play, and transact. It’s not just a new platform for existing tech companies; it’s a breeding ground for emerging technologies and innovative startups.
Metaverse ETFs: An Investment Vehicle for the Future
ETFs are popular for good reasons: they offer diversification, lower risk compared to individual stock investments, and simplicity. Metaverse ETFs are specialized ETFs that focus on companies developing or significantly involved in the metaverse. These ETFs allow investors to tap into this high-growth potential sector without having to pick individual stocks.
Exploring Popular Metaverse ETFs
Let’s take a closer look at some of the most prominent Metaverse ETFs available to investors:
1. Fount Metaverse ETF (MTVR)
Expense Ratio: 0.7%
MTVR tracks an index of companies engaged in the metaverse industry, offering exposure to sectors like gaming, social media, and VR. Its diversified portfolio includes major companies pioneering in these areas, making it a compelling choice for investors seeking broad exposure to the metaverse sector.
2. Roundhill Ball Metaverse ETF (METV)
Expense Ratio: 0.59%
Focusing on global companies actively involved in the metaverse, METV is an excellent option for those looking to invest in VR, AR, digital assets, and related hardware and software. It includes a mix of tech giants and smaller, specialized firms, offering a balanced view of the metaverse landscape.
3. Global X Metaverse ETF (VR)
Expense Ratio: 0.5%
With the lowest expense ratio among the discussed ETFs, VR aims to invest in companies poised to benefit from the metaverse’s growth. It provides broad exposure to companies across various global regions, encompassing hardware manufacturers, content creators, and platform developers.
4. First Trust Indxx Metaverse ETF (ARVR)
Expense Ratio: 0.7%
ARVR seeks to replicate the Indxx Metaverse Index performance, focusing on key players in the metaverse’s development. This ETF is suitable for investors who prefer a mix of large and mid-cap companies involved in relevant technologies like AR, VR, and digital gaming.
5. ProShares Metaverse ETF (VERS)
Expense Ratio: 0.58%
VERS is designed to track the Solactive Metaverse Theme Index. It targets companies that stand to benefit from the metaverse’s expansion, focusing on sectors like technology, communication, and consumer discretionary. This ETF is ideal for those looking for exposure to a mix of established and emerging metaverse players.
6. Wedbush ETFMG Video Game Tech ETF (GAMR)
Expense Ratio: 0.75%
While GAMR isn’t exclusively focused on the metaverse, it invests in the video game technology industry, closely linked to metaverse technologies. Its holdings include major game developers and companies involved in relevant hardware and software, making it an attractive option for those interested in the gaming aspect of the metaverse.
Comparative Analysis: Risk, Return, and Sector Exposure
When comparing these ETFs, investors should consider factors like historical performance, sector exposure, and risk. For instance, MTVR and METV provide a broader exposure to the metaverse ecosystem, potentially offering more stability. In contrast, GAMR, with its focus on the gaming sector, might appeal to those seeking a more niche investment.
The expense ratios, ranging from 0.5% to 0.75%, are also a crucial consideration. While these fees may seem small, they can impact long-term investment returns, especially in a fast-evolving sector like the metaverse.
Investing in metaverse ETFs requires a thoughtful approach. These ETFs are best suited as part of a diversified portfolio, complementing other investments. Investors should balance their metaverse exposure with investments in other sectors to mitigate risk.
Long-term investors might find these ETFs particularly appealing, given the metaverse’s potential for exponential growth. However, it’s essential to stay informed about technological advancements and market trends, as the metaverse is a rapidly evolving space.
Risks and Considerations
Investing in the metaverse, like any emerging technology, comes with risks. These include technological obsolescence, regulatory challenges, and market volatility. Investors should also be aware of the concentration risk if an ETF is heavily weighted towards a particular company or sector within the metaverse.
The Future of Metaverse Investing
The metaverse is at a nascent stage, and its trajectory is promising. As the technology matures and more companies enter the space, we can expect the metaverse to become a more significant part of the global economy. This growth will likely reflect positively on metaverse ETFs, making them an exciting investment for the future.
Conclusion
Metaverse ETFs offer a unique opportunity to invest in the future of digital interaction and technology. While they come with their set of risks, their potential in a rapidly advancing digital world is undeniable. As with any investment, due diligence, continuous learning, and consultation with financial advisors are key to making informed decisions.
Whether you’re a seasoned investor or new to the game, keeping an eye on the metaverse and its related investment vehicles could be a wise move as we step into a more interconnected digital era.
Hamilton ETFs, with assets under management exceeding $2.5 billion, is recognized as one of Canada’s swiftly growing ETF providers. They specialize in a suite of exchange-traded funds (ETFs) known for their innovative approach, aiming to maximize income and growth. These funds focus on reliable sectors in both Canadian and global markets. In this post, we present Hamilton ETFs reviews for HMAX, HDIV, UMAX, HYLD and HCA.
HMAX ETF is a new fund offered by Hamilton ETF. The fund invests in the Canadian banking sector. This fund aims to provide an attractive dividend yield (target 13%) using a covered call strategy. The strategy consists of writing call options on (50% of the portfolio) to collect premiums and maximize monthly distributions.
1- HMAX writes covered call options on 50% of the portfolio
From an investor’s perspective, the initial point indicates that only half of your investment portfolio will be exposed to potential growth. This portion of the portfolio operates under a covered call strategy, where the potential for capital gains is exchanged for a monthly income derived from dividends and option premiums. These premiums are earned whenever the fund sells a call option in the market.
In summary, I view HMAX as a hybrid fund. The first 50% resembles a traditional dividend fund, offering the prospect of receiving dividends and witnessing long-term portfolio appreciation. In contrast, the remaining 50% adopts a more conservative approach, primarily focused on income generation but lacking the potential for portfolio appreciation.
2- The fund is currently writing option At The Money (ATM) whereas similar funds are writing options OTM (Out of The Money).
I encourage you to refer to the table below for a clearer understanding of the second point’s significance. As shown, the HMAX fund has chosen At The Money (ATM) call options due to their superior profitability compared to Out of The Money (OTM) options. In a nutschell, this decision is driven by two critical factors. Firstly, ATM options generate higher premiums than an OTM strategy. However, it’s important to note that this choice comes with an elevated level of risk.
In options trading, risk is closely linked to the likelihood of the option being exercised by the buyer. So, in the case of OTM options, where the strike price exceeds the current stock price, the likelihood of the option being exercised is low. Conversely, with ATM options, where the strike price is very close or identical to the stock’s current price, the possibility of the option being exercised becomes more realistic.
HDIV is a passive covered call ETF. It’s ideal for investors who seek high dividend income and low volatility. HDIV invests in a basket of 7 covered call & sector focus ETFs. The fund manager uses also cash leverage of 25% to enhance yield and growth potential. The index tracked is The Solactive Multi-Sector Covered Call ETFs Index TR x 1.25.
The ETFs held within HDIV invest primarly in large corporations. In addition to using the covered call strategy, the funds ensure diversification of your investments across various sectors. See below the list of the 7 ETFs that make up HDIV:
Hamilton introduced a new ETF called UMAX, which focuses on the utilities sector (UMAX was launched June 14th 2023). This ETF is designed to provide investors with attractive monthly income while offering exposure to a diversified portfolio of utility services equity securities primarily listed in Canada and the U.S. UMAX aims to reduce volatility and enhance dividend income by employing an active covered call strategy.
Unlike some other income ETFs, UMAX does not utilize leverage. However, it still aims to generate higher monthly income for investors. It offers exposure to blue-chip Canadian utilities, including pipelines, telecoms, and railways. By implementing the covered call strategy, UMAX seeks to enhance monthly income and reduce volatility. Currently, the coverage through covered calls is approximately 50%.
UMAX targets a yield of 13% or more, with monthly distributions to provide consistent income.
Investors can access UMAX, along with other Hamilton ETFs, on the Toronto Stock Exchange (TSX). These ETFs can be included in various portfolios, such as RRSP, RRIF, DPSP, RDSP, FHSA, RESP, and TFSA. Additionally, for investors interested in a Dividend Reinvestment Plan (DRIP), they can contact their individual brokerage for setup details.
HYLD is a passive index ETF that uses a covered call strategy to enhance yield. It seeks to replicate a 1.25 times multiple of the Solactive U.S. Covered Call ETFs Index TR (SOLUSCCT), comprised of 7 higher-yielding U.S.-focused covered call ETFs.
The fund is available for purchase in CAD-Hedged (HYLD) and USD-Unhedged (HYLD.U). The main idea behind HYLD ETF is to offer investors a higher yielding alternative to the S&P 500 with similar volatility (as per Hamilton’s website). It’s important to note we are talking here about ‘higher yielding’ alternative and not similar or higher performance that the S&P 500.
Covered call ETF usually protect against downside risk. This being said, the covered call strategy provides limited downside protection. Also, when you write a covered call, you give up some of the stock’s potential gains. Covered call ETFs will tend to have a higher yield and a lower performance that the portfolio they track.
HCA is strategically designed to closely replicate the returns of the Solactive Canadian Bank Mean Reversion Index TR. This index implements a mean reversion trading strategy, a financial theory that suggests asset prices eventually move back to their historical average or mean over time.
In the context of the Canadian banking sector, the mean reversion strategy applied to the “Big Six” banks involves adjusting the weights of individual bank stocks based on their relative performance. Quarterly rebalancing is conducted to realign the portfolio with the mean reversion principle, ensuring that the weights are adjusted to capitalize on potential opportunities created by deviations from historical averages.
This mean reversion approach aims to capitalize on the tendency of asset prices, in this case, the stocks of Canada’s major banks, to revert to their historical mean after periods of divergence. The Solactive Canadian Bank Mean Reversion Index TR has demonstrated historical outperformance when compared to an equal-weight portfolio of Canada’s banks, showcasing the effectiveness of the mean reversion strategy in this specific market context.
Summary table Risk vs Benefits of a covered call strategy
Aspect
Description
Strategy
Selling call options on a security already owned in the portfolio
Name
Covered call strategy
Risk
Potential for limited upside if the stock price rises above the strike price
Benefit
Generates additional income through premium payments received from selling call options
Goal
To earn income from stock holdings while potentially reducing downside risk
Use
Often used by investors who are willing to sell their stock at a certain price if it reaches that level
Outcome
If the stock price stays below the strike price, the option expires worthless, and the investor keeps the premium payment. If the stock price rises above the strike price, the option buyer may exercise their right to buy the stock, and the investor must sell the stock at the strike price, but still keeps the premium payment.
Hamilton ETFs Reviews
In evaluating the differences between two well-known Canadian Exchange-Traded Funds (ETFs), namely XIC and XEI, it’s essential to delve into the distinct features each one presents. These ETFs are tailored to cater to varying investment strategies and objectives. Let’s explore the nuances in the XIC vs XEI comparison:
The XIC ETF, known as the iShares Core S&P/TSX Capped Composite Index ETF, is specifically designed to track the S&P/TSX Capped Composite Index. This focus provides investors with exposure to a wide array of large-cap stocks in Canada, encapsulating a substantial portion of the Canadian equity market. Its diversified approach spans various sectors, effectively mirroring the composition and performance of the Canadian stock market. This diversification aims to offer a balanced representation of the Canadian economy, making it a suitable choice for investors seeking comprehensive market exposure.
On the other hand, the XEI ETF, or the iShares S&P/TSX Equity Income Index ETF, has a different focus. It tracks the S&P/TSX Equity Income Index, which targets companies known for their high dividend yields. The XEI ETF has a tendency to concentrate more on specific sectors, particularly financials and energy. These sectors are traditionally known for paying higher dividends. This concentration means that while the XEI offers the potential for higher income through dividends, it may also exhibit different risk characteristics compared to a more diversified ETF. The focus on high-dividend-yielding sectors makes it appealing to investors who prioritize income generation, specifically from dividends, in their investment strategy.
The XIC ETF is designed to offer investors insight into the Canadian stock market’s overall performance. It acts as a barometer, reflecting the broader trends and health of the Canadian economy. By mirroring the performance of a wide range of companies across Canada, it provides a comprehensive snapshot of the market’s state.
On the other hand, the XEI ETF is tailored to track the performance of companies known for their profitability and robust dividend-paying ability. The focus on high-dividend-paying stocks, however, means that the XEI can be subject to more volatility. This is because its performance is closely tied to the financial health and dividend distribution strategies of its constituent companies, which can fluctuate based on various economic factors.
3. Dividends and Yield
XIC
Offers moderate dividend yields.
Dividends are typically consistent with the broader market average.
XEI
Known for higher dividend yields.
Attractive for income-focused investors.
4. Risk and Volatility XIC vs XEI
The XIC ETF typically demonstrates a level of risk and volatility that is comparable to the broader market. It’s an appropriate choice for investors who aim to replicate the risk-return profile of the Canadian stock market as a whole. This ETF mirrors the market’s fluctuations, making it suitable for those looking to have a general market exposure that reflects the ups and downs of the Canadian economy.
In contrast, the XEI ETF is often associated with a potentially higher level of risk, primarily due to its focus on sectors that pay high dividends. The concentration in these high-dividend sectors means that its volatility can be significantly influenced by the performance of specific industries. As such, the XEI’s performance can fluctuate more than a broader market ETF, especially if the sectors it focuses on are experiencing economic stress or industry-specific challenges. This makes it a more suitable option for investors who are comfortable with higher risk levels in exchange for the potential of greater rewards from these dividend-rich sectors.
5. Expense Ratios and Fees
XIC(MER = 0.06%)
Typically has a lower expense ratio.
More cost-effective for investors focused on long-term, broad-market exposure.
XEI(MER = 0.22%)
May have a slightly higher expense ratio due to its specialized strategy.
The cost can be a consideration for cost-conscious investors.
6. Investment Suitability
XIC
Well-suited for investors seeking broad exposure to the Canadian market.
Ideal for a core portfolio holding.
XEI
More suitable for investors seeking higher income and who are comfortable with sector-specific risks.
Can be used as a complementary holding to diversify income sources.
Conclusion
Choosing between XIC and XEI depends on your investment objectives, risk tolerance, and preference for income versus total return. XIC offers broad market exposure, making it a solid choice for investors seeking a diversified portfolio reflective of the Canadian market. In contrast, XEI is more suited for those focused on income, willing to accept higher risk from sector concentration. Both ETFs have their merits, and the choice largely hinges on individual investment strategies and goals.
XUU ETF, also known as the iShares Core S&P U.S. Total Market Index, is a popular exchange-traded fund (ETF) that offers investors exposure to a broad range of U.S. equities. This ETF is designed to track the performance of the S&P Total Market Index, which includes large-, mid-, small-, and micro-cap stocks listed on U.S. exchanges. With over 1000 words, we can delve into various aspects of XUU.TO, including its investment strategy, performance, portfolio composition, costs, and its suitability for different types of investors.
Investment Strategy and Objectives
XUU.TO aims to provide long-term capital growth by replicating, to the extent possible, the performance of the S&P Total Market Index. The ETF invests in U.S. stocks across various market capitalizations, thus offering a diversified exposure to the U.S. equity market. This broad market exposure makes it an attractive option for investors seeking to invest in the U.S. economy as a whole.
XUU ETF Performance Analysis
XUU.TO’s performance is closely tied to the performance of the S&P Total Market Index. Historical performance data indicates that this ETF has provided solid returns over the years, although, like any investment, it comes with its share of volatility. The ETF’s performance is influenced by the overall health of the U.S. economy and the performance of the U.S. stock market.
Index Tracked: XUU tracks the S&P Total Market Index, while VUN tracks the CRSP US Total Market Index. Although both indexes aim to provide comprehensive U.S. market exposure, there may be slight differences in their constituent stocks and weightings.
Fund Management: XUU is managed by BlackRock (iShares), and VUN by Vanguard, both highly regarded in the ETF space, but they may have different management styles and approaches.
MER: XUU has a lower MER at 0.08%, while VUN’s MER is 0.17%.
In summary, both XUU.TO and VUN.TO offer Canadian investors broad exposure to the U.S. stock market with a low-cost structure. The choice between them can depend on personal preference for a specific index or fund manager, as well as on the minutiae of their holdings and performance history.
Portfolio Composition
The portfolio of XUU.TO is highly diversified, comprising a wide array of sectors such as technology, healthcare, financials, consumer discretionary, and industrials. This diversification helps mitigate risk as the impact of a downturn in any single sector is cushioned by the performance of others. The ETF includes holdings in some of the largest U.S. companies, as well as a significant number of mid- and small-cap stocks, providing a comprehensive exposure to the U.S. market.
Costs and Fees XUU ETF
One of the advantages of XUU.TO is its low cost. ETFs typically have lower management expense ratios (MERs) compared to mutual funds, and XUU.TO is no exception. Its low MER (0.08%) makes it an attractive option for cost-conscious investors.
Suitability for Investors
XUU.TO is suitable for a range of investors, particularly those looking for exposure to the U.S. market as part of a diversified investment portfolio. It is an excellent choice for long-term investors who wish to benefit from the growth potential of U.S. equities. However, due to its exposure to the equity market, it may not be suitable for extremely risk-averse investors or those with a short investment horizon.
Risk Considerations
Investing in XUU.TO involves risks similar to investing directly in the U.S. stock market. These include market risk, where the value of the ETF can fluctuate due to changes in the stock market, and currency risk, as the ETF is exposed to U.S. dollar fluctuations. Investors should also be aware of the liquidity risk and the concentration risk, although the latter is somewhat mitigated by the ETF’s diversified nature.
Tax Implications for Canadian Investors
For Canadian investors, it’s important to consider the tax implications of investing in a U.S.-based ETF. Dividends from U.S. stocks may be subject to withholding taxes. However, Canadian investors can benefit from favorable tax treatment if they hold the ETF in specific types of accounts, like RRSPs or TFSAs.
Conclusion
In conclusion, XUU.TO represents a compelling investment opportunity for those looking to gain broad exposure to the U.S. stock market. Its diversified portfolio, low cost structure, and track record of performance make it an attractive option for a variety of investors. However, as with any investment, it is crucial for individuals to assess their investment goals, risk tolerance, and time horizon before investing in XUU.TO.
Explore “Top Industrial Sector ETFs 2024” for a comprehensive look at the industrial sector. This key economic area includes aerospace, defense, construction, and logistics. Industrial Sector ETFs offer easy access to this diverse market. They combine various sub-sector firms, providing a broad and effective investment approach for 2024.
Defining Industrial Sector ETFs
Industrial Sector ETFs are investment funds traded on stock exchanges, much like individual stocks. They are designed to track the performance of an index composed of industrial companies. These ETFs allow investors to invest in a broad range of industrial businesses, spreading risk across different sub-sectors and companies. This is particularly advantageous given the sector’s sensitivity to economic cycles and policy changes.
Investment Objective: Seeks to track the performance of the MSCI US Investable Market Industrials 25/50 Index, encompassing stocks in the industrial sector, including construction, aerospace, and defense.
Inception Date: September 23, 2004.
Expense Ratio: 0.10%.
Assets Under Management (AUM): Approximately $4.0 billion.
Industrial Select Sector SPDR Fund (XLI)
Investment Objective: Aims to provide investment results that, before expenses, correspond to the price and yield performance of the Industrial Select Sector Index.
Inception Date: December 16, 1998.
Expense Ratio: 0.12%.
Assets Under Management (AUM): Around $14.0 billion.
iShares U.S. Industrials ETF (IYJ)
Investment Objective: Tracks the investment results of an index composed of U.S. equities in the industrial sector, offering exposure to U.S. companies that produce goods used in construction and manufacturing.
Inception Date: June 12, 2000.
Expense Ratio: 0.42%.
Assets Under Management (AUM): Approximately $1.2 billion.
Fidelity MSCI Industrials Index ETF (FIDU)
Investment Objective: Seeks to provide investment returns that correspond to the performance of the MSCI USA IMI Industrials Index, representing the industrials sector of the U.S. equity market.
Inception Date: October 21, 2013.
Expense Ratio: 0.08%.
Assets Under Management (AUM): Around $500 million.
Investment Objective: Aims to replicate the performance of the Solactive Equal Weight Canada Industrials Index, providing exposure to the Canadian industrial sector with an equal weight approach.
Inception Date: October 20, 2009.
Expense Ratio: 0.55%.
Assets Under Management (AUM): 44M.
Advantages of Industrial ETFs
Composition and Diversity
The strength of industrial ETFs lies in their diversity. They cover a spectrum of companies, from those manufacturing heavy machinery to firms engaged in aerospace and defense. This variety ensures that the impact of sector-specific challenges or downturns is mitigated, providing a more stable investment option within the industrials space.
Indicators of Economic Health
Industrial companies are often seen as economic bellwethers. Their performance can indicate the health of the broader economy, as they are closely tied to consumer demand, business investment, and global economic trends. Industrial Sector ETFs, therefore, can be a strategic choice for investors looking to align their portfolios with the overall economic climate.
Conclusion
In navigating the complex tapestry of the investment world, Industrial Sector ETFs emerge as a strategic and prudent choice for a wide range of investors. By offering diversified exposure to a sector that is both a cornerstone of the global economy and a barometer of economic health, these ETFs present a unique opportunity. They encapsulate the dynamism of the industrial world – from manufacturing and aerospace to construction and logistics – while mitigating individual stock risk through broad diversification.
The appeal of Industrial Sector ETFs extends beyond their diversification benefits. They offer flexibility, lower costs, and a simple, efficient way to invest in a range of companies integral to economic growth and innovation. For long-term investors, in particular, these ETFs align well with strategies that capitalize on long-term economic trends like technological advancements and infrastructure development.
As we look ahead, the industrial sector is poised to continue playing a crucial role in shaping the global economy, influenced by factors like technological innovation, urbanization, and evolving global trade dynamics. In this context, Industrial Sector ETFs not only offer a gateway to participate in this sector’s potential growth but also serve as a tool for portfolio stabilization and long-term wealth generation.
In conclusion, whether you are a seasoned investor seeking to balance your portfolio or a newcomer aiming to tap into the industrial sector’s potential, Industrial Sector ETFs stand out as a valuable and strategic investment choice. As with any investment, it’s important to consider individual financial goals and market conditions, and consult with financial advisors to tailor investments to your specific needs and risk tolerance.