Embark on a journey into the realm of gold investments as we present an in-depth guide to the top three gold ETFs in Canada. Tailored to suit diverse investor preferences, each ETF boasts unique features and benefits that set them apart in the market. Join us as we delve into these options, unraveling the reasons that make them the best in the Canadian gold ETF landscape.

[stock_market_widget type=”table-quotes” template=”color-header-border” color=”#5679FF” assets=”CGL.TO,PHYS.TO,XGD.TO” fields=”symbol,name,price,change_pct” display_header=”true” display_chart=”false” search=”false” pagination=”false” scroll=”false” rows_per_page=”5″ sort_direction=”asc” alignment=”left” api=”yf”]
Best Gold ETF Canada
Sprott Physical Gold Trust (PHYS)
Investment Objective and Goal
The Sprott Physical Gold Trust (PHYS) stands as a unique investment vehicle specifically created to invest and hold substantially all of its assets in physical gold bullion. Its primary goal is to provide a secure, convenient, and exchange-traded alternative for investors who seek exposure to physical gold without the usual inconveniences associated with direct investment in gold bullion.
Financial Snapshot
Total Net Asset Value: $6.24 Billion
Fees & Expenses: Management Expense Ratio of 0.41%
| Reasons to Invest in PHYS | Key Features |
|---|---|
| Fully Allocated Gold | The Trust exclusively holds fully allocated and unencumbered gold, investing solely in London Good Delivery (“LGD”) physical gold bullion, providing direct and transparent gold investment. |
| Redeemable for Metals | Unitholders can redeem their units for physical gold bullion monthly, enhancing flexibility and aligning with the Trust’s commitment to tangible gold ownership. |
| Trustworthy Storage | The custody of the Trust’s metal is entrusted to the Royal Canadian Mint, eliminating leveraged financial institutions, insulating investors from the risk of financial loss. |
| Potential Tax Advantage | PHYS offers a potential tax advantage for certain non-corporate U.S. investors, with gains realized on unit sales subject to a capital gains rate of 15%/20%, favorable compared to the 28% collectibles rate. |
| Easy to Buy, Sell, and Own | Trust units can be conveniently purchased on any open trading day for the NYSE or TSX, eliminating the need for physical handling, securing, or protecting the metal, adding to the convenience of gold ownership. |
| A Liquid Investment | With an average daily trading volume of $40 million, Trust units are highly liquid, providing investors with easy sellability on any open trading day for the NYSE or TSX. |
[stock_market_widget type=”table-quotes” template=”color-header-border” color=”#5679FF” assets=”PHYS.TO” fields=”name,symbol,price,change_pct” display_header=”true” display_chart=”false” search=”false” pagination=”false” scroll=”false” rows_per_page=”5″ sort_direction=”asc” alignment=”left” api=”yf”]
[stock_market_widget type=”table-quotes” template=”color-header-border” color=”#5679FF” assets=”PHYS.TO” fields=”symbol,ytd_return,three_year_average_return,five_year_average_return” display_header=”true” display_chart=”false” search=”false” pagination=”false” scroll=”false” rows_per_page=”5″ sort_direction=”asc” alignment=”left” api=”yf”]
Best Gold ETF Canada
iShares Gold Bullion ETF (CAD-Hedged) (TSX:CGL)
Targeted Exposure to Gold with Currency Hedge
Convenient and Cost-Effective Gold Exposure
Investors seeking targeted exposure to the price of gold while mitigating currency risk often turn to the iShares Gold Bullion ETF. This meticulously crafted fund is designed to mirror the performance of the gold bullion market, offering investors an efficient way to participate in potential gold price movements without being susceptible to fluctuations in the Canadian dollar.
Convenience of Physical Gold Bullion
At the core of its appeal is the provision of convenient and cost-effective exposure to physical gold bullion. By directly holding gold bullion, the ETF eliminates the need for investors to engage in the physical purchase, storage, and security of gold. This approach transforms gold investment into a practical and easily tradable asset, aligning with modern investors’ preferences for simplicity and efficiency.
Diversification and Inflation Hedge
Diversification for Risk Mitigation
The iShares Gold Bullion ETF stands as a valuable tool for diversification within investment portfolios. Gold, historically recognized as a “safe-haven” asset, exhibits a low correlation with traditional asset classes like stocks and bonds. Incorporating gold into a diversified portfolio can potentially reduce overall risk and enhance stability, particularly during periods of economic uncertainty.
Safeguard Against Inflation
In addition to diversification benefits, this ETF is positioned as a potential safeguard against inflation. Gold has traditionally served as a hedge during periods of currency devaluation or rising prices. Investors concerned about the eroding effects of inflation on purchasing power may find this ETF strategically aligned to help protect and preserve wealth.
Fees and Net Assets
Management Fee and Expense Ratio
To access these benefits, investors incur a management fee of 0.50%. This fee covers various operational aspects, including research, trading, and administration. The Management Expense Ratio (MER), encompassing the management fee and other operational expenses, stands at 0.55%. These fees are crucial considerations, impacting the overall return on investment.
Assets Under Management
As of November 1, 2023, the iShares Gold Bullion ETF commands a substantial market presence with net assets totaling CAD 710,283,151. This figure indicates the fund’s size and underscores its significance within the market.
Unhedged Variant – iShares Gold Bullion ETF (Non-Hedged) (TSX:CGL.C)
The unhedged version of the iShares Gold Bullion ETF (TSX:CGL.C) shares similarities with its hedged counterpart but deviates in its approach to currency exposure. Unlike the hedged version, the unhedged variant abstains from employing strategies to mitigate the impact of currency fluctuations between the Canadian dollar (CAD) and the U.S. dollar (USD). Investors opting for this variant embrace the potential impact of currency movements on their returns, seeking a more direct and unaltered gold investment experience.
[stock_market_widget type=”table-quotes” template=”color-header-border” color=”#5679FF” assets=”CGL.TO” fields=”name,symbol,price,change_pct” display_header=”true” display_chart=”false” search=”false” pagination=”false” scroll=”false” rows_per_page=”5″ sort_direction=”asc” alignment=”left” api=”yf”]
[stock_market_widget type=”table-quotes” template=”color-header-border” color=”#5679FF” assets=”CGL.TO” fields=”symbol,ytd_return,three_year_average_return,five_year_average_return” display_header=”true” display_chart=”false” search=”false” pagination=”false” scroll=”false” rows_per_page=”5″ sort_direction=”asc” alignment=”left” api=”yf”]
Best Gold ETF Canada
iShares S&P/TSX Global Gold Index ETF (TSX:XGD)
Investment Objective:
The primary goal of the iShares S&P/TSX Global Gold Index ETF (XGD) is to achieve long-term capital growth by closely replicating the performance of the S&P/TSX Global Gold Index, net of expenses. The fund focuses on providing investors with exposure to global securities of companies involved in gold production and related products.
Fees:
XGD charges a management fee of 0.55% and has a Management Expense Ratio (MER) of 0.61%. These fees cover the costs associated with managing the ETF, including tracking the index and maintaining the portfolio.
Holdings:
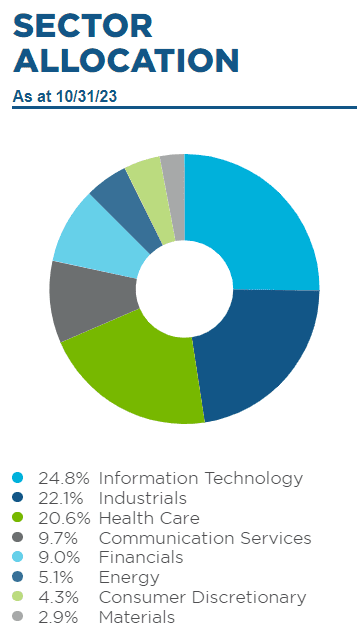
As of October 31, 2023, XGD’s portfolio consists of key holdings in the gold sector, reflecting significant market value within the Materials sector. The top holdings include:
Newmont (NEM): Materials sector, 14.98% weight
Barrick Gold Corp (ABX): Materials sector, 14.09% weight
Franco Nevada Corp (FNV): Materials sector, 11.74% weight
Agnico Eagle Mines Ltd (AEM): Materials sector, 11.66% weight
These holdings represent major players in the global gold industry, providing investors with exposure to companies contributing substantially to the Materials sector.
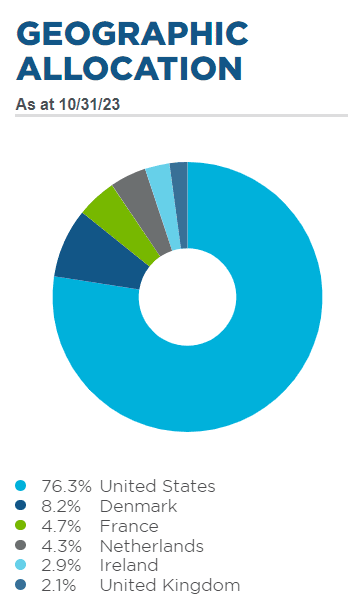
Geographic Exposure:
XGD offers geographic diversification in its holdings, spreading across key regions involved in gold production. The geographic exposure as of October 31, 2023, is as follows:
Canada: 66.99%
United States: 19.01%
South Africa: 11.03%
This diversified geographic exposure allows investors to access gold-producing companies from different regions, mitigating risks associated with any single geographical area.
Considerations for Investors:
Gold Price Sensitivity: XGD’s performance is closely tied to the movements in the price of gold. Investors should be mindful of factors influencing gold prices, as they directly impact the fund’s returns.
Sector Risk: Concentrating on the gold sector, XGD is exposed to risks specific to this industry, including commodity price fluctuations, geopolitical events, and operational challenges faced by mining companies.
Global Economic Factors: Economic conditions worldwide can significantly impact the demand for gold and the profitability of gold producers. Staying informed about macroeconomic trends is crucial for investors considering XGD.
The iShares S&P/TSX Global Gold Index ETF (XGD) is strategically designed to provide investors with exposure to the global gold sector, aiming for long-term capital growth.
[stock_market_widget type=”table-quotes” template=”color-header-border” color=”#5679FF” assets=”XGD.TO” fields=”name,symbol,price,change_pct” display_header=”true” display_chart=”false” search=”false” pagination=”false” scroll=”false” rows_per_page=”5″ sort_direction=”asc” alignment=”left” api=”yf”]
[stock_market_widget type=”table-quotes” template=”color-header-border” color=”#5679FF” assets=”XGD.TO” fields=”symbol,ytd_return,three_year_average_return,five_year_average_return” display_header=”true” display_chart=”false” search=”false” pagination=”false” scroll=”false” rows_per_page=”5″ sort_direction=”asc” alignment=”left” api=”yf”]
Best Gold ETF Canada