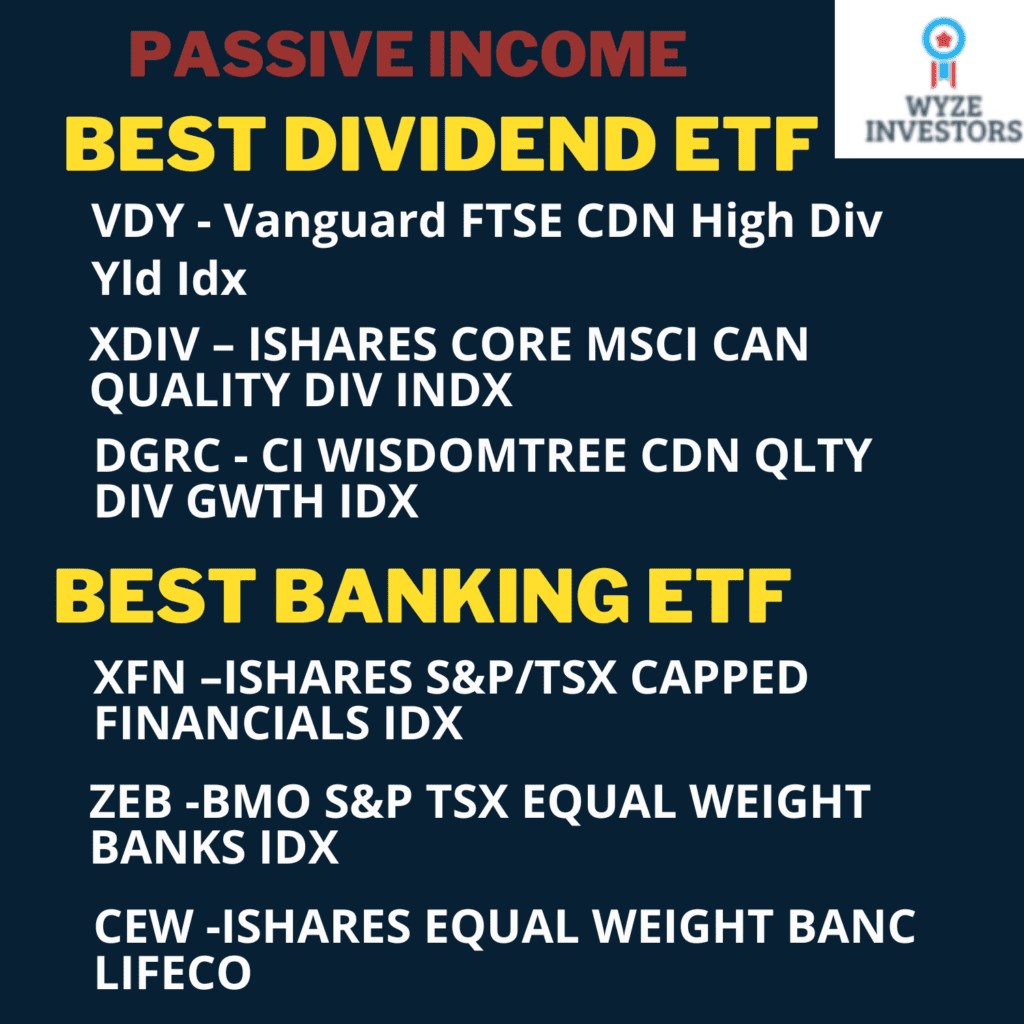
In this post, we will compare popular Canadian Bank ETFs in terms of performance, MER, Dividend yield and volatility. But first, we will discuss the banking sector futur perspectives.

Executive summary

Banking sector perspectives

cibc investors' edge
  • How to explain the great performance of the Canadian banking sector during the pandemic?

News of faster economic growth than anticipated seem to have favored the banking sector in the past months. Large Banks benefited from:

1-Trading: revenues are soaring from an exceptional year. Retail investors were abnormally active and trading much more than usual which increased commissions’ revenues for Banks;

2-Releasing large sums of money that were held in reserves to hedge against expected loan losses due to pandemic. These losses never materialized.

  • What’s next for the banking sector?

The Banking sector is poised to benefit from a tighter monetary policy. This is because rising rates will help in boosting profits for banks, insurance companies, discount brokerage firms and asset managers. The difference between short and long-term interest rates is likely to improve banks’ net interest margins.

Top 10 Best Growth ETF in Canada!

7 Best Dividend stocks to buy now (safe dividends and growth)

Best Canadian Financial ETFs: AUM, MER and Dividend yield comparison

AUM
in M
MER
%
Div
Yld
FIE – Ishares CDN Fin
Mthly Income
9780.897.07
ZEB -BMO S&P TSX
Equal Weight Banks Indx
2,8000.284.41
ZWB –BMO Covered
Call Canadian Banks
2,7000.727.46
RBNK -RBC CDN
Bank Yield Index 
2730.334.67
 HCA -Hamilton Canadian
Bank Mean Reversion 
5510.565.42
CEW -Ishares Equal
Weight Banc Lifeco
2450.613.86
HEWB – Horizons Eql
Wght Can Banks Index
1560.330
 HCAL – Hamilton Can
Bank 1.25X Lvrg
3651.067.40
XFN –iShares S&P/TSX
Capped Financials Index
1,9000.613.33

CIBC investors' edge

HCAL Hamilton Canadian Bank 1.25X Levrage ETF has the highest MER among selected ETFs. Considering that one can easily replicate the portfolio held by most of the ETFs above, it’s wise to choose ETFs that charge minimal fees. ZEB has the lowest MER at only 0.28.

The ETFs above have different strategies that can be summrized below:

Equal weight

An equally weighted portfolio of ETFs is a type of investment portfolio in which all the securities in the portfolio are given the same weight or allocation, regardless of their market capitalization or other factors.

Leverage

A leveraged ETF is an exchange-traded fund (ETF) that seeks to deliver multiples of the daily or intra-day return of an underlying index or asset. Leveraged ETFs typically use financial derivatives such as futures, options, and swaps to achieve their leverage. HCAL uses for instance 1.25 leverage. A 1.25 leverage ETF is an exchange-traded fund (ETF) that aims to provide 125% of the daily return of the underlying index or asset that it tracks.;

Active

An active ETF is an exchange-traded fund (ETF) that is managed by an investment manager who aims to outperform the market or achieve a specific investment objective. Unlike passive ETFs, which track a particular index or benchmark, active ETFs use a variety of investment strategies such as fundamental analysis, quantitative analysis, and technical analysis to make investment decisions and attempt to generate alpha (excess returns) compared to the market.

Passive

mainly XFN, which replicates the S&P/TSX Capped Financials Index. A passive ETF is an exchange-traded fund (ETF) that seeks to track the performance of a specific index or benchmark. Passive ETFs typically hold the same securities as the underlying index or benchmark, in the same proportions as the index or benchmark. They aim to provide investors with exposure to a diversified portfolio of securities at a low cost.

Best Canadian Financial ETFs: Performance comparison

Updated daily

Based on historical performance alone, the ZEB -BMO S&P TSX Equal Weight Banks ETF had the second best performance in the last 5 years. Additionally, the fund pays a dividend yield of around 4%. The management expense ratio is 0.28%, the lowest on our list. ZEB invests in the 6 largest Canadian banks equally.

Another competitor to ZEB is the RBNK – RBC CDN Bank Yield Index fund. This fund is newer and has had the best performance over 5 years. This fund also benefits from a very competitive management fee of 0.33%. The RBNK manager favors in its investment strategy the 2 Canadian banks that offer the highest rate of return (with an allocation of 25% each), followed by the banks that offer the lowest rate of return.

HEWB had the best performance year-to-date and over 3 years. However, this fund does not pay dividends. HEWB is similar to ZEB. Indeed, the fund holds equally the main Canadian banks.

CEW Ishares Equal Weight Banc Lifeco and XFN iShares S&P/TSX Capped Financials Index are also good choices based on long-term performance. Both pay a dividend yield of around 4%.

For those looking for high dividend income, FIE Ishares CDN Fin Mthly Income offers an attractive dividend yield of over 6%. This fund invests about 80% of these holdings in bank stocks and the rest in a preferred stock ETF. HCAL – Hamilton Can Bank 1.25X Lvrg and HCA – Hamilton Canadian Bank Mean Reversion are also good alternatives. The only downside with his funds is the relatively high management fees. For FIE, the long-term return is low compared to other funds.

ZWB – BMO Covered Call Canadian Banks is ideal for investors who want to earn high dividends and lower their risk at the same time. ZWB is what is known as a covered call option writing fund. This type of fund has two purposes:

1- reduce the risk (volatility) of the portfolio by selling covered call options;

2- improve the dividend yield with the premiums earned following the issuance of covered call options.

The major disadvantage of this strategy is that the performance will be lower.

Best dividend stocks to buy – Dividend aristocrats 2023

Best US Dividend ETFs in Canada (2023)!

FIE – Ishares CDN Fin Monthly Income

Ishares CDN Fin Monthly Income seeks to maximize total return and to provide a stable stream of monthly cash distributions. FIE has a high exposure to the financial sector.

FIE Morningstar rating

FIE Dividend ETF holdings

Company NameAllocation
iShares S&P/TSX Cdn
Prefr Shr ETF Comm
21.1%
iShares Core Canadian
Corporate Bd ETF
10.3%
Canadian Imperial
Bank of Commerce
8.5%
Royal Bank of Canada8.2%
The Toronto-Dominion Bank6.7%
National Bank of Canada6.5%
Manulife Financial Corp6.4%
Power Corporation of Canada6.0%

As of October 29th

Sector allocation

TypeFund
Banks44.96
Insurance30.24
Diversified Financials8.48
Energy5.01
Utilities4.50
Real Estate2.81
Telecommunications1.12
Transportation0.73
Food & Staples Retailing0.57
Cash and/or Derivatives0.41

Please consult issuers’ website for up-to-date figures

ZEB – BMO S&P TSX Equal Weight Banks Index ETF

The BMO Equal Weight Banks ETF has been designed to replicate, to the extent possible, the performance of the Solactive Equal Weight Canada Banks Index, net of expenses. The index includes the major Canadian banks with a balanced allocation as you can see in the composition of the portfolio below.

CIBC investors' edge

Holding details

Weight (%)Name
17,18%BANK OF MONTREAL
16,90%TORONTO-DOMINION BANK/THE
16,78%CANADIAN IMPERIAL BANK OF COMMERCE
16,59%NATIONAL BANK OF CANADA
16,50%ROYAL BANK OF CANADA
15,86%BANK OF NOVA SCOTIA/THE
0,19%CASH

Please consult issuers’ website for up-to-date data

ZWB – BMO Covered Call Canadian Banks

The ZWB aims to provide exposure to a portfolio of dividend-paying securities (Canadian Banks), while collecting premiums related to call options. The portfolio is chosen on the basis of the criteria below:

• dividend growth rate,

•  yield

• payout ratio and liquidity.

ZWB Morningstar rating

ZWB holdings

NameWeight
BMO Equal Weight Banks ETF27.2%
  Bank of Montreal12.9%
Canadian Imperial Bank of Commerce12.7%
Royal Bank of Canada12.1%
National Bank of Canada11.9%
  The Toronto-Dominion Bank11.9%
Bank of Nova Scotia11.4%

Please visit issuers’ website for up-to-date figures

RBNK – RBC CDN Bank Yield Index

RBC Canadian Bank Yield Index ETF seeks to replicate the Solactive Canada Bank Yield Index. The latter is focused only on the Canadian banking industry.

RBNK Morningstar rating

RBNK Holdings

HoldingsAssets
CANADIAN IMPERIAL BANK OF COMMERCE26.7%
BANK OF NOVA SCOTIA23.7%
ROYAL BANK OF CANADA17.1%
TORONTO-DOMINION BANK15.6%
BANK OF MONTREAL8.5%
NATIONAL BANK OF CANADA8.4%

Please consult issuers’ website for up-to-date data

HCA – Hamilton Canadian Bank Mean Reversion 

HCA invests in the 6 largest Canadian banks. This fund differentiates itself by its investment strategy, called “Mean reversion”.

The strategy is applied as follows:

80% of the portfolio in the 3 banks that performed the least well among the 6 largest Canadian banks;
20% remaining in the 3 banks which outperformed.

HCA holdings

As of December 31st

NAMEWeight
Bank of Nova Scotia27.9%
Toronto-Dominion Bank27.1%
Royal Bank of Canada26.4%
Bank of Montreal6.4%
Canadian Imperial Bank of Commerce6.2%
National Bank of Canada6.0%

CEW -Ishares Equal Weight Banc Lifeco

CEW Invests in a portfolio of common shares of Canada’s largest banks and life insurance companies.

CEW Morningstar rating

CEW Holdings

NAMEWeight
%
GREAT WEST LIFECO INC10,16
IA FINANCIAL INC10,12
TORONTO DOMINION10,06
NATIONAL BANK OF CANADA10,05
MANULIFE FINANCIAL CORP10,00
BANK OF NOVA SCOTIA9,92
SUN LIFE FINANCIAL INC9,90
BANK OF MONTREAL9,86
CANADIAN IMPERIAL BANK OF COMMERCE9,78
ROYAL BANK OF CANADA9,70

HEWB – Horizons Eql Wght Can Banks Index

The Horizons Equal Weight Canada Banks Index ETF (“HEWB”) seeks to replicate the performance of the Solactive Equal Weight Canada Banks Index. The Index is an equal-weight index of equity securities of six Canadian banks.

HEWB Morningstar rating

HEWB Holdings

Security NameWeight
TORONTO-DOMINION BANK17.17%
BANK OF NOVA SCOTIA16.82%
NATIONAL BANK OF CANADA16.77%
BANK OF MONTREAL16.65%
ROYAL BANK OF CANADA16.37%
CANADIAN IMPERIAL
BANK OF COMMERCE
16.23%

Please consult issuers’ website for up-to-date data

HCAL – Hamilton Canadian Bank 1.25X Lvrg

Hamilton Enhanced Canadian Bank ETF aims to provide investors with a unique way to participate in the performance of the Canadian banking sector. It’s designed to track 1.25 times the returns of the Solactive Equal Weight Canada Banks Index. Essentially, for every 1% increase (or decrease) in the index, HCAL aims to increase (or decrease) by 1.25%. It achieves this by investing directly in Canadian banks and employing a modest 25% cash leverage. Unlike some other funds, HCAL does not use derivatives.

As at December 29, 2023

TICKERNAMEWEIGHT
HEBHamilton Canadian Bank Equal-Weight Index ETF125.1%

Leverage is via cash borrowing (not derivatives), provided by a Canadian financial institution.

HEB HOLDINGS

Hamilton Canadian Bank Equal-Weight Index ETF invests in Canada’s “big six” banks

NAMEWEIGHT
Canadian Imperial Bank of Commerce18.1%
Bank of Montreal17.3%
Royal Bank of Canada16.7%
National Bank of Canada16.6%
Toronto-Dominion Bank16.0%
Bank of Nova Scotia15.3%

Please consult issuers’ website for up-to-date data

XFN -iShares S&P/TSX Capped Financials Index

This is a passive strategy ETF. It replicates the performance of the S&P/TSX Capped Financials Index, net of expenses.

XFN Holdings

NameWeight
%
ROYAL BANK OF CANADA19.38
TORONTO DOMINION18.36
BANK OF NOVA SCOTIA10.58
BROOKFIELD ASSET MANAGEMENT INC CL10.36
BANK OF MONTREAL9.18
CANADIAN IMPERIAL BANK OF COMMERCE6.87
MANULIFE FINANCIAL CORP5.06
SUN LIFE FINANCIAL INC3.81
NATIONAL BANK OF CANADA3.26
INTACT FINANCIAL CORP3.04
CIBC investors' edge

Investment Objective

ENCL ETF seeks to provide, to the extent possible and net of expenses:

(a) Exposure to the performance of an index of Canadian companies involved in the crude oil and natural gas industry (currently, the Solactive Equal Weight Canada Oil & Gas Index). This index aims to offer diversified exposure to various companies in the Canadian energy sector, spreading out the investment risk.
(b) High monthly distributions of dividend income and call option premiums. To generate premiums, ENCL uses a dynamic covered call option writing program. While this strategy can enhance income, it also limits the potential for capital appreciation.

cibc investors' edge

Magnified Growth Potential

ENCL aims to unlock the growth potential of Canadian oil and gas companies by using light leverage of 125%. This means for every dollar invested, the fund has $1.25 working in the market. This leverage can enhance growth potential and yield, but it’s important to note that it also increases the risk. The use of leverage means that while potential gains can be higher, potential losses can be magnified as well.

High-Income Potential

ENCL employs a covered call strategy to potentially enhance portfolio income while aiming to reduce volatility. By selling call options on its holdings, ENCL can generate additional income. This strategy can provide a cushion against market downturns, but it also means capping the upside potential of the investments. If the underlying stock prices rise significantly, the gains from those stocks may be limited due to the obligations of the call options.

Monthly Distributions

ENCL is designed to provide consistent monthly income along with potential long-term capital growth. This can be attractive for investors seeking regular cash flow. However, the reliance on covered call strategies and leverage means that the consistency and amount of these distributions can vary based on market conditions.

Management Expense Ratio (MER)

The management expense ratio (MER) of ENCL is 2.42%. This fee covers the costs associated with managing the ETF, including administrative expenses, and can impact the overall returns. Investors should consider whether the potential benefits of ENCL’s strategy outweigh the costs.

Risk Factors

1. Leverage Risk:
ENCL uses leverage to enhance returns, which also amplifies potential losses. In volatile markets, leveraged ETFs can experience significant price swings, leading to higher risk.

2. Market Risk:
ENCL’s performance is tied to the Canadian oil and gas industry. Any downturn in this sector, due to fluctuating oil prices, regulatory changes, or economic conditions, can negatively impact the ETF’s value.

3. Covered Call Strategy Risk:
While selling covered calls can generate income and reduce volatility, it also limits the upside potential. If the underlying stock prices rise significantly, the gains may be capped due to the call options sold.

4. Distribution Variability:
The consistency and amount of monthly distributions can vary based on market conditions and the performance of the covered call strategy. Investors should not rely solely on these distributions for their income needs.

5. High Management Expense Ratio:
With a MER of 2.42%, the cost of managing ENCL is relatively high. This fee can erode overall returns, especially in comparison to lower-cost ETFs.

Conclusion

ENCL offers exposure to the Canadian oil and gas sector with a strategy designed to enhance growth and income through leverage and covered call options. While these strategies can increase income and potential returns, they also introduce higher risk and can cap the upside potential. With a management expense ratio of 2.42%, investors should weigh these trade-offs and ensure that ENCL aligns with their risk tolerance and investment goals.

In today’s fast-paced and ever-changing financial landscape, finding opportunities to grow your savings while minimizing risk can be a challenge. However, for Canadian investors seeking a reliable and high-interest savings option, the Purpose High Interest Savings Fund (PSA ETF) offers a compelling solution. In this article, we will delve into the features and benefits of the PSA ETF, shedding light on its potential to optimize your savings strategy.

What’s a High interest savings ETF?

High interest savings ETF are financial instruments designed to give investors a means to save capital while earning a competitive interest rate. Furthermore, they can provide investors with better returns than typical savings accounts or money market funds (while maintaining a high level of liquidity and safety, one of their main benefits).

These ETFs are often seen as relatively low-risk investments, in contrast to stocks or other types of investments.

PSA investment objective

PSA is relatively low risk investment suitable for investors looking for an alternative to high interest deposit accounts.

Updated daily – XIU Stock

Historical performance PSA vs similar ETFs

Overview – High interest savings ETF Canada

Review of UMAX: Hamilton Utilities Yield Maximizer ETF (13% Target yield)

What are the largest ETFs in Canada?

Forward dividend yield and Management fees

SymbolDividend
Yield
Fees
CSAV.TO4.78%0.15%
CASH.TO4.92%na
HISA.NE4.90%0.15%
PSA.TO4.91%0.16%
NSAV.NE4.52%0.43%
Source: Yahoo finance

High interest savings ETF – Canada

You can click on the ticker of each ETF to visit the issuer’s website. Please note the dividend yield shown on the issuers’ websites corresponds to the forward dividend yield. The latter is a projection based on the last dividend paid.

The trailing dividend yield shown in the table above is the dividend yield calculated using the dividend paid in the last 350 days.

GIC vs High interest saving ETFs

Investment
Option
GICHigh-Interest
Savings ETF
Type of
Investment
Low-riskLow to moderate risk
ReturnGuaranteed fixed
rate of return
Potentially higher
rate of return
TermTypically 1 to 5 yearsNo fixed term
Interest
Rate
Typically higher than
savings accounts
Varies depending on
market conditions
RiskVery low riskHigher risk than GICs
GuaranteeGuaranteed by the
issuing institution
No guarantee of return
SuitabilitySuitable for
risk-averse investors
Suitable for those seeking higher
returns with moderate risk toleranc

Difference between Forward and Trailing dividend yield

Dividend Yield (Forward) = (Most Recent Dividend * Dividend Frequency) / Price

Forward dividend yield and trailing dividend yield are both measures of a company’s dividend payout to its shareholders, but they differ in the time period used to calculate them.

CIBC Investors' edge

Trailing dividend yield is calculated based on the dividends paid over the past 12 months, divided by the current stock price. It provides an indication of how much a company has paid out in dividends over the past year, relative to its current stock price.

Forward dividend yield, on the other hand, is calculated based on the expected dividends that will be paid out in the future, divided by the current stock price. It provides an indication of how much a company is expected to pay out in dividends over the next 12 months, relative to its current stock price.

The main difference between the two is that forward dividend yield is a projection of what is expected to happen in the future, whereas trailing dividend yield is based on actual historical data. As a result, forward dividend yield can be more speculative and less reliable than trailing dividend yield.

Investors may use both measures in combination to get a more complete picture of a company’s dividend payout.

Investing in the stock market has become increasingly popular over the years, and exchange-traded funds (ETFs) have become a popular way to gain exposure to various markets. Two of the most popular ETFs in Canada are the Vanguard U.S. Total Market Index ETF (VUN) and the Vanguard S&P 500 Index ETF (VFV). While both funds are managed by Vanguard, they differ in terms of their composition and investment strategies. In this article, we will compare VUN vs VFV to help investors decide which one is right for them.

Difference in investments objectives

Composition The VUN ETF aims to track the performance of the CRSP US Total Market Index, which includes approximately 3,500 stocks covering the entire US equity market. This means that VUN provides exposure to both large and small US companies across a variety of sectors.

On the other hand, the VFV ETF aims to track the performance of the S&P 500 Index, which includes 500 of the largest US companies, such as Apple, Microsoft, and Amazon. Therefore, VFV is heavily weighted towards large-cap companies in the US, which can make it more volatile than VUN.

The VUN ETF follows a passive investment strategy, which means it simply aims to replicate the performance of its underlying index. The fund holds a diverse range of US companies and maintains a long-term investment horizon.

The VFV ETF also follows a passive investment strategy, but it invests exclusively in large-cap US companies, making it more focused than VUN. VFV also has a higher concentration of technology stocks compared to VUN, which may be attractive to investors who believe that the tech industry will continue to grow.

Performance comparison VUN vs VFV

cibc investors' edge

Portfolio holdings

VUN

Holding Name% of Market
Value
Sector
Apple Inc.6.09%Computer Hardware
Microsoft Corp.5.27%Software
Amazon.com Inc.2.21%Diversified Retailers
NVIDIA Corp.1.6%Semiconductors
Alphabet Inc.1.52%Consumer Digital Services
Tesla Inc.1.37%Automobiles
Berkshire Hathaway Inc.1.32%Diversified Financial Services
Alphabet Inc.1.29%Consumer Digital Services

Full Review of XEQT: iShares Core Equity ETF Portfolio

XIC vs XIU: Best Canadian Index ETFs

VFV

Holding Name% of Market
Value
Sector
Apple Inc.7.09%Computer Hardware
Microsoft Corp.6.2%Software
Amazon.com Inc.2.66%Diversified Retailers
NVIDIA Corp.1.97%Semiconductors
Alphabet Inc.1.79%Consumer Digital Services
Tesla Inc.1.61%Automobiles
Berkshire Hathaway Inc.1.61%Diversified Financial Services
Alphabet Inc.1.56%Consumer Digital Services

Sector allocation VUN vs VFV

SectorVFVVUN
Information Technology26.10%27.35%
Health Care14.21%13.53%
Financials12.88%10.55%
Consumer Discretionary10.14%14.16%
Industrials8.66%13.27%
Communication Services8.11%2.36%
Consumer Staples7.23%5.52%
Energy4.61%4.70%
Utilities2.87%3.19%
Materials2.64%2.18%
Real Estate2.55%3.21%
VUN vs VFV
cibc investors' edge

When comparing the sector allocation of the Vanguard S&P 500 Index ETF (VFV) to the Vanguard U.S. Total Market Index ETF (VUN), some notable differences are evident. VUN has a higher allocation to the Information Technology sector, with 27.35% compared to VFV’s 26.10%.

VFV also has a higher allocation to the Health Care sector at 14.21% compared to VUN’s 13.53%.

On the other hand, VUN has a higher allocation to Consumer Discretionary and Industrials, with 14.16% and 13.27%, respectively, compared to VFV’s 10.14% and 8.66%. This indicates that VUN provides more exposure to consumer spending and manufacturing sectors in the US economy.

Fees VUN vs VFV

Fees When investing in ETFs, it’s important to consider the fees associated with each fund. The VUN ETF has a management fee of 0.16%, which is slightly lower than the VFV ETF’s management fee of 0.08%. However, VFV has a slightly higher trading volume than VUN, which may make it more attractive to investors who value liquidity.

Conclusion

Conclusion In summary, both VUN and VFV ETFs offer exposure to the US stock market, but they differ in their composition, investment strategy, and fees. VUN provides exposure to a diverse range of US companies, while VFV is heavily weighted towards large-cap companies in the US. Both funds follow a passive investment strategy, but VFV is more focused than VUN. Investors should carefully consider their investment goals, risk tolerance, and investment horizon before deciding which ETF is right for them.

HMAX ETF is a new fund offered by Hamilton ETF. The fund invests in the Canadian banking sector. This fund aims to provide an attractive dividend yield (target 13%) using a covered call strategy. The strategy consists of writing call options on (50% of the portfolio) to collect premiums and maximize monthly distributions. This post discusses the strategy used and compares HMAX to ZWB from BMO (BMO Covered Call Canadian Banks ETF).

Executive summary

hmax review

How HMAX is able to keep such high dividend yield?

HMAX offers the potential for higher monthly income due to two key factors: Firstly, HMAX engages in writing covered call options on about 50% of its portfolio. Secondly, the fund currently writes options At The Money (ATM), which sets it apart from similar funds that write options Out of The Money (OTM).

1- HMAX writes covered call options on 50% of the portfolio

From an investor’s perspective, the initial point indicates that only half of your investment portfolio will be exposed to potential growth. This portion of the portfolio operates under a covered call strategy, where the potential for capital gains is exchanged for a monthly income derived from dividends and option premiums. These premiums are earned whenever the fund sells a call option in the market.

In summary, I view HMAX as a hybrid fund. The first 50% resembles a traditional dividend fund, offering the prospect of receiving dividends and witnessing long-term portfolio appreciation. In contrast, the remaining 50% adopts a more conservative approach, primarily focused on income generation but lacking the potential for portfolio appreciation.

2- The fund is currently writing option At The Money (ATM) whereas similar funds are writing options OTM (Out of The Money).

I encourage you to refer to the table below for a clearer understanding of the second point’s significance. As shown, the HMAX fund has chosen At The Money (ATM) call options due to their superior profitability compared to Out of The Money (OTM) options. In a nutschell, this decision is driven by two critical factors. Firstly, ATM options generate higher premiums than an OTM strategy. However, it’s important to note that this choice comes with an elevated level of risk.

In options trading, risk is closely linked to the likelihood of the option being exercised by the buyer. So, in the case of OTM options, where the strike price exceeds the current stock price, the likelihood of the option being exercised is low. Conversely, with ATM options, where the strike price is very close or identical to the stock’s current price, the possibility of the option being exercised becomes more realistic.

Tables

Premium
or option
price
RiskReward
ITM (In the money call option)
Stock price > Strike price
HighHighHigh
OTM (Out of the money call option)
Stock price < Strike price
CheapLow Low
ATM (At The Money call option)
Stock price = Strike price
MediumMediumMedium
Typical expected result when writing a covered call option
cibc investors' edge

Option premium = Intrinsic value + Time value

ITMATMOTM
INTRINSIC VALUEYESNONO
TIME VALUEYESYESYES

What is the Yield of HMAX?

According to the issuer’s website, the fund has a target yield of 13%. Upon examining the historical dividend payments, it appears that the fund has the potential to achieve, or even surpass, the specified target yield. See below the historical dividend payments made by HMAX. Currently the dividend yield is around 15%.

AmountDividend TypeEx-Div DateRecord DatePay Date
0.1700Regular10/31/202410/31/202411/7/2024
0.1700Regular9/27/20249/27/202410/7/2024
0.1685Regular8/30/20248/30/20249/9/2024
0.1695Regular7/31/20247/31/20248/8/2024

What are the MER Fees for HMAX?

The Management Expense Ratio (MER) for HMAX is not disclosed, but there’s a noted management fee of 0.65%. Given the nature of covered call high yield ETFs, fees tend to run on the higher side and the MER could potentially be above 1%.

HMAX Sector allocation

█  Asset Management 10.6%
█  Banks 70.0%
█  Insurance 20.8%

TICKERNAMEWEIGHT
RYRoyal Bank of Canada22.7%
TDToronto-Dominion Bank17.2%
BMOBank of Montreal11.3%
BNBrookfield Corp11.1%
BNSBank of Nova Scotia10.1%
CMCanadian Imperial Bank of Commerce7.6%
MFCManulife Financial7.1%
SLFSun Life Financial5.1%
GWOGreat-West Lifeco4.8%
IFCIntact Financial4.7

BMO Covered call ETF list – Full comparison

HMAX Total Return

1 Month3 Months1-Year
Total return4.18%12.59%24.36%
Source: Yahoo finance – Monthly total returns

How had Covered call ETF’s performed historically?

In historical contexts characterized by bear markets, range-bound markets, and moderate bull markets, a covered call strategy has typically demonstrated the ability to outperform its underlying securities. However, during robust bull markets, when the underlying securities experience frequent rises beyond their strike prices, covered call strategies have historically exhibited slower growth. Nevertheless, even in these bullish phases, investors typically realize moderate capital appreciation alongside the accrual of dividends and call premiums.

ZWB vs HMAX ETF

Strategy

The ZWB ETF from BMO sells out-of-the-money (OTM) call options on 50% of the stocks. The OTM strategy caps the return of the written positions at the option strike price until the option expires. Generally, for BMO ETFs, option expiries are 1 to 2 months.

ETF% portfolioOption
strategy
Dividend
Yield
ZWB50%OTM6-7%
HMAX50%ATM13%*
Covered call strategy – HMAX vs ZWB; *13% is the target yield

Portfolio allocation

Big Can
Banks
InsuranceAsset
Management
HMAX76.4%14.9%10%
ZWB100%

ZWB (BMO Covered Call Canadian Banks ETF) and HMAX (Horizons Enhanced Income Equity ETF) cater to income-seeking investors but employ different strategies. First, ZWB uses a covered call strategy with out-of-the-money (OTM) options, potentially offering more growth but with a lower management expense ratio (MER) of 0.72%. Second, HMAX, with less than one year of existence and an undisclosed MER, writes at-the-money (ATM) options, aiming for higher immediate income. However, the MER should at the higher end, possibly around 2%. Notably, ZWB concentrates solely on banks, while HMAX offers a bit more diversification by investing in insurance and asset management companies.

cibc investors' edge

Investors must consider their goals: ZWB offers growth potential with lower dividends, primarily focusing on banks. In contrast, HMAX aims for regular and higher income through diversification, although it may come with potentially higher fees. The undisclosed MER for HMAX introduces some uncertainty, and investors should weigh potential dividend income against expected expenses when making their choice.

HMAX vs HYLD

Hamilton ETFs is the issuer of both HYLD and HMAX, but they differ in their focus and objectives. On one hand, the Hamilton Canadian Financials Yield Maximizer ETF, primarily targets Canadian banks, constituting about 75% of its portfolio. And, it aims to provide a high initial monthly yield of over 13%, achieved by writing at-the-money options and maintaining a 50% options coverage ratio. This strategy balances income and potential capital appreciation for investors looking for higher monthly income from the Canadian banking sector.

In contrast, HYLD, the Hamilton Enhanced U.S. Covered Call ETF, focuses on the U.S. equity markets and aims for an overall sector mix that is “broadly similar” to the S&P 500. Indeed, it follows a similar structure to HDIV, designed for attractive monthly income and long-term capital appreciation from a diversified, multi-sector portfolio primarily composed of Canadian covered call ETFs.

While both HYLD and HMAX seek higher monthly income, HMAX concentrates on Canadian banks, whereas HYLD diversifies across U.S. sectors. Investors can choose between them based on their preferred geographical exposure and income objectives.

HMAX vs HCAL

The Hamilton Enhanced Canadian Bank ETF (HCAL) and the Hamilton Enhanced Financials Yield Maximizer ETF (HMAX) offer distinct investment approaches in the financial sector.

HCAL provides exposure to Canada’s “Big Six” banks with 25% leverage, emphasizing growth potential and higher dividends. It also utilizes a mean reversion strategy, historically outperforming equal weight and covered call strategies. HCAL targets monthly distributions, making it appealing to investors seeking growth and income from blue-chip Canadian banks.

In contrast, HMAX focuses on attractive monthly income with a market cap-weighted portfolio of Canadian financial services stocks. It employs an active covered call strategy to reduce volatility and enhance dividend income. HMAX is suitable for investors seeking consistent monthly income, blue-chip financial exposure, tax-efficient distributions, and reduced volatility through options.

For young investors with long-term objectives, I recommend considering the Hamilton Enhanced Canadian Bank ETF (HCAL) due to its growth potential. HCAL allows younger investors to capitalize on the potential for capital appreciation and dividend growth over time. While both HCAL and the Hamilton Enhanced Financials Yield Maximizer ETF (HMAX) have their merits, HCAL’s focus on growth makes it an attractive choice for young investors seeking to build wealth over the long haul.

Videos

review

JEPI ETF REVIEW: JPMorgan Equity Premium Income

HDIF ETF review: Harvest Diversified Monthly Income ETF

HMAX NAV

Net Asset Value (NAV) is a financial term. It mean the total value of all the assets held by an exchange-traded fund (ETF) after subtracting its liabilities. In simpler terms, NAV reflects the underlying value of the ETF’s portfolio, including all the stocks, bonds, or other assets it holds, minus any expenses and debts it owes.

Frequently asked questions

Is HMAX a good investment?

To sum up, HMAX provides a well-rounded investment approach, offering a blend of growth potential and income. However, it’s essential to note that the use of At The Money (ATM) options adds a heightened level of risk. This ETF is ideal for investors comfortable with a hybrid strategy, particularly those seeking monthly income through a long-term buy-and-hold approach. Prospective investors should be aware of potential tax implications associated with dividend income. Before considering HMAX, it’s crucial to evaluate your risk tolerance, investment objectives, and alignment with the hybrid approach. Additionally, be mindful that covered call ETFs, including HMAX, can exhibit volatility and move in tandem with the underlying assets they track.

For young investors aiming for growth, a classic dividend ETF like ZEB may be a more suitable option, capitalizing on the growth potential of the banking sector. If you lean towards dividends but still want to capture 100% of the growth potential in the Canadian banking sector, ETFs such as HCAL or FIE might be better alternatives.

How often does HMAX pay dividends?

HMAX pays Dividends monthly.

Investment objective

The BMO Canadian High Dividend Covered Call ETF (ZWC)  has been designed to provide exposure to a dividend focused portfolio, while earning call option premiums. The underlying portfolio is yield-weighted and broadly diversified across sectors.

cibc investors' edge

The fund selection methodology uses 4 factors: – Liquidity; – Dividend growth rate; – Yield and payout ratio.

What’s a covered call ETF?

What’s unique about this ETF is that it uses covered calls to protect against downside risk. This being said, the covered call strategy provides limited downside protection. Also, when you write a covered call, you give up some of the stock’s potential gains. These ETFs will tend to have a higher yield and a lower performance.

ZWC is an excellent option for conservative investors looking for a steady income and low volatility. It’s tax-efficient because the dividends are all coming from Canadian companies. The financial sector and Energy represents 53% of the total overall sector allocation.

Please consult our recent post comparing ZWC with other popular High Dividend ETFs in Canada.

Historical performance

ETFDiv
Yld
ZWC6.80%

Historical performance updated daily

Best US Dividend ETFs in Canada (2023)!

ZWC MER

ETFMER*
%
ZWC – BMO CDN High
Div Covered Call
0.72

Top 10 Best Growth ETF in Canada!

XIC vs XIU: Best Canadian Index ETFs

ZWC Stock Profile

Updated daily

ZWC Stock 52 weeks high and low

Updated daily

ZWC Dividend history

AmountDividend TypeEx-Div DateRecord DatePay DateDeclare Date
0.1000Regular6/27/20246/27/20247/3/20246/20/2024
0.1000Regular5/30/20245/30/20246/4/20245/23/2024
0.1000Regular4/26/20244/29/20245/2/20244/19/2024
0.1000Regular3/27/20243/28/20244/2/20243/20/2024
cibc investors' edge

ZWC ETF Holdings

Company NameAllocation
Canadian National Railway Co5.4%
BCE Inc5.2%
TELUS Corp5.1%
Enbridge Inc5.0%
Royal Bank of Canada5.0%
Canadian Imperial Bank of Commerce4.9%
Bank of Nova Scotia4.7%
The Toronto-Dominion Bank4.6%
Manulife Financial Corp4.3%
Please consult issuers’ website for up-to-date data

Similar ETFs

NameDiv
yield
MER
High Dividend Yield (Diversified)
ZWC – BMO CDN High Div Covered Call6.630.72
HDIV -Hamilton Enhanced Multi-Sector Covered Call9.58na
HDIF -Harvest Diversified Monthly Income ETF10.05na
ZWH – BMO US High Dividend Covered Call5.580.71
ZWS – BMO US High Dividend Covered Call Hedged to CAD5.630.71
High Dividend Yield (Europe)
ZWE – BMO Europe High Div CC CAD Hedge6.370.71
ZWP – BMO Europe High Div Cov Call6.480.71
High Dividend Yield (Sector Focused)  
LIFE – Evolve Global Healthcare Enhance Yld6.420.68
CALL – Evolve US Banks Enhanced Yield6.480.69
LIFE-B – Evolve Global Healthcare Enhance Yld Unheg5.880.68
FIE – Ishares CDN Fin Mthly Income5.850.89
HPF – Harvest Energy Leaders Plus Income4.431.71

VFV and VGG are two popular ETFs that offer different approaches to investing in stocks. In this post, we will explore the intricacies of both funds, from their investment objectives to fees, helping you understand how they might fit into your investment strategy (VGG vs VFV).

cibc investors' edge

Investment Objective VGG vs VFV

VFV (Vanguard S&P 500 Index ETF) aims to track the performance of the S&P 500 Index. This index represents 500 of the largest U.S. companies, spanning various industries. Investors in VFV gain exposure to some of the biggest and most influential firms in the United States. The primary goal is to mirror the return of the S&P 500, less expenses.

On the other hand, VGG (Vanguard U.S. Dividend Appreciation Index ETF) focuses on U.S. companies that have a history of increasing their dividends over time. Instead of mirroring the broader market like VFV, VGG targets companies that are likely to grow their dividends. This strategy can appeal to investors seeking steady income growth and a focus on companies with potential for long-term value.

Suitability

When considering VFV, it’s suitable for investors looking for broad exposure to the U.S. equity market, particularly the large-cap sector. It’s well-suited for those who believe in the long-term growth potential of the largest U.S. companies and prefer a passive investment strategy.

VGG is more suitable for investors seeking income growth along with capital appreciation. If you prioritize dividend growth and companies with a stable, increasing dividend policy, VGG might be more appealing. It’s often favored by those planning for retirement or who want a steady income stream from their investments.

Historical performance

Dividend VGG vs VFV

VFV’s dividend yield 1.29% reflects the overall yield of the S&P 500. While it includes high-yielding companies, the focus isn’t specifically on dividends. The yield might be lower compared to specialized dividend funds, but it offers the growth potential of the S&P 500’s large-cap stocks.

In contrast, VGG specifically targets companies that have a track record of growing their dividends. Therefore, its dividend yield might be attractive to those seeking regular income (1.50%). The emphasis is on dividend growth, which can lead to higher income over time as companies increase their payouts.

Taxation of Dividends VGG vs VFV

cibc investors' edge

For Canadian investors focusing on VFV and VGG, understanding the tax treatment of dividends from these U.S.-based ETFs is crucial. Dividends paid by U.S. companies to foreign investors are generally subject to a withholding tax. For Canadians, the rate is typically 15% due to the Canada-U.S. tax treaty. This means when dividends are paid out from these ETFs, a portion is withheld as tax by the U.S. before they reach the investor.

if held in non registered accounts

However, the type of account you hold these ETFs in can affect the taxation of dividends. If you hold VFV or VGG in a non-registered account, the 15% U.S. withholding tax applies, and you’ll receive the net amount. This tax can often be claimed as a foreign tax credit on your Canadian tax return, preventing double taxation.

if held in a registered accounts

On the other hand, if you hold these ETFs in a registered account like an RRSP, the situation differs. Due to the specific nature of the tax treaty between Canada and the U.S., the withholding tax on dividends may be waived for investments held in RRSPs, recognizing them as retirement savings. This makes RRSPs an attractive option for holding U.S. equities or ETFs like VFV and VGG, as it can increase the net dividend income you receive.

For investments held in a TFSA or other registered accounts not recognized for the tax treaty benefit, such as a RESP or RDSP, the 15% withholding tax generally still applies and is not recoverable. It’s important to consider the type of account when making investment decisions to optimize the tax efficiency of your U.S. equity investments.

Consulting with a tax professional or financial advisor is recommended to understand the full implications based on your personal investment situation and to make informed decisions. They can provide advice tailored to your circumstances, including how to structure your investments and navigate the tax implications effectively.

Fees VGG vs VFV

When it comes to fees, VFV is known for its low-cost approach, which is a hallmark of Vanguard’s offerings (0.09% MER). The management fee for VFV is relatively low, making it an attractive option for those who want to minimize costs. Lower fees mean that more of your investment goes towards market returns rather than administrative costs.

Similarly, VGG also benefits from Vanguard’s commitment to low fees. However, the nature of the dividend-focused strategy might lead to slightly different cost structures compared to VFV (MER 0.30%). Investors should compare the management expense ratios (MERs) and any additional costs associated with trading or holding these ETFs to understand the total cost of ownership.

Conclusion

In choosing between VFV and VGG, consider your financial goals, risk tolerance, and investment strategy. VFV offers broad exposure to the U.S. equity market with a focus on large-cap growth, while VGG targets dividend growth and may suit those looking for income along with capital appreciation. Be mindful of the dividend yields, tax implications, and fees associated with each ETF.

As with any investment, it’s crucial to conduct thorough research or consult with a financial advisor to understand how these ETFs fit into your overall portfolio. Whether you prefer the wide market approach of VFV or the dividend growth strategy of VGG, both ETFs provide avenues for participating in the U.S. stock market with the added benefits of ETF investing. Remember, investing always involves risks, and it’s important to align your choices with your personal investment objectives and risk tolerance.

Dividend kings are stocks with an unparalleled track record of increasing their dividends over time. The minimum requirement to be considered in this elite list is 50 years of dividend increases. In this post, we will present these stocks by sector. We will also provide, for each stock, the current dividend yield, payout ratio, and dividend growth rate of the past five years.

The list below is a good start for any dividend investor to pick from the best dividend stocks. As you can see below, the list is dominated by consumer defensive stocks and some industrial heavy weights. It’s no surprise. For a company to pay and increase dividends for over 50 years, it has to operate in sectors that can weather difficult times or be dominant in its industry.

S&P 500 dividend aristocrats: full list by sector

10 Best Covered Call ETF Canada – High dividend yield

Investing in dividend-paying stocks

Investing in dividend paying stocks is a strategy that appeals to young and old investors. Here is a quick reminder of the main concepts to keep in mind before applying this strategy:

Investment horizon: 5 years or more minimum. The strategy of investing in dividend paying stocks is not suitable for an investor with a short term horizon (less than 5 years).

Objective: The strategy can help you build passive income or further grow your capital by reinvesting the dividends received.

Risk Tolerance: Medium (provided you restrict yourself to selecting quality securities and having a diversified portfolio across several sectors).

Why invest in Dividend Kings

If you are asking yourself, what is the typical profile of a dividend king stock? I have listed some common characteristics below:

Dividend kings tend to dominate their industry

• The vast majority are companies that are well established in their sector. They manage to generate significant profits thanks to their comfortable position against the competition. They also sometimes operate in regulated markets such as electric utilities with almost no competition;

Safe heaven during turbulent times

• “Dividend kings” are sometimes considered by the financial market as safe havens in the event of a market correction or decline. Indeed, dividend aristocrats are generally less volatile than the market, and there are less targeted by speculators;

Strong financial statements

• “Dividend kings” will tend to have a better financial situation in terms of liquidity than the rest of the market. Their levels of liquidity or debt are generally better than the rest of the market;

Limited growth but there are exceptions

• In general, dividend aristocrats are mature businesses. That is, the growth potential is quite limited. However, some companies can pay dividends and invest in their growth. Usually, the dividend payout ratio is a good indicator. If the rate is low, it means the business is saving some money to grow. Business with high dividend pay out ratio have no financial resources left to grow.

Financial Services

Number of Consecutive Years of Dividend Increases DGR Streak

Financials

DIVIDEND KINGTICKERDIVIDEND INCREASE STREAK
Cincinnati FinancialCINF63
Farmers & Merchants BancorpFMCB59
Commerce BancsharesCBSH56
S&P GlobalSPGI51
United BanksharesUBSI50

Dividend yield and Payout ratio

Updated daily

Industrials

number of Consecutive Years of Dividend Increases DGR Streak

DIVIDEND KINGTICKERDIVIDEND INCREASE STREAK
Dover CorporationDOV68
Parker HannifinPH68
Emerson ElectricEMR67
NordsonNDSN60
ABM IndustriesABM57
Stanley Black & DeckerSWK56
StepanSCL56
MSA SafetyMSA54
Illinois Tool WorksITW53
W.W. GraingerGWW53
PPG IndustriesPPG52
TennantTNC52
NucorNUE51
The Gorman-Rupp CompanyGRC51
ADMADM51
RPM InternationalRPM50

Dividend yield and Payout ratio

Updated daily

CIBC investors' edge

Consumer defensive

number of Consecutive Years of Dividend Increases DGR Streak

DIVIDEND KINGTICKERDIVIDEND INCREASE STREAK
Genuine PartsGPC68
Procter & GamblePG68
Coca-ColaKO62
KenvueKVUE61
Lancaster ColonyLANC61
Colgate-PalmoliveCL61
Hormel FoodsHRL58
SyscoSYY55
Altria GroupMO54
Universal CorporationUVV53
TargetTGT52
Kimberly-ClarkKMB52
PepsiCoPEP52
Lowe’sLOW51
Tootsie Roll IndustriesTR51

Dividend yield and Payout ratio

Updated daily

Energy

Dividend yield and the number of Consecutive Years of Dividend Increases DGR Streak

Energy

DIVIDEND KINGTICKERDIVIDEND INCREASE STREAK
National Fuel GasNFG53

Dividend yield and Payout ratio

Updated daily

Utilities

number of Consecutive Years of Dividend Increases DGR Streak

DIVIDEND KING TICKER DIVIDEND INCREASE STREAK
 American States Water AWR69
 Northwest Natural Holding NWN68
 California Water Service Group CWT57
 SJW Group SJW56
 Black Hills Corp. BKH54
 Canadian Utilities CDUAF 52
 Consolidated Edison ED50
 Fortis Inc. FTS50
 Middlesex Water MSEX50

Dividend yield and Payout ratio

Updated daily

Real estate (Reits)

Dividend yield and the number of Consecutive Years of Dividend Increases DGR Streak

DIVIDEND KINGTICKERDIVIDEND INCREASE STREAK
Federal Realty Investment TrustFRT56

Dividend yield and Payout ratio

Updated daily

Updated daily

Healthcare

DIVIDEND KINGTICKERDIVIDEND INCREASE STREAK
Johnson & JohnsonJNJ62
AbbVieABBV52
Becton, Dickinson & Co.BDX52
Abbott LabsABT52

Dividend yield and Payout ratio

Updated daily

Basic materials

Materials

DIVIDEND KINGTICKERSECTORDIVIDEND INCREASE STREAK
H.B. FullerFULMaterials55

Dividend yield and Payout ratio

Updated daily

or investors who lack the time to track and analyze the market, an all-in-one ETF like XEQT (iShares Core Equity ETF Portfolio) is an excellent choice. Here’s why XEQT stands out:

Simplified Diversification

XEQT provides instant diversification by combining multiple asset classes into a single fund. This ETF offers exposure to a diversified mix of global equities, ensuring that investors gain balanced market exposure without the need to select and manage each component individually.

Passive Management and Low Costs

XEQT is passively managed, meaning it follows a predefined index. This approach reduces management fees compared to actively managed funds, thereby increasing net returns for investors. Additionally, choosing XEQT helps investors avoid the costs associated with buying and selling multiple individual funds.

Automatic Rebalancing

XEQT automatically rebalances its portfolio to maintain target asset allocations. This ensures that the portfolio remains aligned with the investor’s risk and return objectives without requiring constant oversight. For busy investors, this is a significant advantage, as they can stay optimally invested without daily market monitoring.

Accessibility and Simplicity

XEQT simplifies the investment process significantly. With a single purchase, investors obtain a comprehensive portfolio solution. This simplicity is particularly appealing for new investors or those who prefer a “set it and forget it” approach while aiming to optimize long-term returns.

In this review, we will delve deeper into the features, benefits, and performance of XEQT, exploring why it might be the right choice for your investment portfolio.

XEQT Objective

The primary objective of XEQT ETF is to provide investors with exposure to a globally diversified portfolio of equity securities. The fund’s holdings are spread across various countries and industries, providing investors with a broad-based exposure to the global equity markets. XEQT invests in a range of equity securities, including large-cap, mid-cap, and small-cap stocks, providing investors with exposure to different market segments. This diversification can help to reduce volatility in the portfolio and improve long-term returns.

cibc investors' edge

Why All-in-one ETFs are so popular?

All-in-one ETFs have gained popularity among Canadian investors in recent years, and for good reason. These ETFs provide Canadian investors with a simple and easy way to invest in a diversified portfolio of assets without the need to spend time and effort researching and selecting individual securities.

One of the primary benefits of all-in-one ETFs for Canadian investors is convenience. With one-ticket ETFs, investors can access a diversified portfolio of assets with just one investment, making it easy to build a well-rounded investment portfolio. This convenience is particularly attractive for Canadian investors who may not have the time, expertise, or resources to actively manage their investments.

Another key advantage of all-in-one ETFs for Canadian investors is low cost. These ETFs typically have low management fees compared to traditional mutual funds, which means that investors can keep more of their returns and achieve their investment goals more quickly. This is especially important for Canadian investors who are looking to maximize their returns while minimizing their costs.

Diversification is also a critical benefit of all-in-one ETFs for Canadian investors. By holding a mix of stocks, bonds, and other securities, these ETFs can help to reduce risk and volatility in a Canadian investor’s portfolio. This diversification can help investors achieve a balance between risk and return that is appropriate for their investment objectives and risk tolerance, which is particularly important in today’s volatile market environment.

XEQT Stock Profile

Updated daily

XEQT Stock 52 weeks high and low

CIBC investors' edge

Performance comparison with similar ETFs

XEQT vs Robo-advisors

Comparison with Robo-Advisors XEQT ETF can be seen as an alternative to robo-advisors, which are automated investment platforms that use algorithms to build and manage investment portfolios for clients. While both XEQT and robo-advisors aim to provide investors with low-cost, diversified investment options, there are some key differences between the two.

One of the main differences between XEQT and robo-advisors is the level of customization available to investors. Robo-advisors typically offer investors a range of pre-built portfolios that are designed to meet different risk profiles and investment objectives. While investors can choose from these pre-built portfolios, they generally have less control over the specific investments held in their portfolio.

In contrast, XEQT ETF provides investors with exposure to a broad-based portfolio of global equity securities. While investors do not have control over the specific holdings in the fund, they benefit from the diversification provided by the fund’s holdings across different countries and industries.

Another key difference between XEQT and robo-advisors is the level of fees charged. While XEQT ETF charges a low management fee of 0.20%, robo-advisors typically charge higher fees, ranging from 0.25% to 0.50% or more. While the fees charged by robo-advisors may include additional services such as financial planning and portfolio rebalancing, they can significantly impact long-term investment returns.

XEQT vs VEQT

Regarding net assets, VEQT has a higher net asset value than XEQT, which indicates that VEQT has more assets under management than XEQT. This can potentially result in greater liquidity and lower trading costs for investors who choose to invest in VEQT.

Both XEQT and VEQT have similar historical performance, with XEQT having a slightly higher YTD return and similar 3-year average return compared to VEQT.

XEQTFund
United States43.79
Canada24.00
Japan5.88
United Kingdom3.75
France2.75
Switzerland2.53
Australia2.08
Germany2.02
China1.72
Netherlands1.20

VEQTFund
United States of America42.5%
Canada30.2%
Japan4.5%
United Kingdom3.1%
China2.5%

When it comes to geographic allocation, both XEQT and VEQT have significant exposure to the US and Canada, but XEQT has a higher allocation to the US than VEQT. Additionally, XEQT has more exposure to Japan, the UK, and Europe compared to VEQT, while VEQT has a higher allocation to China. The difference in geographic allocation may be important for investors who have specific investment objectives or concerns about particular regions.

Finally, when looking at holdings, both XEQT and VEQT have similar numbers of holdings and offer similar dividend yields. However, there are some differences in the specific holdings and weightings of those holdings. XEQT has a higher weighting in US total market index and a lower weighting in Canadian holdings, while VEQT has a higher weighting in Canadian holdings and a lower weighting in US holdings.

Additional source of info

In the realm of Canadian Exchange-Traded Funds (ETFs), two notable options are VUN (Vanguard U.S. Total Market Index ETF) and VEQT (Vanguard All-Equity ETF Portfolio). Each fund caters to different investment strategies and goals, and understanding their nuances is key to determining which might be a better fit for individual investors (VUN vs VEQT).

Fund Overview and Composition

Starting with VUN, this fund aims to replicate the performance of the CRSP US Total Market Index. It provides a comprehensive exposure to the entire U.S. equity market, encompassing a wide range of stocks from small, mid, to large-cap growth and value companies. In contrast, VEQT focuses on long-term capital growth by primarily investing in equity securities. It stands out as an all-equity fund, holding a diversified portfolio of global stocks. This includes equities from Canada, the U.S., and various international markets.

Geographical Exposure and Diversification

The geographical exposure and diversification of these two ETFs vary significantly. VUN is exclusively focused on the U.S. market, offering investors a channel to gain exposure to the U.S. economy and its diverse sectors. On the other hand, VEQT provides a more global reach, with significant investments in North America, Europe, Asia, and emerging markets. This global diversification enables VEQT to spread its investments across different economies and market conditions.

Risk and Return Profile VUN vs VEQT

When it comes to the risk and return profile, VUN’s performance and risk are closely tied to the U.S. stock market. Its focus on the U.S. market means potentially less diversified risk compared to VEQT. VEQT, with its global diversification, can potentially reduce country-specific risks. This broad diversification may lead to a more balanced risk-return profile over the long term.

Investment Strategy

From an investment strategy perspective, VUN is ideal for investors whose focus is on U.S. market growth. It is well-suited for portfolios that need U.S. equity exposure to complement other international holdings. Conversely, VEQT is designed for those seeking broad, diversified global equity exposure in a single ETF. It can serve as a standalone option for long-term growth in a diversified portfolio.

Dividend Yield Considerations

Dividend yields also differ between these two ETFs. VUN provides a dividend yield that mirrors the average of the U.S. market, catering to investors looking for U.S.-sourced income. VEQT, however, offers a composite dividend yield from its global holdings, with the yield varying depending on the dividend policies of different global markets.

Expense Ratios and Fees VUN vs VEQT

Regarding expense ratios and fees, VUN (MER= 0.17%) typically features a low expense ratio, characteristic of Vanguard ETFs, making it cost-efficient for those specifically seeking U.S. market exposure. VEQT (MER= 0.22%) might have a slightly higher expense ratio due to its global diversification, yet the fee remains competitive given its broad global exposure.

Conclusion: Choosing Between VUN and VEQT

In conclusion, the choice between VUN and VEQT largely hinges on an investor’s specific investment goals, risk tolerance, and desired market exposure. VUN stands out for those seeking concentrated U.S. market exposure, while VEQT appeals to investors looking for a globally diversified portfolio. Both ETFs offer distinct advantages, and the most suitable choice varies based on individual portfolio needs and long-term investment strategies.