The Canada Pension Plan (CPP) is a vital component of Canada’s social security system, providing financial support to retired and disabled individuals, as well as their surviving beneficiaries. If you’re eligible for CPP benefits or are planning your retirement, it’s essential to stay informed about the payment dates and other key details. In this post, we’ll provide an overview of CPP payment dates for 2023 and some essential information about the program.
What is CPP?
The Canada Pension Plan is a contributory, earnings-related social insurance program that provides financial assistance to Canadians in retirement, disability, or upon the death of a contributor. Workers and their employers make contributions to the CPP throughout their working years, building up a fund that pays out benefits when needed.
CPP Payment Dates 2023:
CPP payments are typically made on a monthly basis, and the payment dates for 2023 are as follows:
January 27, 2023
February 24, 2023
March 29, 2023
April 26, 2023
May 26, 2023
June 28, 2023
July 27, 2023
August 29, 2023
September 27, 2023
October 27, 2023
November 28, 2023
December 21, 2023
Please note that these dates are subject to change, so it’s a good idea to check with Service Canada or visit their website to confirm the payment schedule.
Types of CPP Benefits:
The CPP offers several types of benefits, including:
Retirement Pension: This is the most common benefit, providing income to individuals who have contributed to the CPP and are at least 60 years old.
Disability Benefits: Available to those who have contributed to the CPP and are unable to work due to a severe and prolonged disability.
Survivor’s Pension: Paid to the surviving spouse or common-law partner of a deceased CPP contributor.
Children’s Benefits: These benefits are available for dependent children of CPP contributors who are disabled or deceased.
Death Benefits: A one-time payment to the estate of a deceased CPP contributor.
How to Apply for CPP Benefits: To apply for CPP benefits, you can do so online through the Service Canada website or by filling out a paper application. It’s advisable to apply well in advance of when you want to start receiving benefits, as the processing time can vary.
Should You Take Your CPP At Age 60, 65, Or 70?
Deciding when to begin receiving your Canada Pension Plan (CPP) benefits—whether at age 60, 65, or 70—requires careful consideration of several factors. First and foremost, assess your immediate financial needs. If you require income to cover essential expenses, taking CPP benefits at age 60 may be necessary.
Secondly, take into account your health and life expectancy. If you anticipate a longer life, delaying CPP benefits can result in larger monthly payments over the long term. Conversely, if you have health concerns or a family history of shorter lifespans, taking benefits earlier might be wiser.
Your employment status matters as well. If you plan to continue working, note that benefits claimed before your full retirement age may be reduced if your earnings surpass a certain threshold. After reaching your full retirement age (usually 65 or 67, depending on your birth year), this reduction no longer applies.
Consider your spouse or partner too; the survivor’s pension is crucial for them. Taking CPP benefits later can lead to a more substantial survivor’s pension.
One of the primary benefits of deferring your Canada Pension Plan (CPP) benefits is the potential to receive a larger monthly payment. When you apply for CPP at the standard age, typically around 65, you will receive the full, unreduced pension amount. However, if you choose to apply for CPP early at age 60, your monthly payment will be reduced.
The reduction in payments for taking CPP early is based on the number of months you receive benefits before your standard retirement age. Each month you take CPP before your standard retirement age, your benefit is reduced by a certain percentage. Conversely, for every month you delay CPP after your standard retirement age, your benefit increases.
By deferring CPP benefits, you effectively invest in a higher monthly income later in your retirement years. This can be advantageous if you anticipate a longer life expectancy or if you have other sources of income to cover your expenses during the early years of retirement.
Conclusion:
The Canada Pension Plan is a crucial support system for Canadians in retirement, disability, and during times of loss. Knowing the CPP payment dates for 2023 and understanding the different types of benefits available can help you plan your finances and ensure you receive the support you need. Stay informed, apply on time, and make the most of this important program to secure your financial future.
In the realm of investment opportunities, Index ETFs have gained prominence as a prudent choice for a diverse range of investors. This comprehensive guide aims to delve into the specifics of three offerings from Horizons: HXT Horizons S&P/TSX 60™ Index ETF, HXS.U Horizons S&P 500® Index ETF and the HXQ Horizons NASDAQ-100® Index ETF. Let’s objectively examine the fundamentals, objectives, and market positioning of these ETFs.
Before delving into the particulars of HXT and HXS.U, it’s essential to understand the rationale behind the increasing inclination towards Index ETFs. These investment instruments offer diversification, cost-effectiveness, and liquidity, making them an appealing option for investors of varying experience levels. The ability to replicate the performance of a specific index provides broad market exposure.
S&P/TSX 60
The S&P/TSX 60 is a benchmark index comprised of the 60 most significant companies listed on the Toronto Stock Exchange (TSX). These companies, collectively representing a diverse array of industries, are selected based on their market capitalization, making the index a reliable gauge of the overall performance of the Canadian stock market.
S&P 500®
The S&P 500 stands as a preeminent benchmark index in the realm of U.S. equity markets. Comprising 500 of the most prominent publicly traded companies, this index is representative of the American business landscape. Inclusion in the S&P 500 is based on various factors, with market capitalization being a pivotal criterion. As a result, the S&P 500 provides investors with exposure to the broader U.S. stock market.
NASDAQ-100®
The NASDAQ-100® Index holds a distinctive position as a premier benchmark in the world of technology and innovation. Comprised of 100 non-financial companies listed on the NASDAQ stock exchange, this index is renowned for its focus on the forefront of technological advancement.
Notable constituents include giants like Apple, Microsoft, Amazon, Alphabet (Google’s parent company), Facebook, and Tesla. These companies are leaders in sectors such as technology, e-commerce, electric vehicles, and entertainment.
HXT Horizons S&P/TSX 60™ Index ETF
Objective: HXT seeks to replicate, to the extent possible, the performance of the S&P/TSX 60™ Index (Total Return), net of expenses. Established on September 14, 2010, this ETF is crafted to gauge the performance of the large-cap segment in the Canadian equity market.
With a steadfast focus on the Canadian equity market, HXT strategically allocates across sectors, emphasizing financials, energy, and industrial services. The ETF’s inception in 2010 underscores its track record in mirroring the S&P/TSX 60™ Index’s performance.
HXS.U Horizons S&P 500® Index ETF
Objective: HXS seeks to replicate, to the extent possible, the performance of the S&P 500® Index (Total Return), net of expenses. Established on November 30, 2010, this ETF is designed to measure the performance of the large-cap segment in the U.S. equity market.
As a significant player in the U.S. equity market, HXS.U distinguishes itself with a focus on sectors like Information Technology and Health Care. The ETF, established in 2010, offers investors access to the dynamic landscape of the S&P 500® Index.
HXQ Horizons NASDAQ-100®
HXQ aims to mirror the performance of the NASDAQ-100® Index (Total Return), factoring in expenses. The NASDAQ-100® Index (Total Return) comprises 100 leading nonfinancial companies from both domestic and international markets listed on The NASDAQ Stock Market. The objective of HXQ is to deliver a return that closely aligns with the aforementioned index after accounting for costs. This implies that investors in HXQ can potentially gain exposure to the diverse set of major companies within the NASDAQ-100, capturing the combined movements of these influential entities.
In conclusion, HXT Horizons S&P/TSX 60™ Index ETF, HXS.U Horizons S&P 500® Index ETF and HXQ Horizons NASDAQ-100® emerge as compelling options in the Index ETF landscape. As investors navigate market complexities, these ETFs offer simplicity, diversification, and the potential for long-term growth. Understanding their objectives, historical performance, and sector allocations empowers investors to make informed decisions aligned with their financial goals. Whether considering the Canadian or U.S. equity market, Horizons’ Index ETFs present an opportunity to participate in the growth of large-cap segments with strategic sector exposure.
VEE ETF Investment objective
For Canadian investors seeking to diversify their portfolio, the Vanguard FTSE Emerging Markets All Cap Index ETF offers a valuable opportunity. This ETF aims to mirror the performance of a comprehensive emerging markets index, including the rapidly growing Chinese A Inclusion market. It provides exposure to a wide spectrum of companies, encompassing large, mid-sized, and small-cap stocks, all within emerging markets. By investing directly or indirectly in these assets, Canadian investors can enhance their portfolio’s diversification and tap into the potential growth opportunities presented by emerging markets.
FTSE Emerging Markets All Cap China A Inclusion Index
The FTSE Emerging Markets All Cap China A Inclusion Index is a market-capitalization weighted index that tracks the performance of stocks across various market segments, including large, mid, and small-cap stocks within emerging markets.
The FTSE Emerging Markets All Cap China A Inclusion Index encompasses a diverse set of attributes, making it a compelling option for investors. With a substantial number of constituents totaling 4,535, this index provides broad exposure to emerging market opportunities. The impressive Net Market Capitalization (USDm) of 7,051,011 demonstrates the significant market value represented within the index.
Moreover, the index showcases an attractive dividend yield of 2.78%, offering the potential for income generation. When examining constituent sizes, the index maintains a healthy level of diversity. The average constituent size, at 1,555 USDm, signifies a well-rounded mix of companies, while the largest constituent, at 413,744 USDm, adds stability without overwhelming the index. Even the smallest constituent at 3 USDm contributes to the index’s inclusivity.
The median size of 298 USDm further emphasizes the balanced nature of the index’s constituents. Additionally, the weight of the largest constituent, comprising 5.87% of the index, remains reasonable, preventing an excessive concentration of risk.
The fact is checking your credit score is a soft inquiry that does not have any impact on your score. I personally check my credit score at each update which is monthly. It’s a great habit.
How to obtain a free credit report?
Go to Borrowell* They offer a free credit report for all Canadians. You will be able to access your Equifax full report in minutes.
Also Borrowell site includes an educational blog called (Credit coach). The free blog discusses how to improve your credit score.
What is a good score?
See the table score for Equifax:
Equifax score
Interpretation
From 580 to 669
Fair
670 to 739
Good
Above 740 to 799
Very good
Above 800
Excellent
What a good score really means?
A good score means you manage well your debt. In other words:
You pay on time your credit card if possible in full;
Second, You don’t apply too much for credit (for instance applying for credit cards frequently for bonus offers or travel points can dammage your credit score even if you intend to close the card in the short term)
You carry a balance that is managable for you, not maxing your credit cards. Actually a balance above 30% of the your approved credit card limit is not good for your score. You have to keep the balance low and pay more than just the minimum required
Pay your balance even if it’s one cent. I was once looking at my credit report and noticed a late payment warning for 2 cents! I called the bank and the rep advised me that there is no difference between one thousand dollar or 1 cent balance, if you’re late it will be noted in your credit report
Always keep the first credit card you ever opened. This a major factor in determining your score, the more the system can go back in time, the more trust is put into your credit worthiness
Is a good score enough to get you approved for a mortgage?
It’s a good start however not enough.The bank will ask you to provide for the past two year:
Your income tax returns
Account where you deposited your savings so they can see you have the minimum required of 5% to own a home
Your last paystub
Proof of any other income
The bank will then analyse you capacity to reimburse your new mortgage knowing all the information they collected about you.
What does a credit report look like?
On the Borrowell website, beside the score, the report will show your personal information and all your accounts whether chequing accounts or investment accounts. All you credit cards and loans will be shown.
Next to each account, you will have the date it was opened and if it’s still active or not and the balance (with the monthly payment if applicable). You will also see notes your bank adds into your credit report.
What to watch for in my credit report?
Error in your mame or address;
accounts that show active event hough you closed them;
Notes left by your bank that are not accurate.
*The Asterix is a reference to an affiliate marketing link. I promote the use of Borrowell services in exchange of a small commission. I recommend only services that I used and satified with.
Investors navigating the world of Exchange-Traded Funds (ETFs) in Canada are often on the lookout for opportunities that align with their financial goals and risk preferences. In this comprehensive guide, we’ll delve into the realm of Index ETFs, specifically those tracking three influential indices: the S&P 500, NASDAQ 100, and the TSX. But first, let’s demystify the concept of Index ETFs. These funds have gained prominence for their ability to replicate the performance of specific market indices, offering investors a diversified and cost-effective approach to gaining exposure to various sectors and regions. In this blog post, we’ll not only unravel the essence of Index ETFs but also present a curated list of the best Canadian ETF funds, categorized by the indices they track.
Why Investors Favor Index ETFs?
Index ETFs directly compete with growth mutual funds, which charge management fees exceeding 2%, and in some cases, reaching 4%. When banks marketed mutual funds, they emphasized active and professional management with the goal of outperforming the benchmark they replicate. Over time, it became evident that the overwhelming majority of fund managers fail to beat the benchmark.
As Warren Buffet has indicated on several occasions, “Beating the index in the long term is very difficult, even for professionals.” A manager may outperform the index in the short term, but to beat it over the long term, they must anticipate the market for 10 years, a feat that approaches the miraculous.
S&P 500
The S&P 500, or the Standard & Poor’s 500, is a market-capitalization-weighted index of the 500 largest publicly traded companies in the United States.
The S&P 500 is an excellent index as most of its constituents are large, well-established American companies, providing diversification across various sectors of the U.S. economy. Widely considered the best measure of the performance of large-cap U.S. stocks, it can be easily used to express an opinion on the overall U.S. economy. In other words, if you are optimistic about the long-term performance of the U.S. economy, it’s likely the best index for you.
All ETFs replicating the performance of the S&P 500 will have the same securities in their assets and in approximately the same proportions as the index itself.
S&P 500 Portfolio and Sector Allocation
Title
Weighting (%)
Apple Inc.
5.72
Microsoft Corporation
5.25
Amazon.com Inc.
3.98
Facebook Inc. Class A
2.11
Alphabet Inc. Class A
1.84
Alphabet Inc. Class C
1.78
Tesla Inc
1.52
Berkshire Hathaway Inc. Class B
1.45
JPMorgan Chase & Co.
1.43
Johnson & Johnson
1.27
S&P 500 Official Website
S&P 500 Sector Allocation
Information Technology: 27.60%
Health Care: 13.44%
Consumer Discretionary: 12.70%
Communication Services: 10.79%
Financials: 10.34%
Industrials: 8.47%
Consumer Staples: 6.55%
Utilities: 2.73%
Nasdaq 100
The Nasdaq-100 is one of the leading large-cap growth indices globally, consisting of 100 of the largest non-financial national and international companies listed on the Nasdaq based on their market capitalization. This index is dominated by companies in the information technology sector.
S&P/TSX 60
An index composed of the 60 largest companies on the Toronto Stock Exchange, dominated by the energy and financial sectors.
S&P/TSX Capped Composite Index
This index includes over 200 top Canadian stocks, representing approximately 95% of the Canadian stock market. Constituent securities must meet minimum float-adjusted criteria and liquidity to be eligible and maintain their membership in the index. Index weights are capped at 10% of the float-adjusted market capitalization of the index and are reviewed quarterly.
FTSE Canada All Cap
The FTSE Canada All Cap Domestic Index is a market-capitalization-weighted index representing the performance of Canadian companies with large, medium, and small market capitalizations. As of February 28, this index included 178 member stocks.
Currency risk coverage
When a manager needs to replicate a U.S. index, such as the S&P 500 or the Nasdaq 100, they are required to acquire these assets in U.S. dollars. Consequently, the fund has to periodically convert the available funds in Canadian dollars into U.S. dollars. The impact of these conversions can be either favorable or detrimental, depending on whether the Canadian dollar has appreciated or depreciated.
Recognizing the desire of many investors to mitigate this currency risk, the majority of ETFs replicating a U.S. index provide a “hedged” version of their funds. In some cases, there is also another version exclusively traded in U.S. dollars. Hedging serves as a form of insurance against currency fluctuations. The scenarios outlined below illustrate the potential outcomes.
Yes, they do. Index Exchange-Traded Funds (ETFs) are structured to mirror the performance of a specific market index, and their dividends are sourced from the companies within that index. If the companies included in the index distribute dividends, the ETFs will pass on those dividends to their investors.
Understanding Dividend Yields
The dividend yield of an ETF is a crucial metric for investors looking for income-generating opportunities. It represents the annual dividend income expressed as a percentage of the ETF’s current market price. Examining the dividend yield is essential for investors seeking a balance between capital appreciation and regular income from their investments.
How to choose the right index fund
Selecting the most suitable index ETF involves a comprehensive examination of various factors to align with your financial goals and risk tolerance. Here are key considerations:
Determine Your Investment Goals:
Clearly define your investment objectives, whether they are centered around long-term growth, income generation, or capital preservation. Your goals will guide your choice of an ETF that aligns with your financial aspirations.
Understand the Underlying Index:
Index ETFs track specific market indices, such as the S&P 500, Dow Jones Industrial Average, or NASDAQ Composite. Understanding the components and methodology of the underlying index is crucial for assessing risk and potential returns.
Evaluate Expense Ratios:
The expense ratio (ER) represents the total costs charged by an ETF for managing the fund. Opt for funds with lower expense ratios, as this translates to a higher return on your investment.
Consider Liquidity:
Liquidity refers to an ETF’s ability to be bought or sold in the market without significantly affecting its price. High liquidity, characterized by a high trading volume, ensures ease of transactions and minimizes potential trading costs.
Analyze Diversification:
A well-diversified ETF spreads its investments across a variety of assets, reducing the impact of poor performance from a single investment. Evaluate the fund’s holdings to ensure it aligns with your risk tolerance and investment strategy.
Assess Historical Performance:
While past performance does not guarantee future results, analyzing an ETF’s historical performance can provide insights into its behavior under various market conditions. Consider how the ETF has performed in different market cycles.
Seek Professional Advice:
If you find yourself uncertain about which ETF suits your needs, consider consulting a financial advisor. A professional can provide personalized guidance based on your financial situation, helping you make informed investment decisions.
In conclusion, investing in index funds offers a diversified and relatively low-cost approach to gaining exposure to various market segments. Whether you’re a seasoned investor or just starting, understanding the intricacies of index ETFs and their dividend-paying capabilities is vital for constructing a well-balanced and effective investment portfolio.
Disclaimer
The data on this website is for your information only. It does not constitute investment advice, or advice on tax or legal matters. Any information provided on this website does not constitute investment advice or investment recommendation nor does it constitute an offer to buy or sell or a solicitation of an offer to buy or sell shares or units in any of the investment funds or other financial instruments described on this website. Should you have any doubts about the meaning of the information provided herein, please contact your financial advisor or any other independent professional advisor.
Welcome to a dive into the world of Canadian dividend stocks. In this discussion, we’ll explore three notable names from the Canadian Dividend Aristocrats list—recognized for their stability and consistent dividend performance. Join us as we examine these stocks, each presenting its unique blend of reliability and returns.
How to select monthly dividend stocks?
Look at the payout ratio
The dividend payout ratio is the amount of dividend distributed by a company divided by the total earnings. For example, a company makes a profit of $ 100 and pays $ 40 in dividends. Its payout ratio is 40%.
If the ratio is high, the company pays almost all of its profits in dividends. There will be little money left in the coffers to innovate or expand to new markets;
It is preferable to invest in a company where the dividend payout ratio is low or medium. The reasoning is that these companies will have money set aside to invest in new projects and thus create growth;
Another variation of payout ratio (Trailing div / Earnings) is the payout ratio to cash (Div / Free cash flows). Earnings can be easily manipulated, so analysts use the payout ratio to cash to assess the safety of dividends better. The website ‘Marketbeat‘ provides the payout ratio to cash for Canadian stocks.
Focus on total return
When one wishes to invest in a dividend-paying stock, it is essential to pay attention to its performance and growth potential. The most common mistake is to invest in stocks with high dividend yields. This strategy is risky. Here’s why :
• A stock can pay a high dividend yield, but is it sustainable? Some companies have a payout ratio that is close to and even exceeds 100%. They manage to post desirable dividend yields, but if we look at the growth prospects, it’s almost nil;
• Investors sometimes shun companies for lack of growth potential or actual risk of lower revenues in the future. These companies experience a drop in the price of their shares, and this causes the dividend yield to become abnormally high. Sooner or later, these businesses will have to cut their dividend.
Dividend sustainability
I personally use the measures below to evaluate a company’s ability to sustain its dividends:
– Debt to Equity ratio: It’s the total debt of a company on shareholders equity. Companies with level of debt are forced to priories the payment of interest charges. This comes at the expense of creating value for shareholders, whether it’s through dividend payment or growth.
– Interest coverage ratio: It’s simply total earnings divided by interest charges. If the ratio is, for example, 4, we would say the company’s earning cover 4 times the interest charges. Business with low interest coverage ratio are at risk. Low ratio means the company’s debt is starting to take a toll on its earnings.
Regulated Revenue Stream: Fortis derives approximately 99% of its revenue from regulated assets, providing a predictable and stable cash flow. This regulatory framework ensures a steady income stream, making it a reliable investment.
Utility Operations Expansion: Fortis has strategic plans for expanding its utilities operations through acquisitions and capital projects. This growth strategy aims to enhance the company’s overall performance and contribute to an annual increase in dividend yields by at least 6% through 2025.
Long-Standing Dividend Growth: With a history of raising dividends for 48 consecutive years, Fortis demonstrates a strong commitment to returning value to its shareholders. This long-standing dividend growth record is indicative of the company’s financial strength and stability.
Risks:
Moderate Dividend Yield: While Fortis has a consistent dividend growth history, its dividend yield may not be the highest in the Canadian market. Investors seeking higher yields may explore alternative options, impacting the stock’s attractiveness.
Diversified Energy Operations: Enbridge’s extensive operations include midstream oil transportation, natural gas pipelines, and renewable energy projects. This diversification helps mitigate risks associated with fluctuations in a specific energy sector and contributes to stable cash flows.
Long-Term Dividend Growth: Enbridge boasts a remarkable 28-year history of annual dividend increases, showcasing its commitment to rewarding shareholders. The current dividend yield of 8% is particularly appealing to income-focused investors.
Focus on Renewable Energy: The company’s goal to increase exposure to renewable energy from 2% (2019) to 7% (2035) aligns with the growing emphasis on sustainable practices. This focus on green energy may attract environmentally conscious investors.
Risks:
Dependency on Commodity Prices: Enbridge’s earnings are influenced by commodity prices, and despite its contractual arrangements, fluctuations in oil and gas prices could impact profitability.
Project Development Risks: While Enbridge has numerous projects in development, the success of these ventures depends on regulatory approvals, market conditions, and execution. Delays or issues in project development could affect the company’s growth plans.
Dominance in Telecommunications: BCE is a major player in Canada’s telecommunications sector, serving 10 million customers, which constitute around 30% of the national market. This dominance provides a strong market position and revenue stability.
Media Segment Diversification: BCE’s involvement in the media sector diversifies its revenue streams, offering news and entertainment through various channels. This diversification contributes to a resilient business model.
Expansion into 5G Technology: BCE’s rapid expansion into 5G technology positions it well for future growth, tapping into the evolving landscape of high-speed and advanced wireless communication.
Risks:
Competitive Industry: The telecommunications industry is highly competitive, with the potential for pricing pressures and the need for continuous investment in technology to stay ahead.
Dependency on Regulatory Environment: BCE’s operations are subject to regulatory frameworks, and changes in regulations could impact the company’s profitability and strategic plans.
If you are asking yourself, what is the typical profile of a dividend aristocrat stock? I have listed some common characteristics below:
Dividend aristocrats tend to dominate their industry
• The vast majority are companies that are well established in their sector. They manage to generate significant profits thanks to their comfortable position against the competition. They also sometimes operate in regulated markets such as electric utilities with almost no competition;
Safe heaven during turbulent times
• “Dividend aristocrats” are sometimes considered by the financial market as safe havens in the event of a market correction or decline. Indeed, dividend aristocrats are generally less volatile than the market, and there are less targeted by speculators;
Strong financial statements
• “Dividend aristocrats” will tend to have a better financial situation in terms of liquidity than the rest of the market. Their levels of liquidity or debt are generally better than the rest of the market;
Limited growth but there are exceptions
• In general, dividend aristocrats are mature businesses. That is, the growth potential is quite limited. However, some companies can pay dividends and invest in their growth. Usually, the dividend payout ratio is a good indicator. If the rate is low, it means the business is saving some money to grow. Business with high dividend pay out ratio have no financial resources left to grow.
What’s HBAL ETF?
The Horizons Balanced Asset Allocation HBAL ETF stands out as an all-in-one investment solution, encapsulating a comprehensive strategy within a single ETF. By seamlessly blending 60% global equity exposure for growth and 40% fixed income for stability, this diversified portfolio caters to investors seeking a holistic approach to long-term capital appreciation and a moderate income stream—all conveniently packaged in one ETF. Horizons ETF is a well-known fund provider specializing in exchange-traded funds. Their offerings encompass a diverse range of investment solutions across various asset classes.
Is a balanced All-In-ETF portfolio the right choice for you?
A balanced portfolio, typically composed of a mix of stocks and bonds, seeks to strike a harmony between growth potential and risk mitigation. Suited for investors with a moderate risk tolerance, it aims to deliver a blend of long-term capital appreciation from equities and stability through fixed-income investments. This approach is ideal for those seeking a middle ground, prioritizing a measured combination of growth and security in their investment strategy.
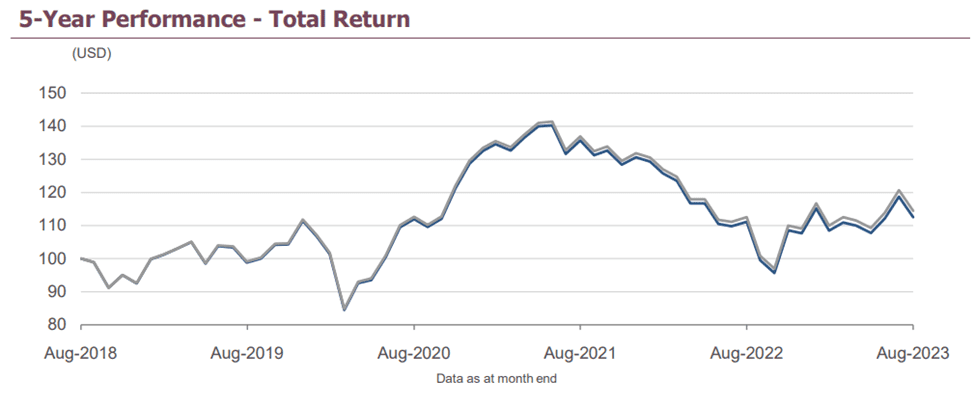
HBAL.TO (Horizons Balanced TRI ETF Portfolio) stands out with notable performance metrics. Despite having lower net assets at 138.20 million (M), it boasts an impressive 8.25% year-to-date (YTD) return, indicating strong short-term performance. Additionally, HBAL.TO exhibits a 6.29% 5-year average return, showcasing sustained positive returns over a more extended period.
What are the fees for HBAL?
The anticipated total management expense ratio (MER) for HBAL is around 0.20%, encompassing the costs associated with fund management. Additionally, the projected trading expense ratio (TER) for HBAL is expected to be 0.02%, reflecting the expenses linked to the buying and selling of assets within the fund.
In this post, we will be going over 11 high dividend yields ETFs. All the ETFs selected pay over 6% in dividend yield! We will start by comparing the performance and MER. Then, we will discuss how to select the best ETF among the ones selected. for each ETF, we will provide all pertinent financial data.
How to analyze a high dividend ETF in Canada
Analyzing a high dividend ETF in Canada involves considering several key factors:
Total Return: Remember that an investment’s profit or loss results from both dividend income and capital gain or loss. It’s essential to assess the fund’s long-term performance, aiming for an ETF that offers satisfactory capital appreciation along with a high dividend yield.
Diversification: Opt for diversified ETFs whenever possible, as they tend to be safer. Some high-yield ETFs focus on specific sectors like Financials, Energy, or Gold. However, those concentrating on Energy and Gold have displayed poor long-term performance and come with high volatility risks.
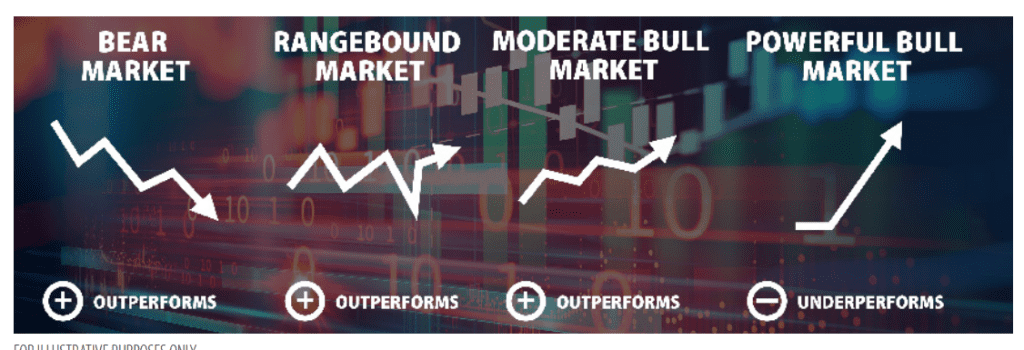
Covered Call ETFs: It’s crucial to understand how high dividend ETFs achieve their impressive yields. Most of these ETFs utilize covered call options, allowing them to collect earned options premiums, which are then added to the dividends paid to investors. However, this strategy limits the upside potential of the ETF’s held stocks.
In summary, a covered call ETF tends to outperform competitors during market corrections but may underperform during market rallies. This strategy is particularly suitable for low volatility baskets of securities, but its effectiveness diminishes when applied to high volatility assets like gold and energy stocks.
Volume and Liquidity: Consider the ETF’s volume and liquidity. ETFs with higher assets under management generally offer lower trading costs due to narrower bid-ask spreads.
Management Expense Ratio: Evaluate the Management Expense Ratio (MER) of the ETF. A lower MER can result in cost savings for investors over the long term.
Review of HPF Harvest Energy Leaders Plus Income ETF
Investment Strategy: Partially Covered Call Strategy for Income Enhancement and Downside Protection in the Energy Sector with a focus on Dividend Stocks
HPF has exhibited lackluster historical performance, even with its implemented covered call strategy. Concerns arise as dividends may not be secure, given the potential for major players in the energy industry to reduce their dividend payouts. If you maintain a positive outlook on energy stocks, it might be more prudent to hold them directly rather than investing in HPF. With HPF, the trade-off involves exchanging potential income for the prospect of growth.
Review of ZWC BMO CDN High Dividend Covered Call ETF
Investment Strategy: Covered Call Strategy for Income Augmentation and Downside Protection in the Canadian Dividend Market
ZWC stands out as a compelling choice for conservative investors seeking a stable income stream and minimal volatility. The utilization of the covered call strategy effectively boosts the yield, although it does impose constraints on long-term growth potential. It is crucial to bear this trade-off in mind when considering ZWC as an investment option.
Moreover, ZWC demonstrates tax efficiency as all its dividends originate from Canadian companies, which can be advantageous for tax-conscious investors.
Review of HDIV and HDIF
HDIV and HDIF pose robust competition to ZWC. These ETFs offer diversification across multiple sectors and employ the covered call strategy, combined with additional leverage, to achieve even greater dividend yields. However, it’s worth noting that as these two ETFs are relatively new, their performance history and Management Expense Ratios (MER) have not yet been made available.
Nonetheless, it’s almost certain that the MER for both HDIV and HDIF will exceed that of ZWC. This higher expense ratio is a trade-off for the enhanced yield generated through the additional leverage. Investors should be aware that while this leverage can boost returns, it also introduces heightened risk to their investment portfolios. Careful consideration and assessment of risk tolerance are advisable when evaluating these options.
Review of ZWE and ZWP – BMO Europe High Dividend CC CAD ETF
Investment Strategy: Covered Call Strategy for Income Enhancement and Downside Protection in the European Dividend Market
ZWE and ZWP represent attractive investment options that focus on high-quality European stocks, including companies such as Volkswagen and Nestlé. These ETFs employ a covered call strategy designed to safeguard against market downturns while simultaneously boosting yields.
It’s important to note that both ZWP and ZWE share identical portfolios, with the key distinction lying in their approach to currency risk management. ZWE employs Canadian hedging to mitigate exchange rate risk, while ZWP is a non-hedged ETF, meaning it does not employ currency hedging strategies. Investors should carefully consider their risk tolerance and currency exposure preferences when selecting between these two options.
Review of LIFE and LIFE-B Evolve Global Healthcare Enhance Yld ETF
Investment Strategy: Partially covered call strategy to enhance income and protect against downturn / Global / Healthcare / Dividend
LIFE and LIFE-B emerge as top-tier ETF options for those seeking exposure to the healthcare sector, with a particular focus on dividend yield. Their outstanding performance, notably during the pandemic, underscores their resilience in the face of market volatility. However, it’s worth noting that several analysts express concerns about the global healthcare sector’s current state, suggesting it may be overvalued. In light of this, a prudent approach might involve waiting for a market pullback before considering an investment.
Nevertheless, the long-term outlook for the healthcare industry remains positive, indicating potential for growth over time.
A key differentiator between the two ETFs is their approach to currency risk management: LIFE.B is non-hedged, while LIFE employs Canadian hedging to reduce exposure to exchange rate fluctuations. Investors should carefully assess their risk tolerance and currency risk preferences when choosing between these options.
Review of ZWH and ZWS BMO US High Dividend Covered Call ETF
The strategy used: Covered call strategy to enhance income and protect against downturn / US / Dividend
ZWH and ZWS present compelling investment options for individuals seeking exposure to a portfolio of high-quality US stocks while also desiring a reliable income stream. These ETFs implement a covered call strategy that, while it does impose limitations on potential growth, provides a valuable layer of protection in the event of a market downturn.
It’s essential to note that ZWS employs Canadian hedging to mitigate exposure to currency fluctuations, whereas ZWH is a non-hedged ETF. Investors should carefully evaluate their risk tolerance and currency risk preferences when deciding between these two offerings, as these factors can significantly impact the performance and stability of their investments.
Review of CALL – Evolve US Banks Enhanced Yield ETF
The strategy used: Partially covered call strategy to enhance income and protect against downturn / US / Banking / Dividend
CALL invests in major US Banks and seeks primarily to provide income through dividends and call premiums. The covered call strategy limits the ability of the fund to capture the growth in the US banking industry.
CALL is non hedged CALL-B is Canadian hedged to reduce currency exchange risk.
Review of FIE – Ishares CDN Fin Monthly Income ETF
Strategy used: Canada / Banking / Dividend
FIE is primarily focused on investments in Canadian banks and does not employ a covered call strategy. It represents an attractive option for investors who hold a positive outlook on the Canadian banking sector and seek direct exposure to it. However, it’s worth noting that the Management Expense Ratio (MER) for FIE may be relatively high, especially given its limited holdings, which mainly consist of the six major Canadian banks.
HPF – Harvest Energy Leaders Plus Income
Harvest Energy Leaders Plus Income ETF is an equally weighted portfolio of 20 large global energy companies. The ETF is designed to provide a consistent monthly income stream with an opportunity for growth. In order to generate an enhanced monthly distribution yield, an active covered call strategy is engaged.
HPF High dividend ETF Holdings
Security
Weight %
Hess Corporation
5.1
Phillips 66
5.1
Valero Energy Corporation
5.0
Parkland Corporation
5.0
EOG Resources, Inc.
5.0
Suncor Energy Inc.
5.0
TC Energy Corporation
4.9
Pembina Pipeline Corporation
4.9
HollyFrontier Corporation
4.9
Enbridge Inc.
4.9
Equinor ASA
4.9
Exxon Mobil Corporation
4.9
ConocoPhillips
4.9
Consult issuer’s website for up-to-date data
ZWC – BMO CDN High Div Covered Call
The BMO Canadian High Dividend Covered Call ETF (ZWC) has been designed to provide exposure to a dividend focused portfolio, while earning call option premiums. The underlying portfolio is yield-weighted and broadly diversified across sectors.
The fund selection methodology uses 4 factors: – Liquidity; – Dividend growth rate; – Yield and payout ratio.
What’s unique about this ETF is that it uses covered calls to protect against downside risk. This being said, the covered call strategy provides limited downside protection. Also, when you write a covered call, you give up some of the stock’s potential gains. These ETFs will tend to have a higher yield and a lower performance.
The financial sector and Energy represents 56% of the total overall sector allocation.
ZWC High dividend ETF Holdings
Weight (%)
Name
4.96%
TORONTO-DOMINION BANK
4.91%
BCE INC
4.91%
ROYAL BANK OF CANADA
4.71%
CANADIAN IMPERIAL BANK OF COMMERCE
4.61%
BANK OF NOVA SCOTIA
4.24%
MANULIFE FINANCIAL CORP
4.20%
TRANSCANADA CORP
4.10%
ENBRIDGE INC
3.81%
BANK OF MONTREAL
3.77%
GREAT-WEST LIFECO INC
Consult issuer’s website for up-to-date data
ZWE and ZWP – BMO Europe High Div Covered Call
These 2 ETFs are part of the BMO Europe High Dividend Covered Call ETFs. They have been designed to provide exposure to a dividend focused portfolio. These dividend paying companies are selected based on:
dividend growth rate,
yield,
payout ratio and liquidity.
Their holdings include well known and mostly large cap European companies such as (Total, Volkswagen, Nestle…etc).
Both ZWP and ZWE have the same holdings. ZWE is Canadian hedged to reduce exchange risk. ZWP is a non hedge ETF.
ZWE and ZWP high dividend ETF Holdings
Weight (%)
Name
4.18%
VOLKSWAGEN AG PFD
3.99%
NESTLE SA
3.99%
UNILEVER PLC
3.96%
SIEMENS AG
3.85%
ALLIANZ SE
3.80%
RIO TINTO PLC
3.77%
TOTAL SE
3.74%
BASF SE
3.62%
NOVO NORDISK A/S
3.49%
LVMH MOET HENNESSY LOUIS VUITTON SE
Consult issuer’s website for up-to-date data
LIFE and LIFE-B – Evolve Global Healthcare Enhance Yld ETF
LIFE seeks to replicate the performance of the Solactive Global Healthcare 20 Index. This index equally weights 20 global healthcare companies.
LIFE ETF writes covered call options on up to 33% of the portfolio securities, at the discretion of the Manager. The level of covered call option writing may vary based on market volatility and other factors.
LIFE.B does not employ currency hedging and is suitable for investors comfortable with currency risk.
LIFE utilizes Canadian hedging to reduce exchange rate risk, making it a choice for investors seeking reduced exposure to fluctuations in exchange rates between the fund’s assets and the Canadian dollar.
Though LIFE ETFs offer a interesting yield, the performance was negative.
LIFE and LIFE-B high dividend ETF Holdings
NAME
WEIGHT
COUNTRY
Danaher Corp
5.18%
UNITED STATES
Novartis AG
5.12%
SWITZERLAND
Intuitive Surgical Inc
5.10%
UNITED STATES
CSL Ltd
5.08%
AUSTRALIA
AstraZeneca PLC
5.07%
BRITAIN
Pfizer Inc
5.01%
UNITED STATES
AbbVie Inc
5.01%
UNITED STATES
Medtronic PLC
4.92%
IRELAND
Sanofi
4.88%
FRANCE
GlaxoSmithKline PLC
4.86%
BRITAIN
Consult issuer’s website for up-to-date data
ZWH and ZWS – BMO US High Dividend Covered Call ETF
BMO US High Dividend Covered Call has been designed to provide exposure to a dividend focused portfolio, while earning call option premiums. The underlying portfolio is yield-weighted and broadly diversified across sectors. The Fund utilizes a rules-based methodology that considers the following criteria:
dividend growth rate,
yield,
payout ratio,
liquidity.
What’s unique about this ETF is that it uses covered calls to protect against downside risk. In my opinion, the covered call strategy provides limited downside protection. Also, when you write a covered call, you give up some of the stock’s potential gains. These ETFs will tend to have a higher yield and a lower performance.
ZWS is Canadian hedged while ZWH is non hedged.
ZWH and ZWS High dividend ETF holdings
Weight (%)
Name
4.41%
BANK OF AMERICA CORP
4.32%
HOME DEPOT INC/THE
4.22%
CISCO SYSTEMS INC/DELAWARE
4.13%
JPMORGAN CHASE & CO
4.09%
INTERNATIONAL BUSINESS MACHINES CORP
4.07%
MICROSOFT CORP
3.91%
ABBVIE INC
3.83%
CHEVRON CORP
3.75%
AT&T INC
3.70%
PFIZER INC
Consult issuer’s website for up-to-date data
Holdings (ZWP) as of May 7th
Weight (%)
Name
Bloomberg Ticker
98.86%
BMO US HIGH DIVIDEND COVERED CALL ETF
ZWH
1.14%
CASH
–
Consult issuer’s website for up-to-date data
CALL and CALL-B – Evolve US Banks Enhanced Yield ETF
Evolve US Banks Enhanced Yield ETF invests primarily in the equity constituents of the Solactive Equal Weight US Bank Index Canadian Dollar Hedged, while writing covered call options on up to 33% of the portfolio securities, at the discretion of the Manager. The level of covered call option writing may vary based on market volatility and other factors.
The index tracks the performance of major U.S. banks.
This ETF is available under two different tickers:
CALL: This version of the ETF is non-hedged, meaning it does not employ currency hedging strategies. Investors in CALL will be exposed to currency exchange risk, which can affect the fund’s returns if there are fluctuations in exchange rates between the fund’s underlying assets and the investor’s home currency.
CALL-B: This version of the ETF is Canadian hedged, indicating that it utilizes currency hedging techniques to mitigate currency exchange risk. Investors in CALL-B will have reduced exposure to fluctuations in exchange rates between the fund’s assets and the Canadian dollar.
CALL and CALL-B High dividend ETF Holdings
NAME
WEIGHT
Ameriprise Financial Inc
5.49%
US Bancorp
5.18%
Bank of America Corp
5.15%
Wells Fargo & Co
5.09%
PNC Financial Services Group Inc/The
5.04%
Citizens Financial Group Inc
5.02%
Western Alliance Bancorp
5.01%
KeyCorp
4.96%
First Republic Bank/CA
4.95%
Signature Bank/New York NY
4.93%
Consult issuer’s website for up-to-date data
GLCC – Horizons Enhanced Income Gold Prod ETF
HEP invests in North American listed companies that are primarily exposed to gold mining and exploration. The holdings at the time of each reset are the largest and most liquid issuers in their sector.
To mitigate downside risk and generate income, HEP will generally write covered call options on 100% of the portfolio securities. The level of covered call option writing may vary based on market volatility and other factors and is at the discretion of the manager.
HEP High dividend ETF Holdings
Security Name
Weight
NEWMONT CORP
8.31%
OSISKO GOLD ROYALTIES LTD
8.09%
PAN AMERICAN SILVER CORP
8.06%
FRANCO-NEVADA CORP
7.74%
ROYAL GOLD INC
7.74%
ANGLOGOLD ASHANTI LTD ADR
7.42%
ENDEAVOUR MINING CORP
7.06%
WHEATON PRECIOUS METALS CORP
6.78%
YAMANA GOLD INC
6.61%
KINROSS GOLD CORP
6.51%
Consult issuer’s website for up-to-date data
FIE – Ishares CDN Fin Mthly Income
Seeks to maximize total return and to provide a stable stream of monthly cash distributions. This fund has a high exposure to the financial sector. FIE is a Canadian dividend income ETF.
FIE ETF Holdings
Name
Weight (%)
ISHARES S&P/TSX CANADIAN PREFFERED
20.87
iShs Canadian Corp Bnd Idx ETF
10.17
CANADIAN IMPERIAL BANK OF COMMERCE
8.61
ROYAL BANK OF CANADA
8.30
MANULIFE FINANCIAL CORP
7.19
TORONTO DOMINION
7.09
SUN LIFE FINANCIAL INC
6.94
NATIONAL BANK OF CANADA
6.49
POWER CORPORATION OF CANADA
5.73
IA FINANCIAL INC
3.64
Consult issuer’s website for up-to-date data
Disclaimer
The data on this website is for your information only. It does not constitute investment advice, or advice on tax or legal matters. Any information provided on this website does not constitute investment advice or investment recommendation nor does it constitute an offer to buy or sell or a solicitation of an offer to buy or sell shares or units in any of the investment funds or other financial instruments described on this website. Should you have any doubts about the meaning of the information provided herein, please contact your financial advisor or any other independent professional advisor.
Introduction:
In the dynamic world of personal finance, students often find themselves in search of a banking solution that caters to their unique needs. Recognizing this, the BMO Performance Chequing Account emerges as a compelling option, tailored specifically for students. In this article, we delve into the features, benefits, and nuances of this financial product to help students make informed decisions about managing their finances during their academic journey.
Product Overview:
The BMO Performance Chequing Account for students is designed to provide a seamless banking experience with a range of exclusive perks. Let’s break down the key components:
Offer:
The account comes with a tempting opening offer—an attractive $100 cash bonus. This serves as an enticing incentive for students to kickstart their banking relationship with BMO. Additionally, during their time in school and one year after graduation, students can enjoy the luxury of no monthly fees, alleviating financial strain during this crucial period of academic pursuits.
Monthly Fees:
The absence of monthly fees while in school and during the initial post-graduation year is a significant advantage. This feature recognizes the financial challenges students face and aims to support them during their educational journey. Beyond this period, the account incurs a reasonable monthly fee, making it a sustainable choice for the long term.
Other Fees:
While the account boasts no monthly fees for a specified duration, it’s essential to be aware of potential fees associated with certain transactions. An overdraft protection fee of $5 per month is applicable. Moreover, the account includes one free Canadian withdrawal per month. Subsequent Canadian withdrawals are charged at $2 each. Transactions made outside of Canada and the U.S. incur a higher fee of $5 each. These fees underline the importance of understanding the terms and conditions associated with the account.
Number of Transactions:
One of the standout features of the BMO Performance Chequing Account is the unlimited number of transactions it offers. This is particularly advantageous for students who may have varied financial activities, from daily purchases to more infrequent, substantial transactions. The absence of transaction limits ensures that students can manage their finances without restrictions.
Benefits for Students:
Cash Bonus Incentive:
The $100 opening cash bonus serves as a generous welcome gesture. For students managing tight budgets, this injection of funds can be a valuable boost, helping cover initial expenses related to their education.
Fee Waiver Period:
The waiver of monthly fees while in school and for the first year post-graduation acknowledges the financial challenges students face during these periods. This feature reflects BMO’s commitment to supporting students in their educational endeavors.
Flexible Transaction Limits:
The unlimited number of transactions allows students to conduct their financial activities without worrying about hitting predefined limits. This flexibility is crucial for managing day-to-day expenses, online transactions, and occasional larger financial moves.
Conclusion:
The BMO Performance Chequing Account for students presents a compelling blend of incentives, fee waivers, and flexibility. The $100 cash bonus, coupled with the absence of monthly fees during crucial academic phases, positions this account as an attractive option for students
In an era defined by technological transformation, the rise of Artificial Intelligence (AI) stands as one of the most profound shifts in the global landscape. AI, once confined to the realm of science fiction, has become a driving force behind innovation, reshaping industries. As the world becomes increasingly reliant on AI-driven solutions, the AI sector is presenting investors with a wealth of opportunities. In this blog post, we’ll explore four Best AI stocks poised for exponential growth, delving into their promising prospects.
Meta Platforms (NASDAQ:META)
Profile
Meta Platforms, Inc. is a global company focused on creating products that facilitate connections and sharing among individuals across various platforms, including mobile devices, personal computers, virtual reality headsets, and wearables.
Meta Platforms, the parent company of Facebook, has experienced a remarkable surge in its stock price, soaring by almost 200% over the past year. This impressive growth is largely attributed to the company’s strategic investment in artificial intelligence. That investment has enabled it to navigate and overcome the challenges related to data privacy.
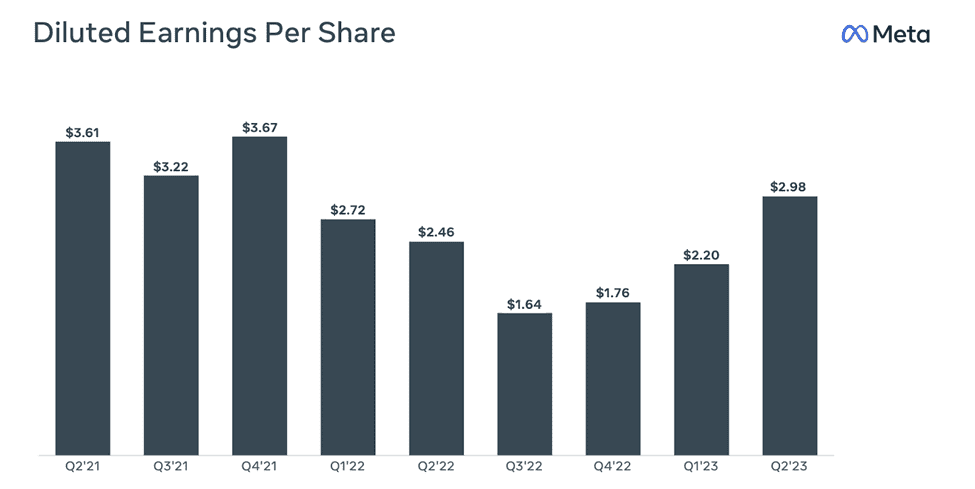
One noteworthy financial highlight is the substantial growth in diluted earnings per share (EPS), which has outpaced the growth in operating income, registering an impressive 21% year-over-year increase. This remarkable performance can be partly attributed to Meta’s aggressive share repurchase program, which benefits current shareholders.
However, despite these positive trends, there are several key concerns looming on the horizon for Meta Platforms. The ongoing Department of Justice (DOJ) antitrust trial against Google has raised questions about potential regulatory actions. The potentiel actions could impact Meta and its market dominance. Additionally, the company is facing profitability headwinds, which pose challenges to sustaining its current growth trajectory. Furthermore, the expanded valuation of Meta’s stock raises questions about its long-term sustainability and whether it can continue to justify its current market value in the face of these challenges.
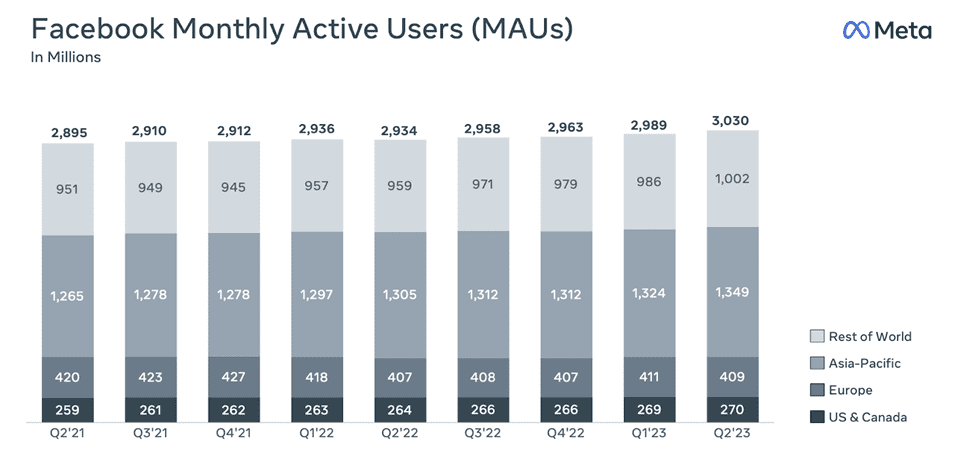
Source: Earnings presentation – Best AI stocks
Meta observed a 1.4% sequential growth in its monthly active users (MAUs) on the Facebook platform.
UiPath Inc. is a prominent enterprise software company renowned for its comprehensive automation platform specializing in robotic process automation (RPA). With a strong presence in the United States, Romania, and Japan, UiPath revolutionizes business operations by leveraging RPA technology. RPA involves the utilization of software robots or digital workers to streamline and automate repetitive, rule-based tasks. Traded on the New York Stock Exchange under the ticker symbol PATH, UiPath Inc. is at the forefront of innovation in the field of automation solutions.
UiPath, trading under the ticker symbol PATH, stands as a prominent player in the enterprise software arena, renowned for its state-of-the-art robotic process automation (RPA) platform, underpinned by advanced AI technology. This RPA innovation not only aids corporations like Uber Technologies, Inc. (UBER) in cost reduction but also propels UiPath to the forefront of the automation industry. The company’s strategic alliances with major industry players have further cemented its leadership position.
Currently, UiPath is shifting towards a business automation platform with AI at its core. This strategic pivot furnishes the company with a distinct competitive advantage, particularly in terms of harnessing data and delivering user-friendly solutions.
From a financial standpoint, UiPath exhibits robust stability, characterized by an absence of debt and substantial cash reserves. In addition, the recorded consistently positive free cash flow. This financial prowess empowers the company to allocate resources towards vital research and development (R&D) initiatives and seize opportunities for mergers and acquisitions (M&A). These endeavors not only propel UiPath’s growth but also drive ongoing innovation within the automation sector.
Salesforce (NYSE:CRM)
Profile
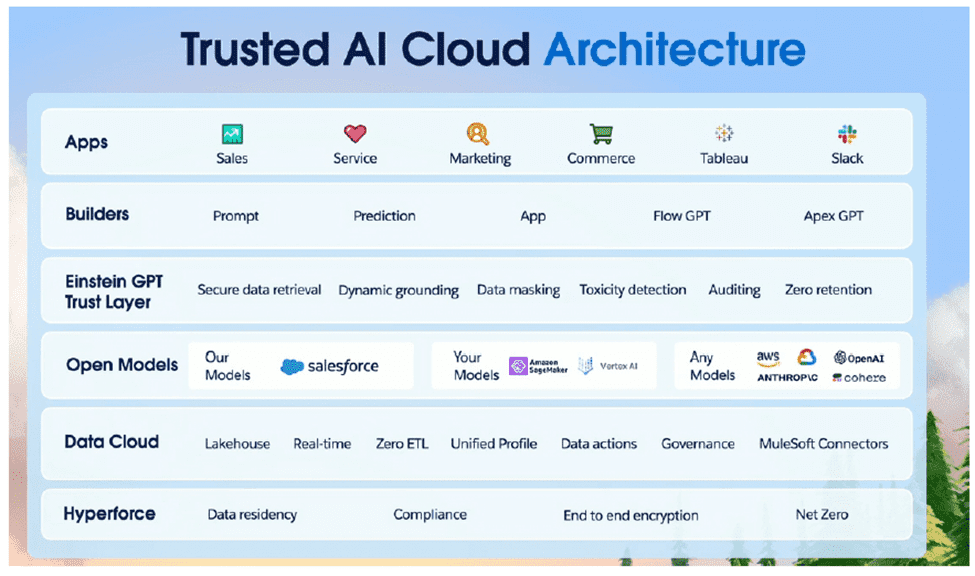
Salesforce, a trailblazer in the realm of Customer Relationship Management (CRM), leverages the power of cloud computing and artificial intelligence (AI) to champion customer success. The company’s comprehensive suite of services encompasses sales functionalities like data storage, lead tracking, progress monitoring, opportunity forecasting, analytics-driven insights, relationship intelligence, and the seamless generation of quotes, contracts, and invoices. In addition, Salesforce’s service arm empowers businesses to provide trustworthy and deeply personalized customer service and support on a large scale, ensuring the highest levels of customer satisfaction.
Salesforce (CRM) presents an enticing investment prospect with its combination of robust profitability, consistent double-digit revenue growth, and a strategic emphasis on AI-driven productivity. In its recent Q2 earnings report, Salesforce not only exceeded expectations but also revised its full-year guidance upward. This impressive performance is fueled by strong demand for the company’s AI tools seamlessly integrated throughout its software ecosystem, highlighting Salesforce’s promising position in the market.
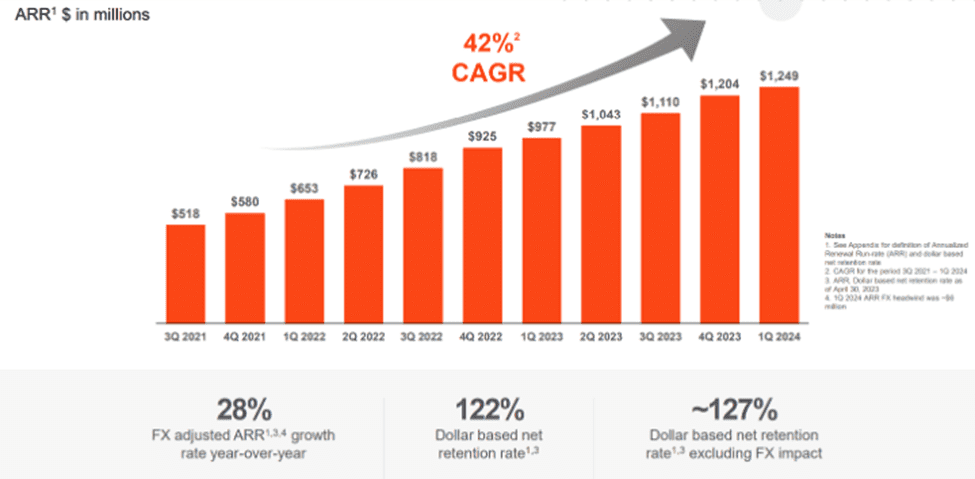
OKTA is a cloud-based cybersecurity company specializing in user identity authentication and management across various devices. Their Workforce Identity Cloud empowers organizations to enhance workforce security and establish secure collaborative solutions with partner networks.
Okta (OKTA), a pioneer in identity management and single sign-on technology, has enjoyed a remarkable 30% surge in its stock price this year. This surge is indicative of the success of the company’s strategic shift towards becoming a comprehensive provider in the identity security market, and it suggests that its turnaround efforts are moving in a positive direction.
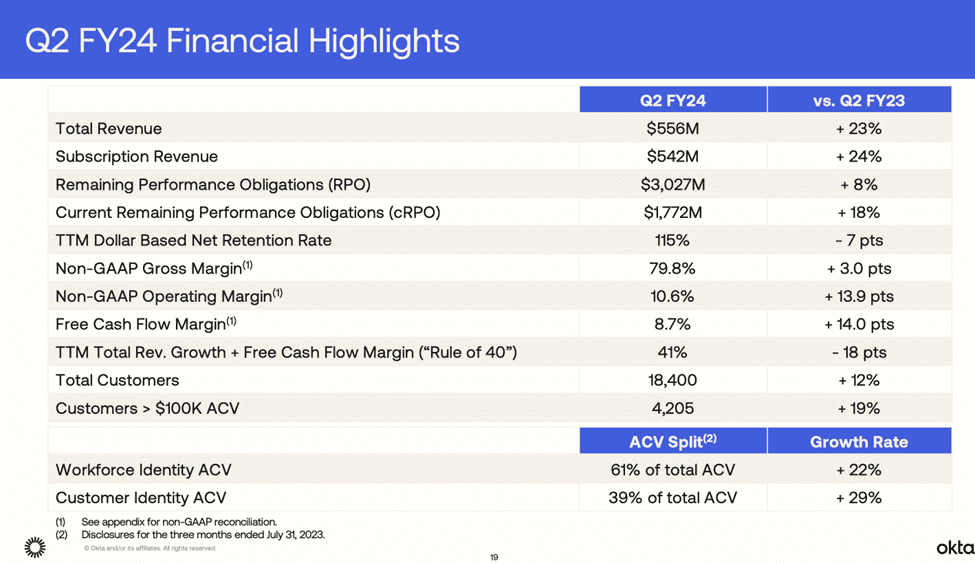
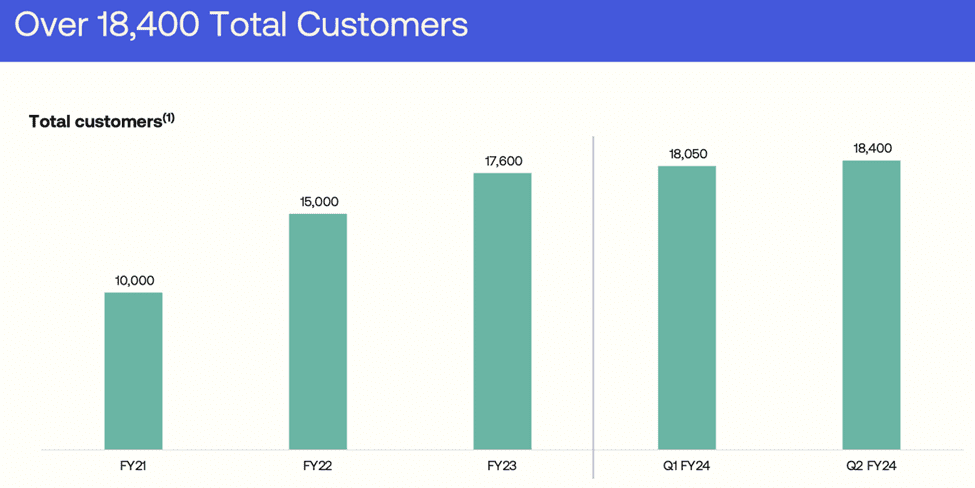
However, there is a noteworthy concern that has emerged over the past year: a slowdown in customer growth. In the second quarter, Okta was able to onboard 350 new customers, representing a growth rate of 12%, bringing its total customer base to 18,400. Despite these challenges in customer growth, Okta has demonstrated strong sales momentum and profitability, effectively acquiring new customers and expanding billing with existing ones.
It’s essential to acknowledge that Okta’s current valuation is relatively high. This valuation reflects the market’s optimism and high expectations regarding the company’s future potential and growth prospects.