Global X is one of the largest ETF issuers in North America. In this post, we will focus on their covered call ETFs whose main objective is to maximize dividend yield. In fact, Covered call ETFs are more and more popular among income oriented investos. Global X had issued various ETFs within this category with different strategies to cater to most investors.
List of High income Vanguard covered call ETFs
| High income ETFs from Vanguard |
| DJIA -Global X Dow 30 Covered Call ETF |
| QYLD -Global X NASDAQ 100 Covered Call ETF |
| XYLD -Global X S&P 500 Covered Call ETF |
| RYLD -Global X Russell 2000 Covered Call ETF |
| QYLG -Global X Nasdaq 100 Covered Call & Growth ETF |
| XYLG -Global X S&P 500 Covered Call & Growth ETF |
BMO Covered call ETF list – Full comparison
JEPI ETF REVIEW: JPMorgan Equity Premium Income
Strategy: summary table
| Covered Call ETFs DJIA, QYLD, XYLD, RYLD | Covered Call & Growth ETFs QYLG, XYLG | |
| Strategy Overview | Buy reference index components, write monthly At The Money index calls on 100% of the fund’s portfolio in an effort to maximize income. | Buy reference index components, write monthly At The Money index calls on 50% of the fund’s portfolio for income with some upside potential. |
| ETFs | DJIA, QYLD, XYLD, RYLD | QYLG, XYLG |
| Strategy | Sells At The Money Covered Calls (on 100% of assets) 100% of the upside is forfeited | Sells At The Money Covered Calls (on 50% of assets) 50% of the upside is forfeited |
| Dividend Frequency | Monthly | Monthly |
Asset under management and inception date
[stock_market_widget type=”table-quotes” template=”color-header-border” color=”#5679FF” assets=”DJIA,QYLD,XYLD,RYLD,QYLG,XYLG” fields=”symbol,name,net_assets,fund_inception_date” links=”{‘DJIA’:{},’QYLD’:{},’XYLD’:{},’RYLD’:{},’QYLG’:{},’XYLG’:{}}” display_header=”true” display_chart=”false” display_currency_symbol=”true” pagination=”true” search=”false” rows_per_page=”10″ sort_field=”logo_name_symbol” sort_direction=”asc” alignment=”left” api=”yf”]
Performance comparison
[stock_market_widget type=”table-quotes” template=”color-header-border” color=”#5679FF” assets=”DJIA,QYLD,XYLD,RYLD,QYLG,XYLG” fields=”symbol,ytd_return,three_year_average_return,five_year_average_return” links=”{‘DJIA’:{},’QYLD’:{},’XYLD’:{},’RYLD’:{},’QYLG’:{},’XYLG’:{}}” display_header=”true” display_chart=”false” display_currency_symbol=”true” pagination=”true” search=”false” rows_per_page=”10″ sort_field=”logo_name_symbol” sort_direction=”asc” alignment=”left” api=”yf”]
Dividend yield comparison
| Symbol | Div Yld | MER |
|---|---|---|
| DJIA | 11% | 0,61 |
| QYLD | 13.74% | 0,61% |
| XYLD | 13.42% | 0,60% |
| RYLD | 13.50% | 0,55% |
| QYLG | 6.89% | 0,61% |
| XYLG | 6.43% | 0,60% |
Full list of ‘Dividend Kings’ stocks by sector – 2023
PFF ETF Review: US Preferred Stock Ishares
QYLD -Global X NASDAQ 100 Covered Call ETF
QYLD is a passive index ETF that uses a covered call strategy to enhance yield and lower volatility. The fund was created by Global X and tracks the Nasdaq 100. The manager follows a “covered call” or “buy-write” strategy, in which the Fund buys the stocks in the Nasdaq 100 Index and “writes” or “sells” corresponding call options on the same index.
[stock_market_widget type=”card” template=”basic” color=”#5679FF” assets=”QYLD” display_currency_symbol=”true” api=”yf”]
[stock_market_widget type=”chart” template=”basic” color=”#5679FF” assets=”QYLD” range=”1mo” interval=”1d” axes=”true” cursor=”true” range_selector=”true” display_currency_symbol=”true” api=”yf”]
Is QYLD a good investment?
When it comes to investing, finding the right balance between risk and reward is a constant pursuit. The QYLD ETF, or the Global X NASDAQ 100 Covered Call ETF, is an investment option that has captured the attention of both conservative investors and income seekers. In this exploration, we delve into the positives and drawbacks of QYLD, shedding light on its unique attributes.
Positives: Embracing Income and Stability
Attractive Yield: QYLD is often celebrated for its attractive yield, which is primarily derived from the premiums earned by issuing call options on the NASDAQ 100 index. For those seeking a regular income stream, this feature can be enticing, offering a consistent source of cash flow.
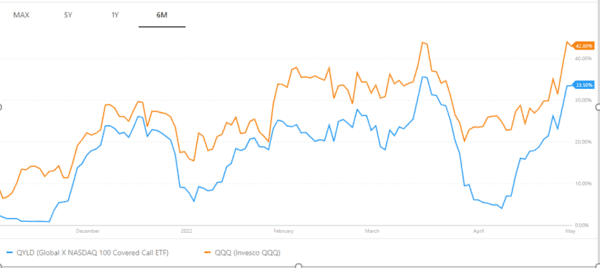
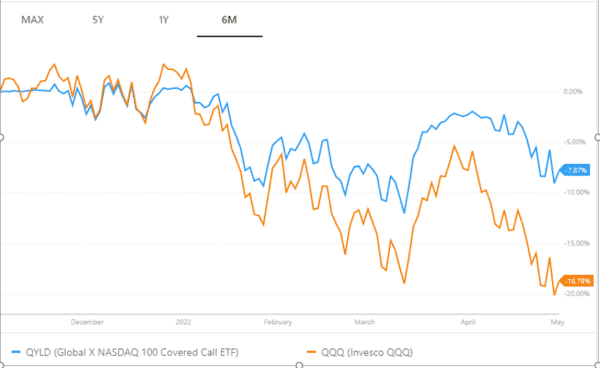
Lower Volatility: Another notable advantage of QYLD is its lower volatility when compared to direct investments in the NASDAQ 100, such as QQQ. The covered call strategy embedded in the fund serves as a cushion, effectively reducing overall volatility. This quality makes it particularly appealing to conservative investors who prioritize capital preservation.
Time and Effort Saved: QYLD provides a valuable shortcut for investors. Writing call options in the NASDAQ 100 involves extensive research, active management, and ongoing monitoring. QYLD simplifies this process by offering a professionally managed covered call strategy, saving investors both time and effort.
Liquidity: With assets under management surpassing 6 billion dollars, the fund offers liquidity that ensures investors can efficiently trade shares as needed.
Drawbacks: Considerations on Performance and Diversification
Performance Limitations: While QYLD excels in income generation and risk reduction, it’s important to recognize that this strategy has its limitations. The covered call approach inherently places a cap on the fund’s potential for capital appreciation. As a result, investors may miss out on the full upside potential of the NASDAQ 100, particularly during robust market rallies.
Market Unpredictability: In the face of an unpredictable or highly volatile market, the effectiveness of covered call strategies like the one employed by QYLD may be challenged. While it serves as a risk management tool during stable market conditions, extreme fluctuations can render the strategy less effective.
Lack of Diversification: QYLD’s dominance by tech firms means it falls short of offering true diversification. Investors looking for a broad spectrum of investments beyond the tech sector may find this aspect limiting.
High Fees: It’s worth noting that QYLD comes with a total expense ratio of 0.60%, which some investors may find relatively high compared to other ETF options.
In conclusion, the QYLD ETF presents a unique investment proposition with its emphasis on income generation and risk management. However, it’s crucial for investors to weigh these advantages against the potential limitations and consider their individual financial objectives and risk tolerance. The decision to invest in QYLD should align with one’s investment strategy and goals, keeping in mind the trade-offs involved in pursuing income and stability in a dynamic market landscape.
QYLD Top ten holdings
| Net Assets (%) | Name |
|---|---|
| 11.85 | APPLE INC |
| 11.79 | MICROSOFT CORP |
| 6.54 | AMAZON.COM INC |
| 3.91 | ALPHABET INC-CL C |
| 3.88 | ALPHABET INC-CL A |
| 3.66 | NVIDIA CORP |
| 2.75 | TESLA INC |
| 2.72 | META PLATFORMS INC |
| 2.08 | PEPSICO INC |
| 2.03 | BROADCOM INC |
XYLD -Global X S&P 500 Covered Call ETF
XYLD is a passive index ETF that uses a covered call strategy to enhance yield and lower volatility. The fund was created by Global X and tracks the S&P500. The manager follows a “covered call” or “buy-write” strategy, in which the Fund buys the stocks in the S&P 500 Index and “writes” or “sells” corresponding call options on the same index. So far, XYLD has paid monthly distributions 9 years running.
[stock_market_widget type=”card” template=”basic” color=”#5679FF” assets=”XYLD” display_currency_symbol=”true” api=”yf”]
[stock_market_widget type=”chart” template=”basic” color=”#5679FF” assets=”XYLD” range=”1mo” interval=”1d” axes=”true” cursor=”true” range_selector=”true” display_currency_symbol=”true” api=”yf”]
Is XYLD a good investment?
The XYLD ETF, or the Global X S&P 500 Covered Call ETF, presents a compelling investment option with a range of benefits that cater to various investor preferences. This ETF employs a covered call strategy on the S&P 500, offering a unique blend of income generation and risk management.
One of the most appealing features of XYLD is its attractive yield, primarily derived from the premiums earned by issuing call options on the S&P 500. For income-seeking investors, this regular income stream can be an attractive proposition, offering consistent cash flow.
What sets XYLD apart is its lower volatility when compared to directly investing in the S&P 500 through ETFs like SPY. The covered call strategy acts as a buffer, helping to reduce the fund’s overall volatility. This characteristic makes it particularly well-suited for conservative investors who prioritize capital preservation.
It’s worth noting that higher market volatility often translates into increased premiums earned by the fund. This dynamic can further enhance the yield potential for XYLD, making it an enticing option during turbulent market conditions.
Additionally, XYLD can save investors valuable time and effort. If you were to take on the task of writing call options on the S&P 500 yourself, it would require substantial research, monitoring, and active management. XYLD simplifies this process by offering a diversified investment strategy that automatically implements the covered call approach.
Liquidity is another advantage of XYLD. With over 6 billion dollars in assets under management, the fund offers ample liquidity, ensuring that investors can efficiently buy and sell shares as needed.
In summary, the XYLD ETF presents a diversified investment opportunity that combines an attractive yield, lower volatility, and the convenience of a professionally managed covered call strategy. This blend of features makes it an appealing choice for conservative investors, income seekers, or those looking to streamline their investment approach.
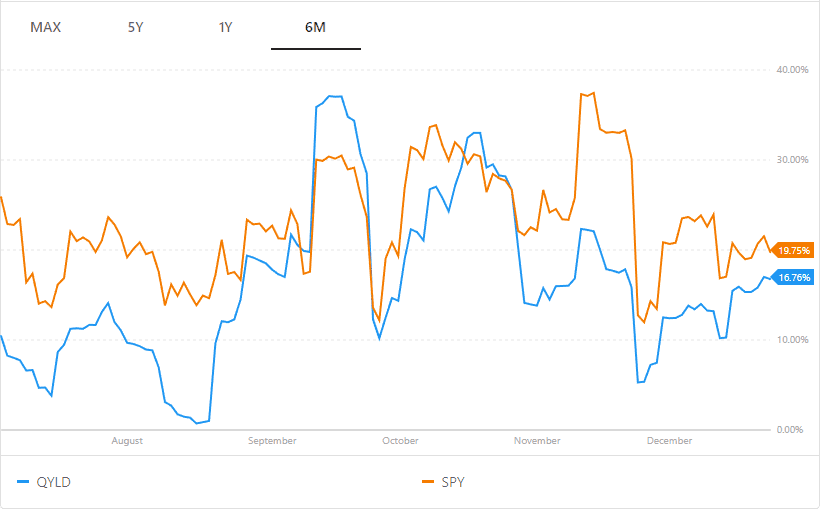
Volatility comparison: XYLD has a lower volatility than the S&P 500 (source of graphic: portfoliolabs.com)
Negatives
However, it’s essential to be aware of a couple of potential drawbacks. Firstly, while the ETF’s strategy is effective in generating income and reducing volatility, it does mean that investors may miss out on the full upside potential of the S&P 500. The covered call strategy inherently places a cap on the fund’s potential for capital appreciation, which can be a trade-off for the income it provides.
Secondly, it’s important to acknowledge that the strategy of covered calls may become less effective in an unpredictable or highly volatile market. While it can act as a risk management tool during normal market conditions, extreme fluctuations can challenge the effectiveness of this approach.
Top Holdings
| Net Assets (%) | Name |
|---|---|
| 6.28 | APPLE INC |
| 5.37 | MICROSOFT CORP |
| 2.58 | AMAZON.COM INC |
| 1.73 | ALPHABET INC-CL A |
| 1.71 | BERKSHIRE HATH-B |
| 1.55 | ALPHABET INC-CL C |
| 1.43 | EXXON MOBIL CORP |
| 1.41 | UNITEDHEALTH GROUP INC |
| 1.38 | JOHNSON & JOHNSON |
| 1.30 | NVIDIA CORP |
RYLD -Global X Russell 2000 Covered Call ETF
RYLD is an index ETF with an active covered call strategy in place to enhance yield. The index tracked is the Russell 2000, which consists of small to mid cap stocks. This fund is different than XYLD or QYLD because the focus here is not on large cap stocks. When investing in small caps, investors hope usually for higher growth. Small caps are also known to outperform large caps in begenning of the growth phase of the economy.
RYLD writes call options on the Russell 2000 Index (a succession of one-month at-the-money covered call options). The fund does not use leverage.
The Russel 2000 top three holdings are Ovintiv, Avis Budget Group, and Antero Resources.
[stock_market_widget type=”card” template=”basic” color=”#5679FF” assets=”RYLD” display_currency_symbol=”true” api=”yf”]
[stock_market_widget type=”chart” template=”basic” color=”#5679FF” assets=”RYLD” range=”1mo” interval=”1d” axes=”true” cursor=”true” range_selector=”true” display_currency_symbol=”true” api=”yf”]
Top Holdings
| Net Assets (%) | Name |
|---|---|
| 31.40 | VANGUARD RUSSELL 2000 ETF |
| 0.23 | IRIDIUM COMMUNIC |
| 0.23 | CROCS INC |
| 0.22 | INSPIRE MEDICAL |
| 0.21 | HALOZYME THERAPEUTICS INC |
| 0.21 | MATADOR RESOURCES CO |
| 0.21 | EMCOR GROUP INC |
| 0.21 | TEXAS ROADHOUSE INC |
| 0.20 | RBC BEARINGS INC |
| 0.20 | AGREE REALTY CORP |
QYLG -Global X Nasdaq 100 Covered Call & Growth ETF
As shown in the table above, summary of strategies. This fund is one of the ETFs whose objective is to seek both growth and income. Therefore, the strategy in place uses covered call options, however, on only 50% of the portfolio. In other words, QYLG is similar to QYLD but it will offer less dividends and more room for growth. Besides, in normal market conditions, QYLG will be more volatile than QYLD.
As its name implies, QYLG is an index fund and is replicating the portfolio constituents of the Nasdaq 100.
[stock_market_widget type=”card” template=”basic” color=”#5679FF” assets=”QYLG” display_currency_symbol=”true” api=”yf”]
[stock_market_widget type=”chart” template=”basic” color=”#5679FF” assets=”QYLG” range=”1mo” interval=”1d” axes=”true” cursor=”true” range_selector=”true” display_currency_symbol=”true” api=”yf”]
Top Holdings
| Net Assets (%) | Name |
|---|---|
| 11.84 | APPLE INC |
| 11.78 | MICROSOFT CORP |
| 6.54 | AMAZON.COM INC |
| 3.91 | ALPHABET INC-CL C |
| 3.87 | ALPHABET INC-CL A |
| 3.66 | NVIDIA CORP |
| 2.75 | TESLA INC |
| 2.72 | META PLATFORMS INC |
| 2.07 | PEPSICO INC |
| 2.02 | BROADCOM INC |
XYLG -Global X S&P 500 Covered Call & Growth ETF
As shown in the table above, summary of strategies. This fund is one of the ETFs whose objective is to seek both growth and income. Therefore, the strategy in place uses covered call options, however, on only 50% of the portfolio. In other words, XYLG is similar to XYLD but it will offer less dividends and more room for growth. Besides, in normal market conditions, XYLG will be more volatile than XYLD.
As its name implies, XYLG is an index fund and is replicating the portfolio constituents of the S&P 500.
[stock_market_widget type=”card” template=”basic” color=”#5679FF” assets=”XYLG” display_currency_symbol=”true” api=”yf”]
[stock_market_widget type=”chart” template=”basic” color=”#5679FF” assets=”XYLG” range=”1mo” interval=”1d” axes=”true” cursor=”true” range_selector=”true” display_currency_symbol=”true” api=”yf”]
XYLG – Top Holdings
| Net Assets (%) | Name |
|---|---|
| 6.23 | APPLE INC |
| 5.33 | MICROSOFT CORP |
| 2.56 | AMAZON.COM INC |
| 1.71 | ALPHABET INC-CL A |
| 1.69 | BERKSHIRE HATH-B |
| 1.53 | ALPHABET INC-CL C |
| 1.41 | EXXON MOBIL CORP |
| 1.39 | UNITEDHEALTH GROUP INC |
| 1.37 | JOHNSON & JOHNSON |
| 1.29 | NVIDIA CORP |
XYLG – Sector allocation
| SECTOR | WEIGHT (%) |
|---|---|
| Information Technology | 25.6 |
| Health Care | 15.9 |
| Financials | 11.6 |
| Consumer Discretionary | 9.8 |
| Industrials | 8.8 |
| Communication Services | 7.3 |
| Consumer Staples | 7.2 |
| Energy | 5.2 |
| Utilities | 3.2 |
| Materials | 2.7 |
DJIA -Global X Dow 30 Covered Call ETF
This fund allows investors to track 30 Dow stocks and generate income through issuing covered call options. DJIA is less diversified than XYLD, since the S&P 500 is much larger and broader than the Dow 30.
The 30 companies making up the index are mostly bluechips.
[stock_market_widget type=”card” template=”basic” color=”#5679FF” assets=”DJIA” display_currency_symbol=”true” api=”yf”]
[stock_market_widget type=”chart” template=”basic” color=”#5679FF” assets=”DJIA” range=”1mo” interval=”1d” axes=”true” cursor=”true” range_selector=”true” display_currency_symbol=”true” api=”yf”]
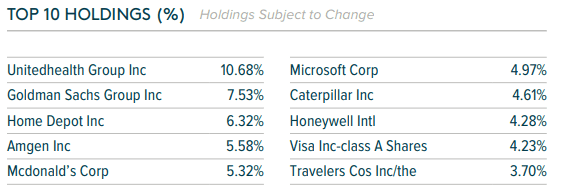
DJIA Top 10 holdings