The Harvest Retirement Income ETF (HRIF) deserves attention for those particularly interested in retirement income solutions. HRIF is designed to offer a combination of income and growth by investing in an actively managed portfolio of equities. Let’s delve into what makes HRIF a notable option for investors, especially those nearing or in retirement.
Objective: The Harvest Retirement Income ETF aims to provide unitholders with a monthly cash distribution. There is also opportunity for capital appreciation. It targets a mix of equity income securities, focusing on quality companies with the potential for long-term growth.
Strategy: HRIF typically includes a diversified set of holdings across various sectors and geographies. The idea is to generate income through dividends and capital gains. The fund maintains a focus on companies that exhibit stability and growth potential.
Income Focus with Growth Potential: HRIF is particularly appealing to retirees or those close to retirement who are looking for a steady stream of income. The ETF’s strategy of investing in income-generating equities allows for a focus on distribution, which is crucial for investors relying on their investment for regular income.
Diversification: By investing in a range of sectors and geographies, HRIF offers diversification, which is key in managing risk, especially for retirees who may have a lower risk tolerance. Diversification can help smooth out returns and protect against sector-specific downturns.
Professional Management: HRIF is actively managed, meaning a team of professionals selects the holdings based on rigorous analysis. This can be an advantage for investors who prefer not to manage their own portfolios or those who value professional oversight in selecting quality income-generating investments.
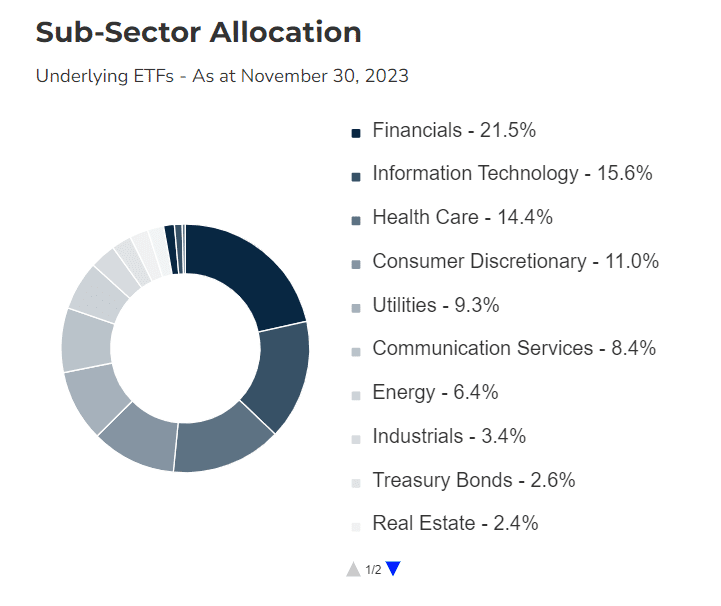
HRIF ETF Sector allocation
Considerations
Fees: As with any managed fund, it’s important to consider the fees associated with HRIF. Higher fees can eat into returns over time, so weigh the cost against the potential benefits of professional management and strategy.
Market Risks: While HRIF aims to invest in stable, income-producing equities, it’s still subject to market risks. Economic downturns, sector-specific issues, or global events can affect the performance of the investments within the ETF.
Performance: Look at the historical performance of HRIF, but remember that past performance is not indicative of future results. Consider how the ETF has done in various market conditions and how it aligns with your risk tolerance and time horizon.
Conclusion
The Harvest Retirement Income ETF (HRIF) is an option worth considering for those focused on generating income in their retirement years. With its strategy of investing in a diversified portfolio of income-generating equities, HRIF seeks to provide a balance between income and growth. As with any investment, it’s crucial to understand your own financial situation, risk tolerance, and investment goals. Consult with a financial advisor to determine if HRIF or any other investment is a suitable part of your retirement planning strategy. Happy and wise investing!
Investing in semiconductor ETFs can be a smart way to gain exposure to the rapidly growing technology sector. Semiconductors are the backbone of modern electronics, powering everything from smartphones to advanced AI systems. Here, we explore some of the best semiconductor ETFs available to Canadian investors.
Why Invest in Semiconductor ETFs?
Growth Potential
The semiconductor industry is at the forefront of technological advancements, driving innovation in various fields such as artificial intelligence (AI), 5G, and autonomous vehicles. Leading companies like NVIDIA, AMD, and TSMC have shown remarkable growth due to their critical role in these cutting-edge technologies.
NVIDIA (NVDA): NVIDIA’s stock price increased by approximately 120% over the past year, driven by high demand for its GPUs, which are essential for AI, gaming, and data center applications.
Advanced Micro Devices (AMD): AMD saw its stock price rise by about 80%, benefiting from strong sales of its CPUs and data center processors, which compete directly with Intel.
Taiwan Semiconductor Manufacturing Company (TSMC) (TSM): TSMC’s stock increased by roughly 50%, supported by its position as the world’s largest contract chip manufacturer, with significant demand from clients like Apple and NVIDIA.
Company Name
Stock Price Increase
Key Performance Drivers
NVIDIA (NVDA)
~120%
High demand for gaming GPUs, AI applications, data centers
Advanced Micro Devices (AMD)
~80%
Competitive CPUs, data center processors, gaming market
Taiwan Semiconductor (TSMC) (TSM)
~50%
Demand from major clients, leading-edge technology
Intel Corporation (INTC)
~20%
Demand for PCs and data centers, substantial investments
Performance of Popular Semiconductor Stocks in the Past Year
Diversification
Investing in a semiconductor ETF provides diversification within the semiconductor sector, reducing the risk associated with investing in individual stocks. By holding a broad range of semiconductor companies, ETFs mitigate the impact of any single company’s performance on the overall investment. For example:
Accessibility
ETFs offer an easy and cost-effective way for Canadian investors to gain exposure to international semiconductor companies. They allow investors to participate in the growth of leading semiconductor firms without needing to invest directly in foreign markets.
1. iShares PHLX Semiconductor ETF (SOXX)
While not a Canadian-specific ETF, the iShares PHLX Semiconductor ETF (SOXX) is accessible to Canadian investors and is one of the most popular semiconductor ETFs. It tracks the performance of the PHLX Semiconductor Sector Index, which includes companies primarily involved in the design, distribution, manufacture, and sale of semiconductors.
Key Features:
Expense Ratio: 0.46%
Top Holdings: NVIDIA, Intel, Texas Instruments
Dividend Yield: Approximately 0.73%
Performance: Historically strong, driven by the growth of the semiconductor industry.
2. VanEck Vectors Semiconductor ETF (SMH)
Another U.S.-based but widely available option is the VanEck Vectors Semiconductor ETF (SMH). This ETF tracks the MVIS US Listed Semiconductor 25 Index, which provides exposure to the largest and most liquid companies in the semiconductor industry.
Key Features:
Expense Ratio: 0.35%
Top Holdings: Taiwan Semiconductor Manufacturing, NVIDIA, Intel
Dividend Yield: Approximately 0.62%
Performance: Consistently solid returns, benefiting from the sector’s overall growth.
3. Invesco Dynamic Semiconductors ETF (PSI)
The Invesco Dynamic Semiconductors ETF (PSI) is designed to track the performance of the Dynamic Semiconductor Intellidex Index, which evaluates companies based on a variety of investment criteria, including fundamental growth, stock valuation, investment timeliness, and risk factors.
Key Features:
Expense Ratio: 0.56%
Top Holdings: Broadcom, NVIDIA, Advanced Micro Devices
Dividend Yield: Approximately 0.34%
Performance: Focused on dynamic and innovative semiconductor companies, offering strong potential for growth.
4. Horizons Global Semiconductor Index ETF (CHPS)
For a Canada-specific option, the Horizons Global Semiconductor Index ETF (CHPS) provides Canadian investors direct exposure to global semiconductor companies. This ETF seeks to replicate the performance of the Solactive Capped Global Semiconductor Index, net of expenses.
Key Features:
Expense Ratio: 0.60%
Top Holdings: Broadcom, Intel, Advanced Micro Devices
Dividend Yield: N/A
Performance: Offers a diverse exposure to global leaders in the semiconductor industry.
How to Invest
Canadian investors can purchase these ETFs through their brokerage accounts (such as CIBC investors’ edge). It’s important to consider factors like the expense ratio, historical performance, and the specific holdings of each ETF to align with your investment goals.
Conclusion
Semiconductor ETFs present an exciting opportunity for Canadian investors looking to tap into the growth of the technology sector. Whether opting for global ETFs like SOXX or SMH, or a more Canada-focused option like CHPS, there are various choices to suit different investment strategies. Always conduct thorough research or consult with a financial advisor to ensure these investments align with your financial goals and risk tolerance.
For more insights on ETFs and other investment opportunities, continue exploring our blog for the latest updates and tips.
In this post, we will compare popular Canadian Bank ETFs in terms of performance, MER, Dividend yield and volatility. But first, we will discuss the banking sector futur perspectives.
Executive summary
Banking sector perspectives
How to explain the great performance of the Canadian banking sector during the pandemic?
News of faster economic growth than anticipated seem to have favored the banking sector in the past months. Large Banks benefited from:
1-Trading: revenues are soaring from an exceptional year. Retail investors were abnormally active and trading much more than usual which increased commissions’ revenues for Banks;
2-Releasing large sums of money that were held in reserves to hedge against expected loan losses due to pandemic. These losses never materialized.
What’s next for the banking sector?
The Banking sector is poised to benefit from a tighter monetary policy. This is because rising rates will help in boosting profits for banks, insurance companies, discount brokerage firms and asset managers. The difference between short and long-term interest rates is likely to improve banks’ net interest margins.
HCAL Hamilton Canadian Bank 1.25X Levrage ETF has the highest MER among selected ETFs. Considering that one can easily replicate the portfolio held by most of the ETFs above, it’s wise to choose ETFs that charge minimal fees. ZEB has the lowest MER at only 0.28.
The ETFs above have different strategies that can be summrized below:
Equal weight
An equally weighted portfolio of ETFs is a type of investment portfolio in which all the securities in the portfolio are given the same weight or allocation, regardless of their market capitalization or other factors.
Leverage
A leveraged ETF is an exchange-traded fund (ETF) that seeks to deliver multiples of the daily or intra-day return of an underlying index or asset. Leveraged ETFs typically use financial derivatives such as futures, options, and swaps to achieve their leverage. HCAL uses for instance 1.25 leverage. A 1.25 leverage ETF is an exchange-traded fund (ETF) that aims to provide 125% of the daily return of the underlying index or asset that it tracks.;
Active
An active ETF is an exchange-traded fund (ETF) that is managed by an investment manager who aims to outperform the market or achieve a specific investment objective. Unlike passive ETFs, which track a particular index or benchmark, active ETFs use a variety of investment strategies such as fundamental analysis, quantitative analysis, and technical analysis to make investment decisions and attempt to generate alpha (excess returns) compared to the market.
Passive
mainly XFN, which replicates the S&P/TSX Capped Financials Index. A passive ETF is an exchange-traded fund (ETF) that seeks to track the performance of a specific index or benchmark. Passive ETFs typically hold the same securities as the underlying index or benchmark, in the same proportions as the index or benchmark. They aim to provide investors with exposure to a diversified portfolio of securities at a low cost.
Best Canadian Financial ETFs: Performance comparison
Based on historical performance alone, the ZEB -BMO S&P TSX Equal Weight Banks ETF had the second best performance in the last 5 years. Additionally, the fund pays a dividend yield of around 4%. The management expense ratio is 0.28%, the lowest on our list. ZEB invests in the 6 largest Canadian banks equally.
Another competitor to ZEB is the RBNK – RBC CDN Bank Yield Index fund. This fund is newer and has had the best performance over 5 years. This fund also benefits from a very competitive management fee of 0.33%. The RBNK manager favors in its investment strategy the 2 Canadian banks that offer the highest rate of return (with an allocation of 25% each), followed by the banks that offer the lowest rate of return.
HEWB had the best performance year-to-date and over 3 years. However, this fund does not pay dividends. HEWB is similar to ZEB. Indeed, the fund holds equally the main Canadian banks.
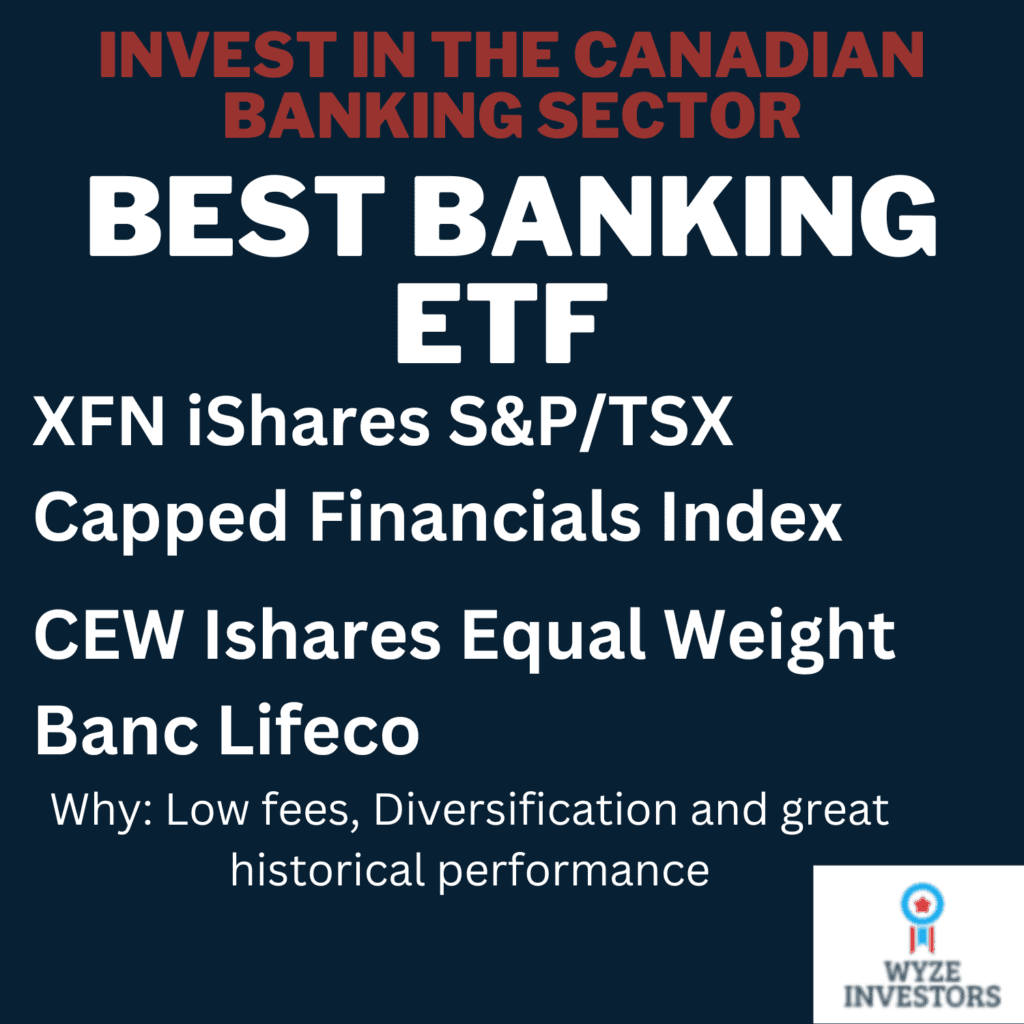
CEW Ishares Equal Weight Banc Lifeco and XFN iShares S&P/TSX Capped Financials Index are also good choices based on long-term performance. Both pay a dividend yield of around 4%.
For those looking for high dividend income, FIE Ishares CDN Fin Mthly Income offers an attractive dividend yield of over 6%. This fund invests about 80% of these holdings in bank stocks and the rest in a preferred stock ETF. HCAL – Hamilton Can Bank 1.25X Lvrg and HCA – Hamilton Canadian Bank Mean Reversion are also good alternatives. The only downside with his funds is the relatively high management fees. For FIE, the long-term return is low compared to other funds.
ZWB – BMO Covered Call Canadian Banks is ideal for investors who want to earn high dividends and lower their risk at the same time. ZWB is what is known as a covered call option writing fund. This type of fund has two purposes:
1- reduce the risk (volatility) of the portfolio by selling covered call options;
2- improve the dividend yield with the premiums earned following the issuance of covered call options.
The major disadvantage of this strategy is that the performance will be lower.
Ishares CDN Fin Monthly Income seeks to maximize total return and to provide a stable stream of monthly cash distributions. FIE has a high exposure to the financial sector.
Please consult issuers’ website for up-to-date figures
ZEB – BMO S&P TSX Equal Weight Banks Index ETF
The BMO Equal Weight Banks ETF has been designed to replicate, to the extent possible, the performance of the Solactive Equal Weight Canada Banks Index, net of expenses. The index includes the major Canadian banks with a balanced allocation as you can see in the composition of the portfolio below.
★★★★
Holding details
Weight (%)
Name
17,18%
BANK OF MONTREAL
16,90%
TORONTO-DOMINION BANK/THE
16,78%
CANADIAN IMPERIAL BANK OF COMMERCE
16,59%
NATIONAL BANK OF CANADA
16,50%
ROYAL BANK OF CANADA
15,86%
BANK OF NOVA SCOTIA/THE
0,19%
CASH
Please consult issuers’ website for up-to-date data
ZWB – BMO Covered Call Canadian Banks
The ZWB aims to provide exposure to a portfolio of dividend-paying securities (Canadian Banks), while collecting premiums related to call options. The portfolio is chosen on the basis of the criteria below:
• dividend growth rate,
• yield
• payout ratio and liquidity.
ZWB Morningstar rating
★★★
ZWB holdings
Name
Weight
BMO Equal Weight Banks ETF
27.2%
Bank of Montreal
12.9%
Canadian Imperial Bank of Commerce
12.7%
Royal Bank of Canada
12.1%
National Bank of Canada
11.9%
The Toronto-Dominion Bank
11.9%
Bank of Nova Scotia
11.4%
Please visit issuers’ website for up-to-date figures
RBNK – RBC CDN Bank Yield Index
RBC Canadian Bank Yield Index ETF seeks to replicate the Solactive Canada Bank Yield Index. The latter is focused only on the Canadian banking industry.
RBNK Morningstar rating
★★★★★
RBNK Holdings
Holdings
Assets
CANADIAN IMPERIAL BANK OF COMMERCE
26.7%
BANK OF NOVA SCOTIA
23.7%
ROYAL BANK OF CANADA
17.1%
TORONTO-DOMINION BANK
15.6%
BANK OF MONTREAL
8.5%
NATIONAL BANK OF CANADA
8.4%
Please consult issuers’ website for up-to-date data
HCA – Hamilton Canadian Bank Mean Reversion
HCA invests in the 6 largest Canadian banks. This fund differentiates itself by its investment strategy, called “Mean reversion”.
The strategy is applied as follows:
80% of the portfolio in the 3 banks that performed the least well among the 6 largest Canadian banks; 20% remaining in the 3 banks which outperformed.
HCA holdings
As of December 31st
NAME
Weight
Bank of Nova Scotia
27.9%
Toronto-Dominion Bank
27.1%
Royal Bank of Canada
26.4%
Bank of Montreal
6.4%
Canadian Imperial Bank of Commerce
6.2%
National Bank of Canada
6.0%
CEW -Ishares Equal Weight Banc Lifeco
CEW Invests in a portfolio of common shares of Canada’s largest banks and life insurance companies.
CEW Morningstar rating
★★★★
CEW Holdings
NAME
Weight %
GREAT WEST LIFECO INC
10,16
IA FINANCIAL INC
10,12
TORONTO DOMINION
10,06
NATIONAL BANK OF CANADA
10,05
MANULIFE FINANCIAL CORP
10,00
BANK OF NOVA SCOTIA
9,92
SUN LIFE FINANCIAL INC
9,90
BANK OF MONTREAL
9,86
CANADIAN IMPERIAL BANK OF COMMERCE
9,78
ROYAL BANK OF CANADA
9,70
HEWB – Horizons Eql Wght Can Banks Index
The Horizons Equal Weight Canada Banks Index ETF (“HEWB”) seeks to replicate the performance of the Solactive Equal Weight Canada Banks Index. The Index is an equal-weight index of equity securities of six Canadian banks.
HEWB Morningstar rating
★★★★
HEWB Holdings
Security Name
Weight
TORONTO-DOMINION BANK
17.17%
BANK OF NOVA SCOTIA
16.82%
NATIONAL BANK OF CANADA
16.77%
BANK OF MONTREAL
16.65%
ROYAL BANK OF CANADA
16.37%
CANADIAN IMPERIAL BANK OF COMMERCE
16.23%
Please consult issuers’ website for up-to-date data
HCAL – Hamilton Canadian Bank 1.25X Lvrg
Hamilton Enhanced Canadian Bank ETF aims to provide investors with a unique way to participate in the performance of the Canadian banking sector. It’s designed to track 1.25 times the returns of the Solactive Equal Weight Canada Banks Index. Essentially, for every 1% increase (or decrease) in the index, HCAL aims to increase (or decrease) by 1.25%. It achieves this by investing directly in Canadian banks and employing a modest 25% cash leverage. Unlike some other funds, HCAL does not use derivatives.
As at December 29, 2023
TICKER
NAME
WEIGHT
HEB
Hamilton Canadian Bank Equal-Weight Index ETF
125.1%
Leverage is via cash borrowing (not derivatives), provided by a Canadian financial institution.
Please consult issuers’ website for up-to-date data
XFN -iShares S&P/TSX Capped Financials Index
This is a passive strategy ETF. It replicates the performance of the S&P/TSX Capped Financials Index, net of expenses.
XFN Holdings
Name
Weight %
ROYAL BANK OF CANADA
19.38
TORONTO DOMINION
18.36
BANK OF NOVA SCOTIA
10.58
BROOKFIELD ASSET MANAGEMENT INC CL
10.36
BANK OF MONTREAL
9.18
CANADIAN IMPERIAL BANK OF COMMERCE
6.87
MANULIFE FINANCIAL CORP
5.06
SUN LIFE FINANCIAL INC
3.81
NATIONAL BANK OF CANADA
3.26
INTACT FINANCIAL CORP
3.04
Investment Objective
ENCL ETF seeks to provide, to the extent possible and net of expenses:
(a) Exposure to the performance of an index of Canadian companies involved in the crude oil and natural gas industry (currently, the Solactive Equal Weight Canada Oil & Gas Index). This index aims to offer diversified exposure to various companies in the Canadian energy sector, spreading out the investment risk. (b) High monthly distributions of dividend income and call option premiums. To generate premiums, ENCL uses a dynamic covered call option writing program. While this strategy can enhance income, it also limits the potential for capital appreciation.
Magnified Growth Potential
ENCL aims to unlock the growth potential of Canadian oil and gas companies by using light leverage of 125%. This means for every dollar invested, the fund has $1.25 working in the market. This leverage can enhance growth potential and yield, but it’s important to note that it also increases the risk. The use of leverage means that while potential gains can be higher, potential losses can be magnified as well.
High-Income Potential
ENCL employs a covered call strategy to potentially enhance portfolio income while aiming to reduce volatility. By selling call options on its holdings, ENCL can generate additional income. This strategy can provide a cushion against market downturns, but it also means capping the upside potential of the investments. If the underlying stock prices rise significantly, the gains from those stocks may be limited due to the obligations of the call options.
Monthly Distributions
ENCL is designed to provide consistent monthly income along with potential long-term capital growth. This can be attractive for investors seeking regular cash flow. However, the reliance on covered call strategies and leverage means that the consistency and amount of these distributions can vary based on market conditions.
Management Expense Ratio (MER)
The management expense ratio (MER) of ENCL is 2.42%. This fee covers the costs associated with managing the ETF, including administrative expenses, and can impact the overall returns. Investors should consider whether the potential benefits of ENCL’s strategy outweigh the costs.
Risk Factors
1. Leverage Risk: ENCL uses leverage to enhance returns, which also amplifies potential losses. In volatile markets, leveraged ETFs can experience significant price swings, leading to higher risk.
2. Market Risk: ENCL’s performance is tied to the Canadian oil and gas industry. Any downturn in this sector, due to fluctuating oil prices, regulatory changes, or economic conditions, can negatively impact the ETF’s value.
3. Covered Call Strategy Risk: While selling covered calls can generate income and reduce volatility, it also limits the upside potential. If the underlying stock prices rise significantly, the gains may be capped due to the call options sold.
4. Distribution Variability: The consistency and amount of monthly distributions can vary based on market conditions and the performance of the covered call strategy. Investors should not rely solely on these distributions for their income needs.
5. High Management Expense Ratio: With a MER of 2.42%, the cost of managing ENCL is relatively high. This fee can erode overall returns, especially in comparison to lower-cost ETFs.
Conclusion
ENCL offers exposure to the Canadian oil and gas sector with a strategy designed to enhance growth and income through leverage and covered call options. While these strategies can increase income and potential returns, they also introduce higher risk and can cap the upside potential. With a management expense ratio of 2.42%, investors should weigh these trade-offs and ensure that ENCL aligns with their risk tolerance and investment goals.
In today’s fast-paced and ever-changing financial landscape, finding opportunities to grow your savings while minimizing risk can be a challenge. However, for Canadian investors seeking a reliable and high-interest savings option, the Purpose High Interest Savings Fund (PSA ETF) offers a compelling solution. In this article, we will delve into the features and benefits of the PSA ETF, shedding light on its potential to optimize your savings strategy.
What’s a High interest savings ETF?
High interest savings ETF are financial instruments designed to give investors a means to save capital while earning a competitive interest rate. Furthermore, they can provide investors with better returns than typical savings accounts or money market funds (while maintaining a high level of liquidity and safety, one of their main benefits).
These ETFs are often seen as relatively low-risk investments, in contrast to stocks or other types of investments.
PSA investment objective
PSA is relatively low risk investment suitable for investors looking for an alternative to high interest deposit accounts.
You can click on the ticker of each ETF to visit the issuer’s website. Please note the dividend yield shown on the issuers’ websites corresponds to the forward dividend yield. The latter is a projection based on the last dividend paid.
The trailing dividend yield shown in the table above is the dividend yield calculated using the dividend paid in the last 350 days.
GIC vs High interest saving ETFs
Investment Option
GIC
High-Interest Savings ETF
Type of Investment
Low-risk
Low to moderate risk
Return
Guaranteed fixed rate of return
Potentially higher rate of return
Term
Typically 1 to 5 years
No fixed term
Interest Rate
Typically higher than savings accounts
Varies depending on market conditions
Risk
Very low risk
Higher risk than GICs
Guarantee
Guaranteed by the issuing institution
No guarantee of return
Suitability
Suitable for risk-averse investors
Suitable for those seeking higher returns with moderate risk toleranc
Difference between Forward and Trailing dividend yield
Forward dividend yield and trailing dividend yield are both measures of a company’s dividend payout to its shareholders, but they differ in the time period used to calculate them.
Trailing dividend yield is calculated based on the dividends paid over the past 12 months, divided by the current stock price. It provides an indication of how much a company has paid out in dividends over the past year, relative to its current stock price.
Forward dividend yield, on the other hand, is calculated based on the expected dividends that will be paid out in the future, divided by the current stock price. It provides an indication of how much a company is expected to pay out in dividends over the next 12 months, relative to its current stock price.
The main difference between the two is that forward dividend yield is a projection of what is expected to happen in the future, whereas trailing dividend yield is based on actual historical data. As a result, forward dividend yield can be more speculative and less reliable than trailing dividend yield.
Investors may use both measures in combination to get a more complete picture of a company’s dividend payout.
Investing in the stock market has become increasingly popular over the years, and exchange-traded funds (ETFs) have become a popular way to gain exposure to various markets. Two of the most popular ETFs in Canada are the Vanguard U.S. Total Market Index ETF (VUN) and the Vanguard S&P 500 Index ETF (VFV). While both funds are managed by Vanguard, they differ in terms of their composition and investment strategies. In this article, we will compare VUN vs VFV to help investors decide which one is right for them.
Difference in investments objectives
Composition The VUN ETF aims to track the performance of the CRSP US Total Market Index, which includes approximately 3,500 stocks covering the entire US equity market. This means that VUN provides exposure to both large and small US companies across a variety of sectors.
On the other hand, the VFV ETF aims to track the performance of the S&P 500 Index, which includes 500 of the largest US companies, such as Apple, Microsoft, and Amazon. Therefore, VFV is heavily weighted towards large-cap companies in the US, which can make it more volatile than VUN.
The VUN ETF follows a passive investment strategy, which means it simply aims to replicate the performance of its underlying index. The fund holds a diverse range of US companies and maintains a long-term investment horizon.
The VFV ETF also follows a passive investment strategy, but it invests exclusively in large-cap US companies, making it more focused than VUN. VFV also has a higher concentration of technology stocks compared to VUN, which may be attractive to investors who believe that the tech industry will continue to grow.
When comparing the sector allocation of the Vanguard S&P 500 Index ETF (VFV) to the Vanguard U.S. Total Market Index ETF (VUN), some notable differences are evident. VUN has a higher allocation to the Information Technology sector, with 27.35% compared to VFV’s 26.10%.
VFV also has a higher allocation to the Health Care sector at 14.21% compared to VUN’s 13.53%.
On the other hand, VUN has a higher allocation to Consumer Discretionary and Industrials, with 14.16% and 13.27%, respectively, compared to VFV’s 10.14% and 8.66%. This indicates that VUN provides more exposure to consumer spending and manufacturing sectors in the US economy.
Fees VUN vs VFV
Fees When investing in ETFs, it’s important to consider the fees associated with each fund. The VUN ETF has a management fee of 0.16%, which is slightly lower than the VFV ETF’s management fee of 0.08%. However, VFV has a slightly higher trading volume than VUN, which may make it more attractive to investors who value liquidity.
Conclusion
Conclusion In summary, both VUN and VFV ETFs offer exposure to the US stock market, but they differ in their composition, investment strategy, and fees. VUN provides exposure to a diverse range of US companies, while VFV is heavily weighted towards large-cap companies in the US. Both funds follow a passive investment strategy, but VFV is more focused than VUN. Investors should carefully consider their investment goals, risk tolerance, and investment horizon before deciding which ETF is right for them.
Investment objective
The BMO Canadian High Dividend Covered Call ETF (ZWC) has been designed to provide exposure to a dividend focused portfolio, while earning call option premiums. The underlying portfolio is yield-weighted and broadly diversified across sectors.
The fund selection methodology uses 4 factors: – Liquidity; – Dividend growth rate; – Yield and payout ratio.
What’s unique about this ETF is that it uses covered calls to protect against downside risk. This being said, the covered call strategy provides limited downside protection. Also, when you write a covered call, you give up some of the stock’s potential gains. These ETFs will tend to have a higher yield and a lower performance.
ZWC is an excellent option for conservative investors looking for a steady income and low volatility. It’s tax-efficient because the dividends are all coming from Canadian companies. The financial sector and Energy represents 53% of the total overall sector allocation.
VFV and VGG are two popular ETFs that offer different approaches to investing in stocks. In this post, we will explore the intricacies of both funds, from their investment objectives to fees, helping you understand how they might fit into your investment strategy (VGG vs VFV).
Investment Objective VGG vs VFV
VFV (Vanguard S&P 500 Index ETF) aims to track the performance of the S&P 500 Index. This index represents 500 of the largest U.S. companies, spanning various industries. Investors in VFV gain exposure to some of the biggest and most influential firms in the United States. The primary goal is to mirror the return of the S&P 500, less expenses.
On the other hand, VGG (Vanguard U.S. Dividend Appreciation Index ETF) focuses on U.S. companies that have a history of increasing their dividends over time. Instead of mirroring the broader market like VFV, VGG targets companies that are likely to grow their dividends. This strategy can appeal to investors seeking steady income growth and a focus on companies with potential for long-term value.
Suitability
When considering VFV, it’s suitable for investors looking for broad exposure to the U.S. equity market, particularly the large-cap sector. It’s well-suited for those who believe in the long-term growth potential of the largest U.S. companies and prefer a passive investment strategy.
VGG is more suitable for investors seeking income growth along with capital appreciation. If you prioritize dividend growth and companies with a stable, increasing dividend policy, VGG might be more appealing. It’s often favored by those planning for retirement or who want a steady income stream from their investments.
VFV’s dividend yield 1.29% reflects the overall yield of the S&P 500. While it includes high-yielding companies, the focus isn’t specifically on dividends. The yield might be lower compared to specialized dividend funds, but it offers the growth potential of the S&P 500’s large-cap stocks.
In contrast, VGG specifically targets companies that have a track record of growing their dividends. Therefore, its dividend yield might be attractive to those seeking regular income (1.50%). The emphasis is on dividend growth, which can lead to higher income over time as companies increase their payouts.
Taxation of Dividends VGG vs VFV
For Canadian investors focusing on VFV and VGG, understanding the tax treatment of dividends from these U.S.-based ETFs is crucial. Dividends paid by U.S. companies to foreign investors are generally subject to a withholding tax. For Canadians, the rate is typically 15% due to the Canada-U.S. tax treaty. This means when dividends are paid out from these ETFs, a portion is withheld as tax by the U.S. before they reach the investor.
if held in non registered accounts
However, the type of account you hold these ETFs in can affect the taxation of dividends. If you hold VFV or VGG in a non-registered account, the 15% U.S. withholding tax applies, and you’ll receive the net amount. This tax can often be claimed as a foreign tax credit on your Canadian tax return, preventing double taxation.
if held in a registered accounts
On the other hand, if you hold these ETFs in a registered account like an RRSP, the situation differs. Due to the specific nature of the tax treaty between Canada and the U.S., the withholding tax on dividends may be waived for investments held in RRSPs, recognizing them as retirement savings. This makes RRSPs an attractive option for holding U.S. equities or ETFs like VFV and VGG, as it can increase the net dividend income you receive.
For investments held in a TFSA or other registered accounts not recognized for the tax treaty benefit, such as a RESP or RDSP, the 15% withholding tax generally still applies and is not recoverable. It’s important to consider the type of account when making investment decisions to optimize the tax efficiency of your U.S. equity investments.
Consulting with a tax professional or financial advisor is recommended to understand the full implications based on your personal investment situation and to make informed decisions. They can provide advice tailored to your circumstances, including how to structure your investments and navigate the tax implications effectively.
Fees VGG vs VFV
When it comes to fees, VFV is known for its low-cost approach, which is a hallmark of Vanguard’s offerings (0.09% MER). The management fee for VFV is relatively low, making it an attractive option for those who want to minimize costs. Lower fees mean that more of your investment goes towards market returns rather than administrative costs.
Similarly, VGG also benefits from Vanguard’s commitment to low fees. However, the nature of the dividend-focused strategy might lead to slightly different cost structures compared to VFV (MER 0.30%). Investors should compare the management expense ratios (MERs) and any additional costs associated with trading or holding these ETFs to understand the total cost of ownership.
Conclusion
In choosing between VFV and VGG, consider your financial goals, risk tolerance, and investment strategy. VFV offers broad exposure to the U.S. equity market with a focus on large-cap growth, while VGG targets dividend growth and may suit those looking for income along with capital appreciation. Be mindful of the dividend yields, tax implications, and fees associated with each ETF.
As with any investment, it’s crucial to conduct thorough research or consult with a financial advisor to understand how these ETFs fit into your overall portfolio. Whether you prefer the wide market approach of VFV or the dividend growth strategy of VGG, both ETFs provide avenues for participating in the U.S. stock market with the added benefits of ETF investing. Remember, investing always involves risks, and it’s important to align your choices with your personal investment objectives and risk tolerance.
Dividend kings are stocks with an unparalleled track record of increasing their dividends over time. The minimum requirement to be considered in this elite list is 50 years of dividend increases. In this post, we will present these stocks by sector. We will also provide, for each stock, the current dividend yield, payout ratio, and dividend growth rate of the past five years.
The list below is a good start for any dividend investor to pick from the best dividend stocks. As you can see below, the list is dominated by consumer defensive stocks and some industrial heavy weights. It’s no surprise. For a company to pay and increase dividends for over 50 years, it has to operate in sectors that can weather difficult times or be dominant in its industry.
Investing in dividend paying stocks is a strategy that appeals to young and old investors. Here is a quick reminder of the main concepts to keep in mind before applying this strategy:
Investment horizon: 5 years or more minimum. The strategy of investing in dividend paying stocks is not suitable for an investor with a short term horizon (less than 5 years).
Objective: The strategy can help you build passive income or further grow your capital by reinvesting the dividends received.
Risk Tolerance: Medium (provided you restrict yourself to selecting quality securities and having a diversified portfolio across several sectors).
Why invest in Dividend Kings
If you are asking yourself, what is the typical profile of a dividend king stock? I have listed some common characteristics below:
Dividend kings tend to dominate their industry
• The vast majority are companies that are well established in their sector. They manage to generate significant profits thanks to their comfortable position against the competition. They also sometimes operate in regulated markets such as electric utilities with almost no competition;
Safe heaven during turbulent times
• “Dividend kings” are sometimes considered by the financial market as safe havens in the event of a market correction or decline. Indeed, dividend aristocrats are generally less volatile than the market, and there are less targeted by speculators;
Strong financial statements
• “Dividend kings” will tend to have a better financial situation in terms of liquidity than the rest of the market. Their levels of liquidity or debt are generally better than the rest of the market;
Limited growth but there are exceptions
• In general, dividend aristocrats are mature businesses. That is, the growth potential is quite limited. However, some companies can pay dividends and invest in their growth. Usually, the dividend payout ratio is a good indicator. If the rate is low, it means the business is saving some money to grow. Business with high dividend pay out ratio have no financial resources left to grow.
Financial Services
Number of Consecutive Years of Dividend Increases DGR Streak
In the realm of Canadian Exchange-Traded Funds (ETFs), two notable options are VUN (Vanguard U.S. Total Market Index ETF) and VEQT (Vanguard All-Equity ETF Portfolio). Each fund caters to different investment strategies and goals, and understanding their nuances is key to determining which might be a better fit for individual investors (VUN vs VEQT).
Fund Overview and Composition
Starting with VUN, this fund aims to replicate the performance of the CRSP US Total Market Index. It provides a comprehensive exposure to the entire U.S. equity market, encompassing a wide range of stocks from small, mid, to large-cap growth and value companies. In contrast, VEQT focuses on long-term capital growth by primarily investing in equity securities. It stands out as an all-equity fund, holding a diversified portfolio of global stocks. This includes equities from Canada, the U.S., and various international markets.
The geographical exposure and diversification of these two ETFs vary significantly. VUN is exclusively focused on the U.S. market, offering investors a channel to gain exposure to the U.S. economy and its diverse sectors. On the other hand, VEQT provides a more global reach, with significant investments in North America, Europe, Asia, and emerging markets. This global diversification enables VEQT to spread its investments across different economies and market conditions.
When it comes to the risk and return profile, VUN’s performance and risk are closely tied to the U.S. stock market. Its focus on the U.S. market means potentially less diversified risk compared to VEQT. VEQT, with its global diversification, can potentially reduce country-specific risks. This broad diversification may lead to a more balanced risk-return profile over the long term.
Investment Strategy
From an investment strategy perspective, VUN is ideal for investors whose focus is on U.S. market growth. It is well-suited for portfolios that need U.S. equity exposure to complement other international holdings. Conversely, VEQT is designed for those seeking broad, diversified global equity exposure in a single ETF. It can serve as a standalone option for long-term growth in a diversified portfolio.
Dividend Yield Considerations
Dividend yields also differ between these two ETFs. VUN provides a dividend yield that mirrors the average of the U.S. market, catering to investors looking for U.S.-sourced income. VEQT, however, offers a composite dividend yield from its global holdings, with the yield varying depending on the dividend policies of different global markets.
Expense Ratios and FeesVUN vs VEQT
Regarding expense ratios and fees, VUN (MER= 0.17%) typically features a low expense ratio, characteristic of Vanguard ETFs, making it cost-efficient for those specifically seeking U.S. market exposure. VEQT (MER= 0.22%) might have a slightly higher expense ratio due to its global diversification, yet the fee remains competitive given its broad global exposure.
Conclusion: Choosing Between VUN and VEQT
In conclusion, the choice between VUN and VEQT largely hinges on an investor’s specific investment goals, risk tolerance, and desired market exposure. VUN stands out for those seeking concentrated U.S. market exposure, while VEQT appeals to investors looking for a globally diversified portfolio. Both ETFs offer distinct advantages, and the most suitable choice varies based on individual portfolio needs and long-term investment strategies.