For a Canadian investor with $200,000, targeting $1,000 per month in passive income (about 6% annual yield) represents a real turning point.

At this level, you move:

From pure accumulation
To a strategic income management approach

The goal is no longer just growth, but predictable cash flow.

Here are three concrete portfolio structures, adapted to different investor profiles:
from direct stock ownership to hybrid models using covered call ETFs.

Executive summary


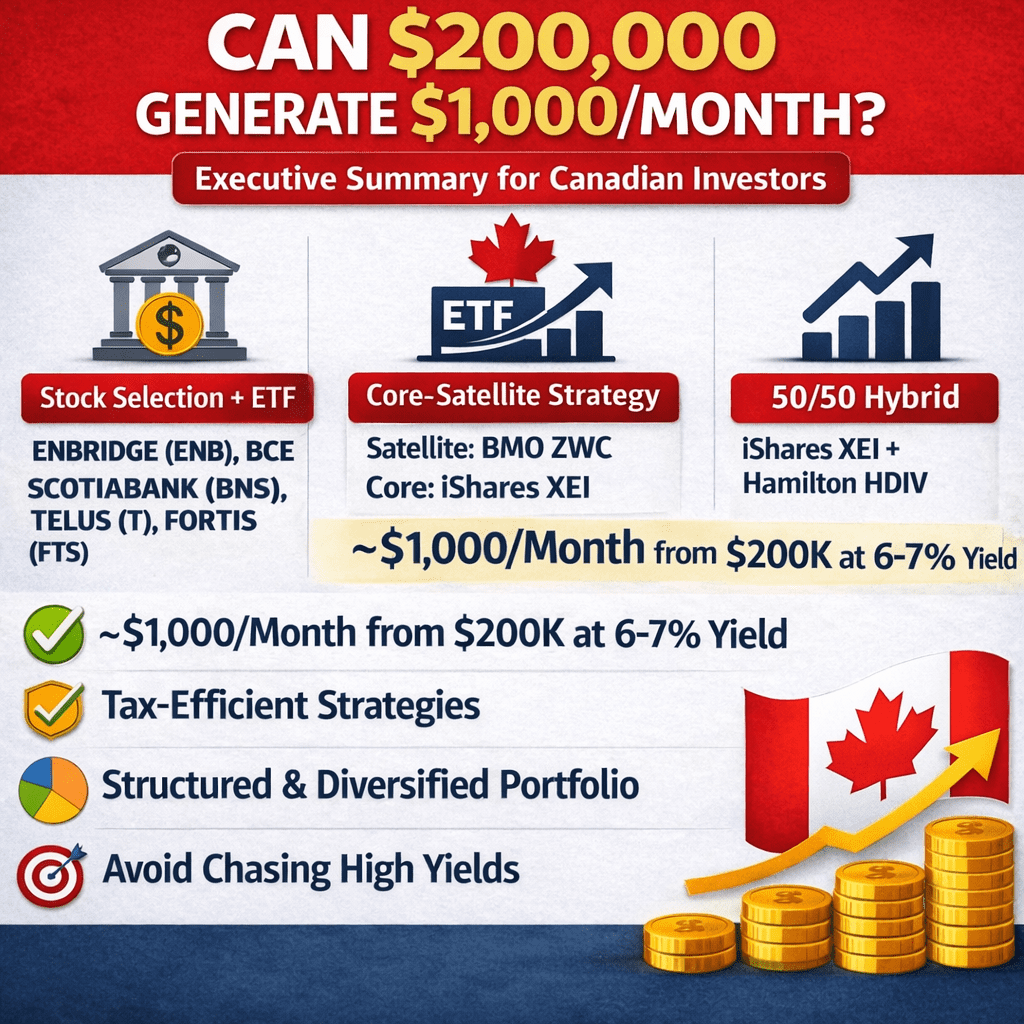
🔹 Model 1: Stock Selection

🎯 Who is it for?

This model is designed for investors who want to maintain some control over their portfolio while improving diversification through a dividend ETF. By combining a few strong Canadian stocks with a diversified ETF, it is possible to generate stable income while reducing the risk tied to any single company.

This approach suits investors who want to:

  • limit sector concentration
  • benefit from the Canadian dividend tax credit
  • simplify portfolio management

The sectors historically known for strong dividends remain:

  • Energy
  • Telecommunications
  • Banks
  • Utilities

Adding an ETF like XEI helps create a diversified base composed of several major Canadian companies.


Example Allocation

This allocation prioritizes dividend stability and improved diversification.

Stock / ETFAllocation%Est. YieldAnnual Income
iShares XEI$60,00030%4.20%$2,520
Enbridge (ENB)$30,00015%5.33%$1,599
Bank of Nova Scotia (BNS)$30,00015%4.53%$1,359
Telus (T)$30,00015%9.28%$2,784
Fortis (FTS)$30,00015%3.25%$975
BCE (BCE)$20,00010%4.85%$970
Total$200,000100%5.10%$10,207

💵 Estimated monthly income: ~ $850

This example highlights an important reality for income investors: with solid and diversified companies, portfolio yields often land around 5%. Reaching $1,000 per month purely from dividends would typically require about 6% yield, which often means higher concentration or more risk.


✅ Advantages

Combining individual stocks with an ETF allows investors to benefit from attractive dividends and better diversification.

  • Instant diversification through the ETF
  • Tax advantage from Canadian dividend credits
  • Exposure to several key sectors of the economy

Investors can also adjust positions over time as market conditions evolve.


⚠️ Risks

Even with an ETF, certain risks remain.

Sector concentration
The Canadian market remains heavily exposed to a few sectors such as energy, banks, and telecommunications.

Interest rate sensitivity
High-dividend stocks can react negatively when interest rates rise.

Company-specific risk
Some stocks may show high yields because their share price is under pressure.


Income Enhancement with Covered Calls

To get closer to the $1,000 per month goal, some investors use a covered call strategy on certain portfolio positions.

The principle is to sell call options on stocks already owned, collecting an option premium. A conservative approach typically involves selling options with a 30% delta and about one-month expiration.

Depending on the stock’s volatility, this strategy can generate 0.5% to 1% additional income per month. On a $200,000 portfolio, that can represent $1,000 to $2,000 per year, helping close the gap between $850 and the $1,000 monthly target.

However, this strategy also has limitations. If the stock rises above the strike price, the shares may be called away, limiting capital gains. If the stock falls, the option premium only partially offsets the loss.

Covered calls can increase income, but they require active and disciplined management.

This approach still offers reasonable growth potential while generating attractive monthly income, making it suitable for investors seeking both stability and yield.


🔹 Model 2: Core–Satellite (Stability + Yield Boost)

🎯 Who is it for?

The Core–Satellite model is a strategic approach combining stability with improved yield. It allows investors to maintain a solid diversified base while using part of the portfolio to increase monthly distributions.

This structure reduces risk compared to a fully high-yield strategy, while still helping investors approach the $1,000 per month goal with $200,000 invested.

This model is especially suited for:

  • investors seeking the stability of a diversified ETF
  • those wanting to increase their monthly income
  • those preferring a simple and structured portfolio

In practice, the portfolio is divided into two complementary components:

Core → diversified and relatively stable foundation
Satellite → strategies designed to enhance income

The core provides stability, while the satellite portion acts as a measured lever to increase total income.


Example Allocation

ComponentTypeAllocation%Est. YieldAnnual Income
iShares XEICore Foundation$120,00060%4.20%$5,040
BMO ZWCSatellite (Stability)$40,00020%5.84%$2,336
Hamilton HDIVSatellite (Diversified)$40,00020%10.55%$4,220
TOTAL$200,000100%5.80%$11,596

💵 Estimated monthly income: ~ $966


CORE – Portfolio Foundation

iShares S&P/TSX Composite High Dividend ETF (XEI) forms the base of the portfolio. This ETF provides exposure to several dozen Canadian dividend-paying companies.

It includes:

  • banks
  • energy companies
  • telecommunications
  • utilities
  • some industrial sectors

Advantages of the CORE:

  • broad sector diversification
  • exposure to strong Canadian companies
  • regular distributions
  • simple structure without leverage

XEI acts as the stable foundation of the portfolio, combining income with long-term growth potential.


SATELLITE – Yield Enhancement

The satellite portion aims to increase portfolio distributions using income-focused strategies.

BMO ZWC primarily invests in major Canadian banks while using covered calls to generate additional option premiums.

Hamilton HDIV adds further diversification by combining multiple sectors and income strategies, helping boost overall portfolio yield.

Advantages of the satellite portion:

  • higher monthly distributions
  • improved overall yield
  • additional diversification

Total Income

Core: ~ $5,040
Satellite ZWC: ~ $2,336
Satellite HDIV: ~ $4,220

Total: ~ $11,596 per year

💵 Monthly income: ~ $966


Why This Model Works

This portfolio relies on a balance between stability and enhanced yield.

Most capital is invested in XEI, providing diversification across many strong Canadian companies.

The satellite portion, using strategies such as covered calls, increases monthly distributions without relying solely on individual stocks.

This structure provides a balanced approach between:

  • diversification
  • income
  • risk management
  • simplicity

while helping investors approach the goal of $1,000 in monthly income with $200,000 invested.


🔹 Model 3: The 50/50 Hybrid (Growth + Volatility Monetization)

🎯 Who is it for?

Investors who want:

  • stable income
  • protection in sideways markets
  • a more robust strategy

Here, capital is divided between a base of dividend exposure and a higher-yield income strategy.


50% – XEI ($100,000)

iShares S&P/TSX Composite High Dividend (XEI)

Yield: ~4.20%
Annual income: $4,200

Exposure:

  • about 70 Canadian companies
  • broad sector diversification
  • banks, energy, telecom, utilities

XEI acts as the portfolio foundation, providing stable income and growth potential.


50% – HDIV ($100,000)

Hamilton Enhanced Multi-Sector Covered Call ETF (HDIV)

Yield: ~10.50%
Annual income: $10,500

Strategy:

  • multi-sector portfolio
  • covered calls to generate option premiums
  • exposure to banks, energy, and utilities

HDIV aims to monetize market volatility to increase monthly distributions.


Total Income

$4,200
$10,500

Total: $14,700

💵 Monthly income: ~ $1,225

Overall yield: ~7.35%


Why This Model Is Robust

  • XEI captures growth and stabilizes the portfolio
  • HDIV generates option premiums and boosts distributions
  • the combination increases yield without relying only on traditional dividends

This model works particularly well if:

  • markets stagnate
  • volatility remains elevated
  • interest rates remain relatively stable

In that environment, covered call strategies can continue generating additional income, allowing investors to achieve higher passive income while maintaining a diversified base.


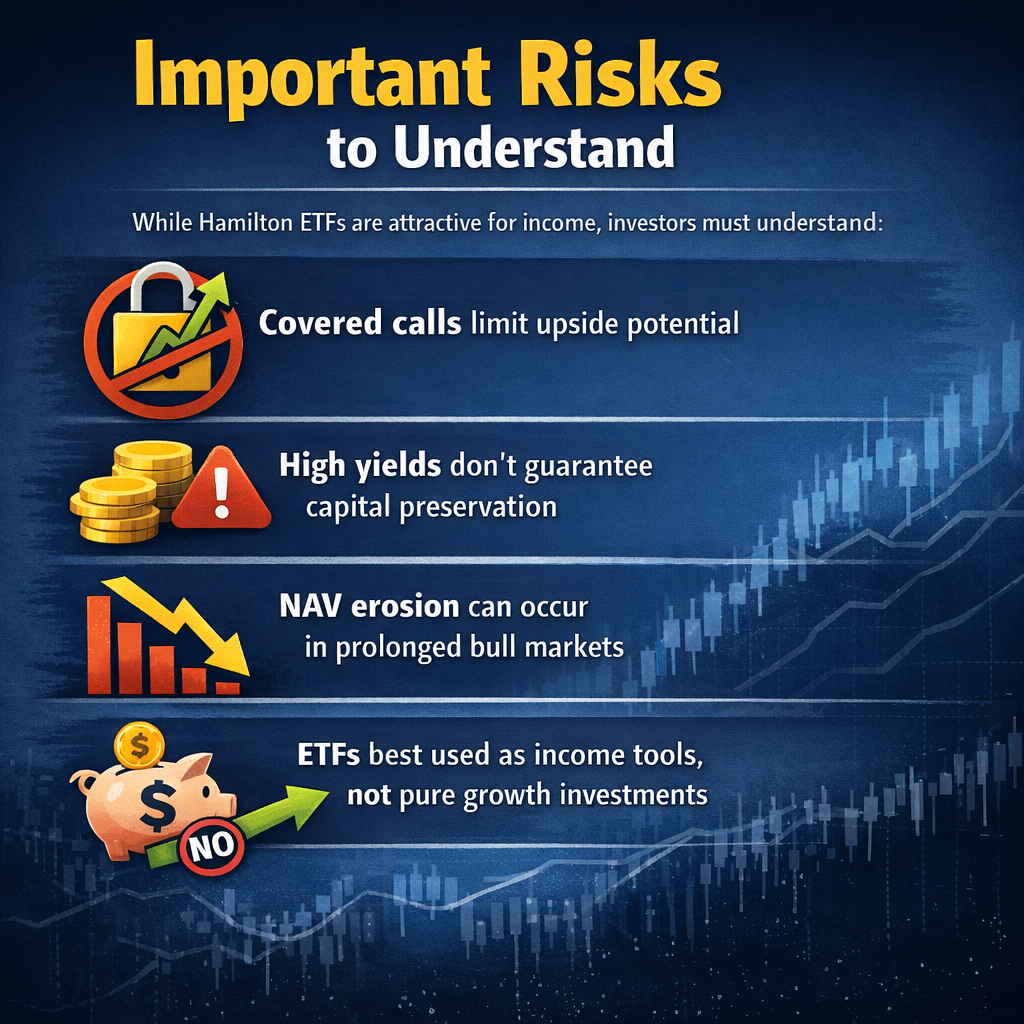
⚠️ Risks and Limitations of Covered Call ETFs

Covered call ETFs can offer higher yields, but they also have limitations.

Limited upside potential
If markets rise strongly, shares may be called away due to the options sold, limiting participation in large market gains.

Income depends on volatility
Option premiums increase with volatility. In calmer markets, distributions may decline.

For this reason, covered call ETFs are often used as an income complement within a diversified strategy, rather than as the sole foundation of a portfolio.


📊 Strategy Comparison

StrategyAnnual IncomeMonthly IncomeComplexityGrowth PotentialDiversification
Stock Selection + ETF~ $10,207~ $850HighGoodModerate
Core–Satellite~ $11,596~ $966LowGoodHigh
Hybrid 50/50~ $14,700~ $1,225MediumModerateVery good

Important Tax Note

The tax structure of the account used directly impacts the net return of your income strategy.

In a taxable account:
Canadian dividends benefit from the dividend tax credit, reducing taxes compared to interest income. Covered call premiums are often treated as capital gains when used non-speculatively, which can be tax-efficient. Only 50% of capital gains are taxable, improving after-tax returns.
👉 Models 1 (individual stocks) and 3 (hybrid approach with options) can therefore be more tax-efficient in a taxable account.

In a TFSA:
All income — dividends, capital gains, and option premiums — is 100% tax-free.

In an RRSP:
Taxes are deferred until withdrawal at retirement, which may be advantageous if your current tax rate is high.


⚠️ Common Pitfalls

Trying to generate $1,000 per month with $200,000 is realistic, but several pitfalls can undermine the strategy.

1. Chasing very high yields (>9%)
Very high yields often signal higher risk or potential dividend cuts.

2. Ignoring capital erosion
Stable income is not enough if portfolio value declines over time.

3. Underestimating sector cyclicality
Banks and energy can provide strong dividends but remain sensitive to economic cycles.

4. Not rebalancing annually
Without rebalancing, a portfolio may become overly concentrated.


🚀 Growth Strategy: From $200,000 to $500,000

If you reinvest:

Average return: 6%
Annual contributions: $10,000

Approximate projection:

~ $350,000 in 10 years
~ $500,000 in 15–18 years

At $500,000:

6% = $30,000 per year
$2,500 per month

That’s when passive income becomes truly transformative.


🎯 Conclusion: $1,000 per Month Is Realistic… but Strategic

Generating $1,000 per month with $200,000 is not unrealistic. It’s not marketing hype — it’s an achievable goal for a disciplined investor.

But the result does not rely solely on yield. It depends on portfolio architecture.

What makes the difference:

Structure: choosing the right vehicles (stocks, ETFs, covered calls)
Tax efficiency: optimizing account types
Diversification: avoiding reliance on one sector
Discipline: rebalancing and resisting market hype

The real challenge is not achieving 6% for one exceptional year, but building a durable, predictable, and resilient income stream.

A well-constructed $200,000 portfolio can become much more than an investment — it can become a financial freedom engine, funding projects, reducing career pressure, or accelerating financial independence.

Since January 1, 2026, the global stock market has been experiencing a significant sector rotation. After several years of undisputed dominance by technology — driven by mega-caps such as Apple, Nvidia, Microsoft, and Alphabet — investors have gradually shifted their capital toward more tangible, cyclical, or defensive sectors.

This shift is not accidental. It reflects a macroeconomic environment that is fundamentally different from 2021–2024: structurally high inflation, cautious central banks, rising geopolitical uncertainty, and record public debt levels across several G7 economies.

In this context, three major sector themes have clearly stood out since the beginning of the year:

  • Gold and gold mining
  • Silver
  • Energy (oil and gas)

Let’s take a deeper look at why these sectors are leading and which Canadian ETFs have stood out year-to-date.

Executive summary


Gold and Mining: The Big Winners of 2026

Why Is Gold Outperforming in 2026?

Gold traditionally serves three key roles in a portfolio: a safe haven during uncertainty, a hedge against inflation, and a hedge against currency devaluation. In 2026, all three catalysts are present simultaneously — a rare combination that explains the magnitude of the rally.

Key drivers pushing gold to new all-time highs:

  • More persistent inflation than expected: Despite central bank efforts, inflation remains above target in several developed economies, particularly due to energy and commodity pressures.
  • Cautious central banks on rate cuts: The Fed and ECB have signaled a slower-than-expected pace of rate reductions, supporting gold’s appeal.
  • Rising geopolitical tensions: Ongoing conflicts, global supply chain fragmentation, and gradual de-dollarization in some emerging economies are fueling institutional demand.
  • Record central bank purchases: China, India, Turkey, and others continue accumulating gold reserves.
  • Record public debt: Soaring deficits in the U.S. and eurozone raise long-term fiat currency concerns.

As a result, gold reached new highs in 2026, boosting mining company profits, as margins expand when gold prices rise while operating costs remain relatively stable in the short term.

Top Gold ETFs YTD

BetaPro Gold Miners 2x Daily Bull ETF (GDXU)

GDXU seeks to deliver 2x the daily performance of a gold miners index before fees. It uses derivatives to amplify daily price movements of gold mining equities. When gold stocks are in a strong, sustained uptrend, this leverage can significantly enhance short-term gains.

However, the leverage resets daily. Over multiple days, performance can diverge from exactly 2x due to compounding effects (beta slippage), particularly in volatile or sideways markets. Drawdowns can also be amplified just as quickly as gains. GDXU is therefore designed for short-term tactical trading and active portfolio management, not long-term buy-and-hold investing.

BMO Junior Gold Index ETF (ZJG)

ZJG provides exposure to junior gold mining companies, typically smaller-cap exploration and early-stage production firms. These companies often have higher growth potential but also greater operational and financing risk.

Juniors tend to exhibit strong operational leverage to gold prices. Because many operate with higher fixed costs and thinner margins, rising gold prices can lead to disproportionately large increases in profitability and share prices. This makes ZJG more volatile than large-cap mining ETFs, but potentially more rewarding during strong gold bull markets.

iShares S&P/TSX Global Gold Index ETF (XGD)

XGD tracks a diversified index of large, established gold producers, including companies such as Barrick Gold, Agnico Eagle, and Newmont. These firms typically have diversified assets, stronger balance sheets, and more stable production profiles.

Compared to junior-focused funds, XGD offers lower volatility while still capturing the upside of rising gold prices. It is often used as a core gold equity holding within a portfolio, providing balanced exposure to the gold mining sector with reduced single-company risk.

Physical Gold vs Mining Stocks

Physical GoldGold Mining Stocks
VolatilityLowerHigher
Operational RiskNoneOperational, management, and geological risks
Leverage to Gold Price1:1Amplified (2x to 5x depending on the company)
DividendsNoYes (large producers)
Pure ProtectionExcellentPartial (correlated with equity markets)

Physical gold typically exhibits lower volatility compared to gold mining equities because it reflects only the price movement of the metal itself. It carries no operational, management, geopolitical, or cost-inflation risks. There are no earnings reports, production disruptions, or balance sheet concerns. As a result, physical gold often acts as a portfolio stabilizer and a pure hedge against inflation, currency debasement, and systemic risk.

Gold mining stocks, on the other hand, provide leveraged exposure to the price of gold. When gold prices rise, mining company margins can expand disproportionately, leading to amplified equity returns. Many large producers also pay dividends, adding an income component that physical gold does not offer. However, mining equities carry operational risks (cost overruns, labor issues, reserve depletion), geopolitical exposure (mining jurisdictions), and are partially correlated with broader equity markets during risk-off events.

ETFs such as BMO Gold Bullion ETF (ZGLD) and iShares Gold Bullion ETF (CGL) provide direct exposure to physical gold held in vaults. These funds are designed to closely track the spot price of gold, minus fees, offering investors a convenient and liquid way to gain bullion exposure without storage or insurance concerns.


Silver: The Hybrid Metal

Silver is both a precious metal and an essential industrial metal (solar panels, electronics, EVs, medical applications). This dual nature allows silver to outperform gold when economic activity remains solid while uncertainty persists.

Industrial demand drivers:

  • Solar panels (approx. 20 grams per panel)
  • Electric vehicles (2–3x more silver than combustion vehicles)
  • Electronics and semiconductors

Silver ETFs

BetaPro Silver 2x Daily Bull ETF (SLVU)


SLVU seeks to deliver twice the daily performance of silver futures before fees. It achieves this exposure through derivatives, primarily futures contracts, rather than holding physical silver. Because the leverage resets every day, performance over multiple days can differ materially from 2x the cumulative return of silver due to compounding effects, especially in volatile or sideways markets.

This structure makes SLVU extremely sensitive to short-term price movements. During strong, sustained uptrends, gains can be amplified significantly. However, sharp pullbacks or choppy price action can quickly erode returns. It is designed for active traders implementing short-term tactical strategies, not for buy-and-hold investors.

iShares Silver Bullion ETF (SVR)


SVR provides direct exposure to physical silver bullion stored in secure Canadian vaults. The fund is structured to closely track the spot price of silver, minus management fees and expenses.

Unlike leveraged ETFs or silver mining stocks, SVR does not introduce derivative leverage or operational mining risk. It offers a straightforward way to gain exposure to silver prices within a traditional brokerage account. This makes it suitable for long-term portfolio diversification, inflation hedging, or strategic precious metals allocation.

Canadian Silver Reserves ETR (MNS)
MNS is backed by allocated physical silver. It provides transparent, direct exposure to bullion prices without operational risk.

Silver vs Gold

Silver frequently amplifies gold’s performance during precious metals bull cycles. Several structural factors explain this dynamic:

  • The silver market is smaller and less liquid, making price movements more sensitive to capital inflows.
  • Speculative participation tends to be stronger in silver due to its higher volatility.
  • Industrial demand adds an additional layer of structural support.
  • Historically elevated gold/silver ratios often create catch-up potential for silver.

When both safe-haven demand and economic activity remain strong, silver can outperform gold significantly over a cycle.


Energy: Back in Force in 2026

After several years marked by ESG-related capital constraints, regulatory pressure, and volatile oil prices, the energy sector staged a powerful rebound in 2026. Underinvestment in new production capacity during the 2015–2022 period created structural supply tightness just as global demand stabilized, setting the stage for higher and more sustained commodity prices.

Several key catalysts explain the sector’s strength:

  • Constrained global supply: OPEC+ has maintained strict production discipline, actively managing quotas to support crude prices. Years of reduced capital expenditures globally have limited spare capacity, making supply less responsive to demand shocks.
  • Resilient global demand: Despite recession concerns, global oil consumption remains solid, supported by emerging markets, aviation recovery, petrochemical demand, and ongoing economic activity in Asia.
  • Stronger balance sheets and shareholder returns: Canadian energy producers have shifted toward capital discipline. Rather than pursuing aggressive growth, companies are prioritizing free cash flow, debt reduction, dividends, and share buybacks—enhancing total shareholder returns.
  • Geopolitical instability: Ongoing tensions in the Middle East, disruptions in key shipping routes, and broader geopolitical fragmentation have embedded a structural risk premium in oil prices.

Together, these factors have improved the quality of the sector compared to previous cycles, making energy equities more cash-flow driven and less expansion-dependent than in the past.

Leading Energy ETFs

iShares S&P/TSX Capped Energy Index ETF (XEG)


XEG is the benchmark Canadian energy ETF. It tracks the S&P/TSX Capped Energy Index and provides concentrated exposure to large-cap oil and gas producers such as Canadian Natural Resources, Suncor, and Cenovus.

Although the index is capped, the top holdings typically represent a significant portion of the portfolio, meaning performance is heavily driven by a handful of major producers. XEG is highly sensitive to movements in crude oil prices, particularly Western Canadian Select (WCS), and tends to amplify sector momentum during strong commodity cycles.

BMO Equal Weight Oil & Gas Index ETF (ZEO)


ZEO uses an equal-weight methodology, giving each constituent a similar allocation regardless of market capitalization. This structure reduces dependence on mega-cap producers and increases exposure to mid-sized companies.

Global X Equal Weight Canadian Oil & Gas Index ETF (NRGY)


NRGY follows a similar equal-weight approach focused exclusively on Canadian energy producers. It provides competitive fees and diversified exposure across upstream oil and gas companies.

Like ZEO, it reduces concentration risk compared to cap-weighted funds and allows smaller producers to contribute more meaningfully to returns.

While energy remains a cyclical sector, its structure has improved materially. Canadian producers now emphasize capital discipline, free cash flow generation, dividends, and share buybacks rather than aggressive expansion. This shift provides stronger balance sheets and offers partial downside support during commodity pullbacks.


Conclusion: The Real Lesson of 2026

Sector leadership changes over time. In 2026, tangible assets — precious metals and energy — are outperforming as investors respond to inflation, geopolitical risk, and public debt concerns.

YTD 2026 ranking:

  • Gold & Gold Mining
  • Silver
  • Energy (Canadian Oil & Gas)

Sector rotation is real and may continue if macro conditions persist.


Disclaimer: This article is for informational purposes only and does not constitute investment advice. Past performance does not guarantee future results. Consult a licensed financial advisor before making investment decisions.

Investing in private giants like SpaceX or OpenAI has traditionally been reserved for institutional or “accredited” investors. However, an accessible solution for retail investors involves using U.S.-listed vehicles (ETFs or closed-end funds) that hold these shares in their portfolios before their Initial Public Offering (IPO).

Why Choose Specialized Funds?

Waiting for an IPO might seem logical, but in reality, a large portion of a tech company’s growth occurs pre-IPO. By the time companies like SpaceX or OpenAI go public, their valuations often already reflect massive expectations. Specialized funds allow you to access this growth phase early, offering better long-term potential.

  • Secondary Market Access: These funds buy shares directly from employees, early investors, or historical holders looking to sell before the IPO. This opens a door that was once bolted shut for retail investors.
  • Strategic Diversification: Rather than betting on a single company, you invest in a portfolio of several technological “unicorns,” reducing specific risk.
  • Liquidity: Unlike traditional Private Equity, where capital can be locked up for years, these funds trade on major stock exchanges and can be bought or sold easily through a brokerage platform.

The 2026 “Mega-IPO” Wave: What’s at Stake?

The year 2026 is being hailed as the most significant year for technology listings in over a decade. For the first time, a cluster of “generational” companies—firms that have defined the AI and space-tech eras—are moving toward public markets simultaneously. For pre-IPO investors, the primary goal today is to secure positions in these giants before they hit public exchanges at potentially record-breaking valuations.

Wait-and-see strategies often miss the most explosive growth phases, as these 2026 targets represent critical infrastructure that the market is eager to own.

SpaceX: The Trillion-Dollar Frontier ($1.5 Trillion Target)

SpaceX is widely reported to be targeting a mid-2026 IPO, with rumors narrowing the window to June or July.

  • Strategic Evolution: Following its February 2026 all-stock acquisition of xAI, SpaceX has transformed into a combined Space-and-AI infrastructure powerhouse. This merger allows SpaceX to integrate advanced AI into its satellite navigation and autonomous manufacturing.
  • Revenue Engines: The Starlink satellite division remains its primary driver of high-margin recurring revenue, boasting over 10 million subscribers. Simultaneously, the deployment of Starship V3 is expected to cement a global monopoly on heavy-lift orbital launches.

OpenAI: The Infrastructure Race ($850B – $1T Target)

Reports from early 2026 indicate OpenAI is preparing for a Q4 2026 listing.

  • Massive Capital Needs: The company is reportedly closing a historic $100 billion funding round at an $830 billion valuation, backed by SoftBank, Amazon, and Microsoft.
  • Growth Outlook: This capital is essential to fuel OpenAI’s ambitious AI hardware and infrastructure plans, which include building its own specialized chip foundries and data centers. An IPO is the logical next step to provide the massive liquidity required for these decade-long projects.

Anthropic: The “Profitable” Challenger ($350B – $380B Target)

Often viewed as the “safety-focused” alternative to OpenAI, Anthropic has accelerated its own IPO preparations for late 2026.

  • Technical Lead: In February 2026, Anthropic’s latest models took a significant lead in coding and technical rankings, making it a critical “hedging” position for AI-focused portfolios.
  • Financial Path: Unlike some of its peers, Anthropic has shared projections showing it could reach breakeven by 2028, a major selling point for public market investors. It recently secured $30 billion in Series G funding, pushing its valuation to $380 billion.

Why the IPO Date Matters for Fund Investors

If you wait for these companies to list on the NYSE or NASDAQ, you are buying at the “retail price.” By using specialized funds like DXYZXOVR, or RONB now, you are effectively buying at the “wholesale price” established in private secondary markets. The goal is to benefit from the price “pop” and the massive institutional demand that often occurs when a highly-anticipated stock finally becomes accessible to the general public.

The Best Investment Options for 2026

Destiny Tech 100 (DXYZ)

The Destiny Tech 100 (DXYZ) represents a revolution for retail investors seeking Private Equity exposure. Listed as a Closed-End Fund (CEF) on the NYSE, DXYZ democratizes access: a single share allows you to indirectly become a shareholder in the world’s most coveted private companies.

Its portfolio structure is its main asset. With approximately 25% of its assets allocated to SpaceX, the fund links its destiny to Elon Musk’s space dominance. This concentration is balanced by AI pillars like OpenAI and Anthropic, as well as digital entertainment leaders like Epic Games.

However, this accessibility comes with a technical quirk: the Premium to Net Asset Value (NAV). Unlike a standard ETF, DXYZ’s price can deviate significantly from the actual value of the underlying shares, reflecting market hype. It is a bet on scarcity, offering daily liquidity where venture capital funds impose multi-year lockups. For those anticipating the 2026 IPOs, this is the most direct positioning tool available via brokers like Interactive Brokers.

Entrepreneur Private-Public Crossover ETF (XOVR)

Launched by EntrepreneurShares, XOVR marks a historic milestone as the first ETF authorized to directly hold private company securities within its structure.

Key features of this hybrid fund:

  • Crossover Pioneer: Unlike traditional ETFs limited to public markets, XOVR uses a regulatory exemption to allocate a significant portion to unlisted companies. SpaceX is its flagship position, representing about 10% of total assets.
  • “Entrepreneurial” Selection: Supervised by Dr. Joel Shulman, the fund prioritizes founder-led companies (like Musk for SpaceX), believing these leaders maximize long-term value.
  • Venture Capital Access: It offers daily liquidity on assets normally locked away.
  • Fees and Structure: With an expense ratio of 0.70%, it is significantly cheaper than most venture capital structures or closed-end funds like ARKVX.

Baron First Principles ETF (RONB)

Launched in December 2025 by Baron Capital, RONB is an active fund that boasts one of the highest exposures to SpaceX among publicly traded products.

The essentials of this fund:

  • Massive Bet on SpaceX: The fund allocates a significant portion of its portfolio to Musk’s aerospace company, with weightings generally fluctuating between 14% and 22%.
  • The Musk Ecosystem: Beyond SpaceX, the fund holds positions in Tesla (~13.8%) and the AI startup xAI (~5.4%), bringing its total exposure to Elon Musk-linked companies to nearly 40%.
  • “First Principles” Strategy: Managed by the legendary Ron Baron and his sons, the fund applies a philosophy of breaking down problems into fundamental truths to identify high-growth companies with durable competitive advantages.
  • Regulatory Innovation: To include so many private assets, Baron Capital classifies these securities as “less liquid” rather than “illiquid,” bypassing the standard 15% SEC cap for illiquid assets.

The Verdict: Which fund should you choose?

CriteriaDXYZXOVRRONB
Product TypeClosed-End Fund (CEF)Hybrid ETFActive ETF
SpaceX ExposureHigh (~23%)Medium (~10%)Very High (14-22%)
Fees (MER)High (~2.50%+)Low (0.70%)Moderate (1.00%)
LiquidityDaily (NYSE)DailyDaily
Main RiskHigh Premium to NAVSector VolatilityConcentration (40% Musk)
Ideal For…Pure access to unicornsLow fees and securityBetting on Elon Musk

This comparison table summarizes the key features of the three vehicles analyzed. While they all offer access to private tech giants, their structures and costs vary considerably.

If your priority is minimizing fees, XOVR is the most rational choice. If you are looking for a concentrated bet on Elon Musk’s vision, RONB is unbeatable. Finally, for maximum diversification among unicorns, DXYZ remains the gold standard, provided you monitor the premium to NAV.

Wyze Note: These funds are all tradable on U.S. exchanges (NYSE/NASDAQ). If you use a platform like Interactive Brokers, you can add them to your watchlist today using their respective tickers.


Risks and Precautions

Investing in private companies via listed funds is a unique opportunity, but it carries specific risks:

  • Premium to NAV: The main risk for funds like DXYZ. The market price can be much higher than the actual value of the assets. If you buy at a 50% premium, you are overpaying, exposing yourself to a brutal correction if hype fades.
  • Opaque Valuation: Unlike Apple or Nvidia, the value of SpaceX or OpenAI is estimated during funding rounds or on restricted secondary markets. There is a lag between the displayed fund value and market reality.
  • High Management Fees: Managing private assets requires complex expertise. Expense ratios are significantly higher than a classic S&P 500 index ETF.
  • IPO Failure: Success depends on a future exit (IPO). If a star company fails to go public or its valuation collapses during the listing, the fund will suffer a major loss.

FAQ: Everything about investing in SpaceX and OpenAI

Is SpaceX publicly traded in 2026?

No, SpaceX remains a private company. While rumors suggest an IPO for mid-2026, no official date is set. Currently, retail investors use funds like DXYZ or XOVR for indirect exposure.

How can a retail investor buy OpenAI shares?

You cannot buy OpenAI shares directly on platforms like Wealthsimple or Questrade yet. The simplest way for a retail investor is to buy Microsoft (MSFT) shares, which holds a major stake, or use specialized “Pre-IPO” funds like DXYZ.

Which ETF holds the most SpaceX stock?

In 2026, three vehicles stand out:

  1. XOVR: Holds about 21% of its assets in SpaceX via a Special Purpose Vehicle (SPV).
  2. RONB: Allocates between 14% and 22% to Musk’s company.
  3. DXYZ: Holds approximately 23% of the portfolio in SpaceX.

When will the OpenAI IPO happen?

According to 2026 reports, OpenAI is considering an IPO toward the fourth quarter of 2026 to fund massive AI infrastructure costs.


If you follow institutional flows in the Canadian ETF market, you know that a million-dollar inflow barely registers. A hundred-million-dollar inflow might earn a headline. But a $1.73 billion surge in a single month represents something far more structural — a repositioning of capital at scale.

Source: Fund Inflows Statistics – Tradingview as of February 12th, 2026

That is exactly what happened recently with the iShares 0–5 Year TIPS Bond Index ETF (CAD-Hedged), trading under ticker XSTH. The magnitude of this inflow is not random. It reflects institutional conviction about inflation risk, interest-rate direction, and portfolio defensiveness heading into 2026.

For income investors, this move is not just informative — it is actionable. Understanding why capital is flowing into short-duration inflation-protected bonds can help you better position your own portfolio for the evolving macro environment.


Part 1 — What Is XSTH? The “Safety-First” Inflation Hedge

XSTH provides exposure to U.S. Treasury Inflation-Protected Securities, commonly known as TIPS. Unlike traditional bonds that pay a fixed coupon on a static principal, TIPS adjust their principal value based on inflation, as measured by the Consumer Price Index (CPI).

When inflation rises, the principal value of the underlying bonds increases. Because coupon payments are calculated as a percentage of that principal, the income generated by the bond rises as well. At maturity, investors receive the fully inflation-adjusted principal, preserving real purchasing power.

What makes XSTH particularly defensive is its focus on short-term maturities — bonds with durations between zero and five years. This dramatically reduces interest-rate sensitivity. Long-term bonds can experience significant price declines when yields rise, but short-term TIPS are far more stable because they mature quickly and can be reinvested at new rates.

The ETF is also currency-hedged back to Canadian dollars. Since the underlying securities are denominated in U.S. dollars, hedging eliminates exchange-rate volatility for Canadian investors. This ensures returns reflect inflation protection and bond performance — not CAD/USD swings.


Part 2 — Decoding the $1.7 Billion Institutional Surge

Large inflows into niche fixed-income ETFs rarely occur without a macro catalyst. Pension funds, insurers, and sovereign allocators do not deploy billions tactically — they reposition strategically.

The $1.73 billion surge into XSTH signals that institutional investors are increasingly concerned about persistent — not transitory — inflation.

Several macro forces are converging in early 2026.

Global trade tensions and tariff risks are resurfacing, particularly across industrial supply chains and energy markets. Commodity volatility remains elevated, with oil and natural gas prices reacting to geopolitical instability. At the same time, fiscal spending across developed economies continues to run above historical norms, supporting demand-side inflation pressures.

In this environment, institutional capital is seeking protection — not just yield. TIPS provide what nominal bonds cannot: contractual inflation adjustment backed by the U.S. Treasury.

There is also a liquidity dimension. When billions enter a fixed-income ETF, secondary-market liquidity deepens. Bid-ask spreads tighten, and execution efficiency improves. For retail investors, that institutional participation effectively creates a liquidity floor, making the ETF easier to trade even during volatile markets.


Part 3 — The Income Investor’s Perspective: Yield and Cash Flow Stability

From an income standpoint, XSTH plays a different role than high-yield dividend ETFs or covered-call strategies.

Its yield is composed of two components: the real yield embedded in TIPS and the inflation adjustment to principal. As inflation rises, distributions can increase because the underlying bond principal rises. This creates a dynamic income stream that adjusts to macro conditions rather than remaining fixed.

Distributions are paid monthly, making the ETF operationally compatible with income portfolios structured around regular cash flow.

However, the purpose of XSTH is not yield maximization — it is yield stabilization. High-yield equities may offer 6% to 10% distributions, but those payouts are tied to market risk. If equities correct, capital losses can overwhelm income.

XSTH, by contrast, provides lower but more resilient income, backed by government securities and inflation indexing. It acts as a ballast rather than a growth engine.


Part 4 — Why 2026 Is the Year of the “TIPS Hedge”

As of early 2026, monetary policy sits at an inflection point. Central banks, including the Bank of Canada and the Federal Reserve, have paused aggressive tightening, but inflation has not fully normalized to target levels.

Markets are now navigating three simultaneous risks.

The first is tariff-driven inflation. Trade restrictions increase import costs, feeding directly into CPI. TIPS automatically adjust to this environment, whereas nominal bonds lose purchasing power.

The second is equity volatility. Dividend stocks, REITs, and utilities — staples of income portfolios — remain sensitive to interest-rate expectations and recession fears. During risk-off events, capital often rotates into government securities, benefiting TIPS.

The third is the yield-chasing trap. Many investors pursue double-digit yields through covered-call ETFs or leveraged income funds. While attractive on paper, these strategies can suffer capital erosion during drawdowns. Inflation-protected bonds provide a defensive counterweight, preserving portfolio stability.


Portfolio Integration: How XSTH Fits in an Income Strategy

If your portfolio were a house, your dividend stocks and high-yield funds would be the engine that generates power. XSTH is the foundation. It doesn’t move much, but it keeps the whole house from sinking.

Here are four simple ways to use XSTH to protect and grow your wealth:

1. Better Than a Standard Savings Account: Most people keep “safe money” in a savings account. However, if inflation is 4% and your bank pays you 3%, you are actually losing money every year in terms of what you can buy.

  • The XSTH Edge: Because it’s a TIPS fund (Treasury Inflation-Protected Securities), it is designed to grow its value specifically when the cost of living goes up. It’s “inflation-proof” cash.

2. The “Zing” Protector for Income Investors

Many popular “income” ETFs (like those that pay 8% or 10% dividends) can be very volatile. Their prices often drop when the stock market gets nervous.

  • The XSTH Edge: XSTH rarely moves in the same direction as the stock market. Adding a “slice” of XSTH to your portfolio acts like a shock absorber in a car—it smooths out the bumps so you don’t panic-sell when the market gets rocky.

3. Protecting Your “Buying Power”

Inflation is the “hidden tax” that makes groceries, gas, and rent more expensive. If you are retired or living off your investments, a sudden spike in prices is your biggest enemy.

  • The XSTH Edge: XSTH is one of the few investments that has a “contractual” link to inflation. When the government’s inflation numbers go up, the value of the bonds inside XSTH is adjusted upward. It’s like a built-in raise for your savings.

4. Your “Dry Powder” for Sales

When the stock market crashes, the best thing to have is “dry powder”—cash that hasn’t lost its value—so you can buy great stocks at a discount.

  • The XSTH Edge: Because XSTH is made of short-term government bonds, it is very liquid and stable. While other people are watching their portfolios drop 20%, your XSTH slice should remain steady, giving you the funds (and the confidence) to buy the dip.

Costs, Efficiency, and Structural Advantages

One of the most compelling aspects of XSTH is cost efficiency. With a management expense ratio near 0.10%, it represents one of the lowest-cost inflation-protected vehicles available to Canadian investors.

The ETF structure also provides daily liquidity, transparent pricing, and automatic reinvestment of inflation adjustments — advantages not easily replicated through direct bond purchases.

For retail investors, accessing a laddered portfolio of short-term U.S. TIPS with currency hedging would be operationally complex. XSTH packages that exposure into a single, tradeable instrument.


Risks and Considerations

Despite its defensive profile, XSTH is not risk-free.

If inflation declines faster than expected, TIPS breakeven rates compress, reducing relative performance. In disinflationary environments, nominal bonds may outperform inflation-protected securities.

Currency hedging, while stabilizing returns, introduces hedging costs that can marginally reduce yield. Additionally, because duration is short, capital appreciation potential is limited compared to long-duration bonds during rate cuts.

Investors should therefore view XSTH as protection — not performance leverage.


The Bottom Line

The $1.7 billion inflow into XSTH is not noise. It is a signal that institutional investors are repricing inflation risk and reinforcing portfolio defenses.

In an era where protecting purchasing power is as critical as generating income, short-term TIPS provide a rare combination of government credit quality, inflation adjustment, and low duration risk.

For Canadian income investors, XSTH offers monthly distributions, currency-hedged exposure, and structural resilience against macro shocks — all at a minimal cost.

Following “smart money” does not mean copying trades blindly. It means understanding the macro thesis behind capital flows.

Right now, that thesis is clear: inflation may be moderating, but the world’s largest investors are still buying insurance.

And XSTH is one of the most direct ways to own it.

When markets turn volatile, most investors instinctively ask the same question: “Where can I invest without constantly worrying about my portfolio?”

The answer is rarely found in speculative growth stocks or high-yield names with fragile balance sheets. Instead, it lies with defensive dividend aristocrats — companies that have proven, over decades, their ability to generate cash, protect dividends, and survive multiple economic cycles. In this article, we focus on Canadian Dividend Aristocrats that combine:

  • essential businesses,
  • resilient cash flows,
  • and a long track record of dividend increases.

These are not stocks designed to “beat the market” every year. They are stocks designed to protect income, reduce volatility, and compound steadily — exactly what many investors want in uncertain environments.


What Makes a Dividend Stock “Defensive”?

A defensive dividend stock typically shares several characteristics:

  1. Essential services
    Utilities, food, infrastructure, insurance — businesses people rely on regardless of economic conditions.
  2. Predictable cash flows
    Revenues are often regulated, contracted, or recurring.
  3. Strong balance sheets
    Conservative leverage and access to capital.
  4. Dividend discipline
    Long histories of dividend payments and increases, even during recessions.

Dividend Aristocrats take this one step further: they have consistently raised their dividends for many years, demonstrating management discipline and business resilience.


Why Defensive Dividend Aristocrats Matter Right Now

Periods of higher interest rates, slower growth, or market uncertainty tend to expose weak business models. Defensive dividend aristocrats, on the other hand, tend to:

  • fall less during market corrections,
  • recover faster after downturns,
  • and continue paying (and often increasing) dividends when others cut.

They form the core of many long-term Canadian portfolios.


Executive summary

CompanyDefensive StrengthDividend Profile
Fortis (FTS)
Utilities
Regulated electric & gas assets; highly predictable earnings50+ years dividend growth; steady increases
Canadian Utilities (CU)
Utilities
Majority regulated / contracted cash flows35+ years dividend increases; stable high yield
Enbridge (ENB)
Energy Infrastructure
Toll-road pipeline model; contracted revenuesHigh yield; consistent dividend growth
Metro (MRU)
Consumer Staples
Essential grocery & pharmacy spendingLower yield; strong dividend growth rate
Loblaw (L)
Consumer Staples
National food & drug retail dominanceLow yield; growth + share buybacks
Hydro One (H)
Utilities
Monopoly-like transmission network; regulated returnsModerate yield; steady dividend growth
Intact Financial (IFC)
Insurance
Pricing power; diversified P&C insurance20+ years dividend growth; low payout ratio

1.    Fortis (FTS)

Sector: Utilities

Fortis is one of the most reliable income stocks available to Canadian investors. It represents the very definition of a defensive dividend aristocrat, designed not to chase rapid growth, but to deliver steady, predictable cash flow through all market cycles.

The company owns and operates regulated electric and gas utilities across Canada, the United States, and the Caribbean. Because roughly 99% of Fortis’ assets are regulated, its earnings are largely insulated from economic slowdowns, commodity price swings, and market volatility. Rates are set by regulators, providing visibility and stability that few sectors can match.

Fortis has increased its dividend for more than 50 consecutive years, placing it among a small and elite group of North American dividend aristocrats. Today, the stock offers a forward dividend yield of approximately 3.5%, supported by a conservative payout ratio near 70% and a clear policy of annual dividend growth.

What makes Fortis especially attractive for income investors is the predictability of its growth. Management has laid out a multi-year capital investment plan exceeding $25 billion, which expands its regulated rate base and supports dividend growth of 4%–6% annually. This growth is often linked to inflation, helping protect purchasing power over time.

Why Fortis fits an income portfolio

  • Regulated utilities = highly predictable earnings
  • Inflation-linked revenue adjustments
  • Conservative payout ratio and strong balance sheet
  • Decades-long dividend growth track record

Fortis will not make investors rich overnight — but for those seeking durable income, capital preservation, and peace of mind, it remains one of the strongest defensive anchors in a long-term income portfolio.


2. Canadian Utilities (CU)

Sector: Utilities

Canadian Utilities is one of the most conservative and income-oriented stocks in the Canadian market. For investors whose primary objective is reliable, long-term dividend income, CU stands as a true cornerstone holding.

The company holds one of the longest dividend growth streaks in Canada, with 36 consecutive years of dividend increases. This track record reflects a deeply embedded culture of capital discipline, risk management, and shareholder income prioritization. Canadian Utilities operates across electricity generation, transmission, and natural gas distribution, with the vast majority of its assets either regulated or backed by long-term contracts.

From an income sustainability perspective, CU is particularly attractive. The stock currently offers a forward dividend yield of approximately 4.2%, supported by a conservative payout ratio near 55%. This leaves ample room to absorb higher interest costs, regulatory delays, or economic slowdowns without putting the dividend at risk.

Unlike higher-growth utilities, Canadian Utilities emphasizes capital preservation over expansion. Dividend growth has historically been modest — around 1% annually over the past five years — but this slower growth comes with exceptional stability. For retirees and income investors, predictability often matters more than acceleration.

Another key strength is parent support from the ATCO Group, which provides financial flexibility, operational expertise, and strategic stability during challenging periods.

Why Canadian Utilities fits an income portfolio

  • Extremely long dividend growth history
  • High proportion of regulated and contracted earnings
  • Conservative payout ratio and balance sheet
  • Strong sponsorship from ATCO

Canadian Utilities is not designed to maximize total return. Instead, it excels at delivering what income investors value most: consistency, durability, and peace of mind.


3. Enbridge (ENB)

Sector: Energy Infrastructure (Midstream)

Enbridge is often misunderstood because it sits in the energy sector, but it is not a commodity producer. It does not drill for oil or gas, nor does its cash flow depend directly on energy prices. Instead, Enbridge operates critical energy infrastructure — pipelines, storage, and utility assets — that function much like toll roads.

The vast majority of Enbridge’s earnings are generated from long-term, take-or-pay contracts, meaning customers pay regardless of short-term fluctuations in commodity prices. This structure provides high visibility and predictability of cash flows, which is why Enbridge behaves far more like an infrastructure or utility company than a cyclical energy stock.

For income investors, Enbridge’s appeal is clear. The stock currently offers a forward dividend yield near 6%, one of the highest among large, established Canadian dividend payers. Enbridge has increased its dividend for 12 consecutive years, supported by stable distributable cash flow and regulated utility operations in addition to its pipeline network.

That said, Enbridge is best viewed as high-income, moderate-risk infrastructure. Its payout ratio is elevated, and the company carries meaningful debt, which makes it more sensitive to interest rates than utilities like Fortis or Canadian Utilities. However, management has shifted toward balance-sheet repair, asset sales, and capital discipline, reducing risk over time.

Why Enbridge fits an income portfolio

  • Contracted, infrastructure-like cash flows
  • Strong earnings visibility
  • Attractive, above-average dividend yield
  • Long history of dividend growth

Enbridge offers something rare in the Canadian market: high current income combined with infrastructure stability. For investors willing to accept moderate financial risk in exchange for a generous and reliable payout, ENB can serve as a powerful income engine within a diversified dividend portfolio.


4. Metro (MRU)

Sector: Consumer Staples

Metro is one of Canada’s highest-quality defensive consumer staples companies, operating in a sector that remains resilient regardless of economic conditions. Food and pharmacy spending is non-discretionary — consumers may cut back on travel or entertainment, but they continue to buy groceries and essential medications. This makes Metro’s business model inherently defensive.

The company operates a large network of grocery stores and pharmacies across Canada, supported by strong private-label brands that enhance margins and pricing power. These private labels not only protect profitability during inflationary periods, but also help stabilize cash flow when consumer budgets are under pressure.

From an income perspective, Metro is not a high-yield stock. Its forward dividend yield is approximately 1.8%, which may appear modest at first glance. However, what Metro lacks in yield, it more than compensates for with exceptional dividend growth and sustainability. The company has increased its dividend for 25 consecutive years, supported by a very low payout ratio near 30%. This conservative payout leaves ample room for continued dividend increases, even during economic slowdowns.

Over the past five years, Metro’s dividend has grown at an impressive double-digit annual rate, reflecting strong earnings growth, disciplined capital allocation, and consistent free cash flow generation. This makes MRU an attractive option for investors who want income that grows faster than inflation over time.

Why Metro fits a defensive income portfolio

  • Essential consumer spending exposure
  • Strong margins driven by private-label products
  • Consistent free cash flow generation
  • Long dividend growth track record with low payout ratio

Metro may not deliver high immediate income, but for investors seeking defensive stability, rising dividends, and long-term compounding, it is one of the best consumer staples holdings in Canada.


5. Loblaw Companies (L)

Sector: Consumer Staples

Loblaw Companies is Canada’s largest food and pharmacy retailer, operating an unmatched national network that includes Loblaws, No Frills, Shoppers Drug Mart, Real Canadian Superstore, and several private-label brands. This scale gives Loblaw a structural advantage in purchasing power, pricing flexibility, and cost efficiency — all critical in a defensive investment.

Like Metro, Loblaw benefits from non-discretionary consumer spending. Regardless of economic conditions, consumers continue to buy groceries and essential healthcare products. This makes Loblaw’s revenue base highly resilient, even during recessions or periods of elevated inflation.

From an income perspective, Loblaw is not designed to maximize yield. Its forward dividend yield is under 1%, but this low yield is paired with an exceptionally conservative payout ratio of roughly 17%. This gives the company significant flexibility to continue increasing dividends while also aggressively returning capital through share buybacks.

Dividend growth has been strong and consistent, with a double-digit five-year growth rate, supported by robust free cash flow and disciplined capital allocation. Buybacks play a key role in Loblaw’s shareholder return strategy, reducing share count and enhancing per-share earnings and dividend growth over time.

Another important defensive advantage is Loblaw’s ability to pass inflation through pricing. Its private-label offerings and scale allow it to protect margins even when input costs rise, helping stabilize cash flow.

Why Loblaw fits a defensive income portfolio

  • Essential exposure to food and healthcare
  • Strong free cash flow generation
  • Very low payout ratio with room for dividend growth
  • Dividend growth enhanced by consistent buybacks

Loblaw may not appeal to investors seeking immediate income, but for those focused on defensive growth, rising dividends, and long-term capital preservation, it is one of the strongest consumer staples holdings in Canada.


6. Hydro One (H)

Sector: Utilities

Hydro One operates Ontario’s electricity transmission and distribution network, making it one of the most stable and predictable businesses in the Canadian market. As a near-monopoly provider of an essential service, Hydro One benefits from demand that is virtually immune to economic cycles. Homes and businesses need electricity regardless of inflation, recession, or market volatility.

The company’s earnings are largely governed by regulatory frameworks that set allowed returns on invested capital. While this regulation caps upside potential, it also significantly limits downside risk — a trade-off that is highly attractive for defensive income investors. Hydro One’s cash flows are steady, visible, and supported by long-term infrastructure assets with extremely long useful lives.

From an income perspective, Hydro One offers a forward dividend yield of roughly 2.5%, supported by a moderate payout ratio near 60%. The dividend has grown consistently, with an average annual growth rate in the mid-single digits over the past five years. This balance between current income and steady growth makes Hydro One suitable for investors seeking reliability rather than high yield.

Another important strength is Hydro One’s low earnings volatility. Because revenues are decoupled from commodity prices and consumer spending patterns, the company provides a stabilizing effect during market drawdowns. This makes it a valuable complement to higher-yield or more cyclical income holdings.

Why Hydro One fits a defensive income portfolio

  • Monopoly-like electricity transmission assets
  • Highly regulated and predictable returns
  • Low earnings and cash-flow volatility
  • Stable, steadily growing dividend

Hydro One may not generate excitement, but that is precisely its strength. For investors focused on capital preservation, dependable income, and portfolio stability, Hydro One plays a quiet yet critical role as a defensive anchor.


7. Intact Financial (IFC)

Sector: Financials (Property & Casualty Insurance)

Intact Financial offers a differentiated way to gain exposure to the financial sector while maintaining a defensive income profile. Unlike banks, whose earnings are heavily influenced by credit cycles and interest rate fluctuations, insurance companies tend to benefit from inflation and rising premiums. This makes Intact particularly attractive during periods of elevated costs and economic uncertainty.

As Canada’s largest property and casualty insurer, Intact operates a diversified insurance platform across auto, home, and commercial lines, both in Canada and internationally. The company has demonstrated exceptional underwriting discipline, consistently maintaining strong combined ratios that reflect profitable insurance operations rather than reliance on investment income alone.

From an income standpoint, Intact offers a forward dividend yield of just over 2%, supported by a very conservative payout ratio below 30%. This low payout provides substantial flexibility for continued dividend growth, even during periods of elevated claims or economic stress. Intact has increased its dividend for 20 consecutive years, with a near double-digit five-year growth rate, highlighting management’s long-term commitment to shareholder returns.

Another defensive advantage lies in Intact’s pricing power. Insurance premiums can be adjusted annually, allowing the company to pass higher costs onto policyholders over time. This dynamic helps protect margins and cash flow in inflationary environments, unlike many other financial institutions.

Why Intact fits a defensive income portfolio

  • Pricing power through premium adjustments
  • Diversified insurance operations across regions and lines
  • Strong underwriting and disciplined risk management
  • Long, consistent dividend growth record

Intact Financial combines defensive earnings, growing income, and inflation resilience. For investors seeking exposure to financials without the volatility associated with banks, IFC represents one of the strongest long-term income and stability plays in the Canadian market.


How to Use Defensive Dividend Aristocrats in a Portfolio

Defensive dividend aristocrats are best used as core holdings, not short-term trades.

Portfolio roles

  • Income stability
  • Volatility reduction
  • Capital preservation
  • Long-term compounding

A common approach is to combine:

  • utilities,
  • consumer staples,
  • infrastructure,
  • and insurance

This diversification reduces reliance on any single economic factor.


Best Accounts for Defensive Dividend Aristocrats

Choosing the right account can enhance the tax efficiency of defensive Dividend Aristocrats.

The TFSA is particularly well suited for dividend growth stocks. All income and capital gains generated inside the account are tax-free, making it an effective vehicle for investors seeking reliable, inflation-resilient cash flow without increasing their taxable income.

The RRSP can also be appropriate, especially for long-term compounding. While withdrawals are taxed, the upfront tax deduction and tax-deferred growth can be advantageous for investors still in higher tax brackets or planning structured retirement withdrawals.

A non-registered account remains a viable option as well. Eligible Canadian dividends benefit from the dividend tax credit, which reduces the effective tax rate compared to interest income.

Because Defensive Dividend Aristocrats primarily pay eligible Canadian dividends, they are generally considered tax-efficient holdings for Canadian investors across multiple account types.


Final Thoughts

Defensive dividend aristocrats are not designed to excite headlines or chase momentum. Their strength lies in discipline, consistency, and durability.

In uncertain markets, these companies allow investors to:

  • stay invested,
  • sleep better at night,
  • and continue compounding wealth without unnecessary risk.

For Canadian investors seeking stability without abandoning growth entirely, defensive dividend aristocrats remain one of the most reliable strategies available.

At first glance, DGS (Dividend Growth Split Corp.) looks like a powerful income vehicle. It offers high monthly distributions, exposure to well-known Canadian dividend growth companies, and a long operating history.

However, DGS is not a traditional ETF, and it does not behave like one. It is a split share corporation, a structure that can enhance income and returns in favorable markets—but also introduces unique risks that investors must understand before allocating capital.

This article explains how DGS works, where its income really comes from, and the key risks embedded in the structure, so investors can evaluate whether it fits their portfolio objectives. DGS is issued and managed by Brompton Funds, a Canadian firm specializing in income-oriented products, particularly split-share corporations.


1. What Is DGS?

DGS is a split share fund that holds a diversified portfolio of large-cap Canadian dividend growth stocks. Instead of issuing a single class of units like a standard ETF, it issues two separate securities:

  • Preferred Shares (DGS.PR.A)
    Designed to provide relatively stable income and capital priority.
  • Class A Shares (DGS)
    Designed to provide higher income and potential capital appreciation.

Each “unit” of the fund consists of:

  • 1 Preferred share
  • 1 Class A share

This structure creates embedded leverage for the Class A shares.


2. What Does DGS Invest In?

DGS holds a portfolio of established Canadian dividend-paying companies, primarily large-cap issuers with a history of earnings growth and cash-flow generation.

The portfolio includes:

  • Major Canadian banks and insurers
  • Infrastructure and utilities
  • Consumer staples and defensive growth companies
  • Select resource and industrial names

This is not a speculative portfolio. The underlying assets are fundamentally strong businesses commonly found in dividend growth and quality-focused strategies.


3. How the Split Share Structure Works

The defining feature of DGS is capital prioritization:

  1. Preferred shareholders are paid first
    They have priority on dividends and on capital at maturity.
  2. Class A shareholders receive what remains
    Income and capital gains accrue only after preferred obligations are met.

As a result:

  • Class A shares benefit from leveraged exposure to the underlying portfolio
  • Returns are magnified in rising markets
  • Losses are magnified in declining markets

This leverage is structural, not optional.


4. Where Do Class A Distributions Come From?

Class A distributions are monthly and are primarily return of capital (ROC).

This means distributions may be funded by:

  • Dividends received from portfolio holdings
  • Capital gains
  • Portfolio cash flow
  • A return of investors’ original capital

Return of capital is not inherently negative, but it has two important implications:

  • It reduces the fund’s net asset value (NAV) if not offset by asset appreciation
  • It lowers the investor’s adjusted cost base (ACB) in taxable accounts

Income investors should focus on NAV sustainability, not just headline yield.


5. The Most Important Risk: Distribution Suspension

The single most important risk for investors in Class A shares (DGS) is the risk of distribution suspension. This risk is structural and embedded in how split share funds are designed.

How the rule works

Class A distributions are not guaranteed. They are paid only if two conditions are met:

  1. Preferred shareholders are fully paid first
    If preferred share distributions (DGS.PR.A) are in arrears, Class A receives nothing.
  2. NAV coverage test is respected
    After paying the Class A distribution, the Net Asset Value per unit must remain above a predefined minimum level.
    If paying income would push NAV below that threshold, the distribution is automatically suspended.

This is not a discretionary decision by the manager—it is a hard rule written into the fund’s structure.

What this means in real markets

During sharp or prolonged market declines:

  • Class A distributions can stop entirely
  • The Class A share price often falls faster than the underlying stocks because leverage works in reverse
  • Income-focused investors may experience months (or longer) with zero cash flow

Meanwhile, preferred shares continue to receive priority payments as long as coverage allows.

Why this matters

Many investors focus on the headline yield of Class A shares without fully appreciating that:

  • The income is conditional
  • The leverage is structural and permanent
  • Income risk increases precisely when markets are under stress

Understanding this risk is essential before using DGS Class A as an income replacement rather than a tactical or satellite position in a portfolio.


6. Leverage Risk and Market Drawdowns

Because Class A shares are effectively leveraged:

  • Gains are amplified in rising markets
  • Drawdowns are deeper during market stress

A moderate decline in the portfolio can translate into a disproportionate decline in Class A NAV. This makes DGS unsuitable for investors who require stable income in all market environments.


7. Interest Rate Sensitivity

Although DGS holds equities, it is indirectly sensitive to interest rates:

  • Preferred shares are rate-sensitive instruments
  • Rising interest rates can pressure preferred valuations
  • That pressure flows through to Class A NAV

This means DGS can underperform during periods of rising rates even if equity markets are stable.


8. Term and Extension Risk

DGS has a stated maturity date, after which:

  • The fund may be terminated, or
  • The term may be extended by the board

At maturity or extension:

  • Dividend terms may change
  • Market prices may diverge from NAV
  • Investors face reinvestment risk

This makes DGS less predictable than perpetual ETFs.


9. Is DGS “Safe”?

DGS is not a low-risk product, but it is also not inherently flawed.

It may be suitable for:

  • Experienced income investors
  • Portfolios that can tolerate income variability
  • Tactical allocations during stable or rising equity markets

It is not suitable as:

  • A bond substitute
  • A guaranteed income vehicle
  • A core retirement holding requiring steady cash flow

Historical performance


Source: Brompton Funds site

Preferred Shares: Stable, Bond-Like Returns

The Preferred series shows very consistent returns, generally in the 5.4%–6.9% range year after year.
This reflects its senior, quasi-fixed-income nature:

  • Fixed distribution paid first (~6%)
  • Priority claim on assets
  • Low volatility
  • Limited participation in portfolio upside

👉 Preferred shareholders are buying income stability, not growth.


Class A: Residual + Embedded Leverage

The Class A returns are dramatically higher—but also far more volatile:

  • 1-Year: 37.6%
  • 5-Year: 32.7%
  • 10-Year: 19.1%
  • Individual years range from +92% to −41%

This happens because Class A:

  • Receives only what remains after the Preferred distribution is paid
  • Absorbs all upside and downside beyond the Preferred claim
  • Has structural leverage built into it

In practical terms:

The Preferred distribution acts like a fixed financing cost, and Class A is the equity layer above it.

When markets are strong, this structure amplifies returns.
When markets are weak, losses are magnified.

10. How DGS Fits in a Portfolio

DGS should be viewed as a satellite income position, not a core holding. Its split-share structure introduces structural leverage and conditional distributions, which can enhance income in favorable markets but increase downside risk during periods of stress. For this reason, position sizing is critical.

A prudent approach is to limit exposure and integrate DGS alongside more stable income assets. It pairs best with traditional dividend ETFs, which provide diversified, unlevered exposure to dividend-paying companies, as well as utilities or infrastructure investments that offer regulated, predictable cash flows. Adding bonds or cash equivalents can further stabilize the portfolio and provide liquidity during market drawdowns, when DGS distributions may be suspended.

Importantly, investors should focus less on headline yield and more on NAV trends. A declining NAV can signal rising risk to Class A distributions, regardless of current payout levels. In practice, DGS works best as an opportunistic income enhancer within a diversified, risk-aware portfolio—not as a primary income foundation.

Summary:

  • Treat DGS as a satellite income position
  • Limit position size
  • Combine with:
    • Traditional dividend ETFs
    • Utilities or infrastructure
    • Bonds or cash equivalents

Monitoring NAV trends is more important than monitoring yield alone.


Final Thoughts

DGS can be a powerful income tool when used correctly. Its appeal lies in its ability to convert a high-quality dividend growth portfolio into enhanced income through structural leverage.

However, that same structure introduces:

  • Income interruption risk
  • Amplified volatility
  • Sensitivity to market cycles and interest rates

The key question for investors is not:

“Is the yield attractive?”

But rather:

“Can I tolerate leveraged drawdowns and suspended income during market stress?”

Answering that honestly is essential before investing in DGS

When investors think about artificial intelligence, they tend to focus on what is most visible: AI models, software platforms, semiconductors, and cloud providers. Yet as we move into 2026, one of the most critical constraints on AI growth is not software or chips—it is something far more basic:

The electrical grid.

AI is an energy-intensive technology. Data centers consume enormous amounts of electricity, require near-perfect reliability, and concentrate demand in very specific geographic locations. Even if power generation (nuclear, gas, renewables) keeps pace, the existing grid was not designed for this type of load.

This makes electrical grid and transmission infrastructure one of the most underappreciated investment themes tied to AI—and one of the most durable.

In this article, we focus specifically on grid-focused ETFs, why they matter, how they benefit from AI, and why they deserve attention in 2026 portfolios.


1. Why the Grid Is the Real AI Bottleneck

Power generation often gets the headlines: nuclear plants, uranium, renewables. But electricity is useless if it cannot be delivered reliably and efficiently.

Most North American grids were built:

  • Decades ago
  • For centralized power plants
  • With predictable consumption patterns
  • Without massive 24/7 industrial-scale loads

AI data centers break all of those assumptions.

What AI Changes

AI infrastructure creates:

  • Extreme power density (especially for GPUs)
  • Constant demand (no downtime tolerance)
  • Localized demand spikes near data center hubs
  • Grid stability challenges

In many regions, the grid—not power generation—is now the limiting factor for new data center approvals. Utilities are delaying or rejecting projects simply because transmission and distribution systems cannot handle the load.

This is why capital spending is increasingly flowing not just into power plants, but into:

  • Transmission lines
  • Substations
  • Transformers
  • Grid automation
  • Energy management systems

And this is where grid-focused ETFs come into play.


2. GRID ETF: Pure Exposure to Grid Modernization

One of the most direct ways to invest in this theme is through GRID.

What GRID Actually Owns

GRID focuses on companies involved in:

  • Electrical transmission and distribution
  • Smart grid technologies
  • Power management systems
  • Grid automation and monitoring
  • Electrification infrastructure

Rather than owning utilities themselves, GRID targets the companies that build, upgrade, and manage the grid.

This is a critical distinction.

Utilities are regulated and often slow-growing. GRID, by contrast, holds firms that benefit from capex cycles, not rate approvals.


Why GRID Is Well Positioned for AI

AI-driven grid demand creates three powerful tailwinds for GRID holdings:

1️ Massive Grid Upgrade Spending

Governments and utilities are committing hundreds of billions to grid modernization over the next decade. Much of this spending is non-discretionary—the grid must be upgraded, regardless of economic cycles.

2️ Technology-Driven Grid Complexity

AI loads require:

  • Real-time monitoring
  • Advanced load balancing
  • Redundancy and resilience

This favors companies selling high-margin technology solutions, not just physical hardware.

3️ Long Project Pipelines

Grid projects are multi-year undertakings. Once contracts are awarded, revenue visibility is high, supporting stable cash flows.

GRID effectively turns these structural realities into a diversified equity exposure.


3. PAVE ETF: Broader Infrastructure with Grid Leverage

While GRID is highly targeted, PAVE offers a broader approach.

PAVE is not a pure energy ETF—but that is part of its strength.

What PAVE Includes

PAVE holds companies involved in:

  • Infrastructure construction
  • Engineering and materials
  • Industrial equipment
  • Transportation and utilities support
  • Power and transmission infrastructure

Many of its holdings benefit directly from:

  • Substation construction
  • Transmission expansion
  • Data center site development
  • Grid hardening and resilience projects

Why PAVE Works for Grid Investors

PAVE’s value lies in indirect exposure.

AI-driven grid upgrades require:

  • Concrete
  • Steel
  • Construction equipment
  • Engineering services
  • Industrial components

PAVE captures this second-order demand, which is often overlooked when investors focus only on “energy stocks.”

It also provides:

  • Broader diversification
  • Less thematic concentration
  • Exposure to government infrastructure bills

For investors who want grid exposure without betting exclusively on energy technology, PAVE serves as a core infrastructure allocation.


4. Government Spending: A Structural Tailwind

One reason grid ETFs are attractive is that government spending aligns with AI needs.

Across North America and Europe, policy priorities include:

  • Grid resilience
  • Electrification
  • Energy security
  • Climate transition
  • National competitiveness in AI

Grid upgrades are politically favorable:

  • They create jobs
  • Improve reliability
  • Support industrial growth
  • Enable AI and digital infrastructure

Unlike speculative tech spending, grid investment is bipartisan and strategic.

This creates a rare alignment:

  • Private sector demand (AI data centers)
  • Public sector funding (infrastructure programs)

GRID and PAVE are positioned at the intersection of both.


5. AI Data Centers and Demand Concentration

One unique challenge of AI is demand concentration.

Traditional electricity demand is spread across millions of homes and businesses. AI data centers, by contrast:

  • Consume as much power as small cities
  • Are clustered geographically
  • Require dedicated transmission capacity

This forces utilities to:

  • Build new transmission corridors
  • Upgrade substations
  • Install high-capacity transformers
  • Invest in redundancy

Companies supplying these components often enjoy:

  • High barriers to entry
  • Long customer relationships
  • Recurring upgrade cycles

Grid ETFs aggregate exposure to these firms without requiring investors to pick individual winners.


6. Risk Profile: Why Grid ETFs Are More Defensive Than AI Tech

Compared to AI software stocks, grid ETFs have a very different risk profile.

Advantages

  • Less valuation risk
  • Real asset exposure
  • Revenue tied to physical necessity
  • Long-term contracts and project pipelines

Risks

  • Interest rate sensitivity
  • Regulatory delays
  • Slower growth than pure tech
  • Capital intensity

This makes grid ETFs particularly attractive as:

  • Portfolio stabilizers
  • Inflation-resilient assets
  • Complements to growth tech holdings

They may not deliver explosive returns—but they offer durable, structural growth.


7. How to Use GRID and PAVE in a Portfolio

Conservative Allocation

  • GRID as a thematic satellite
  • Combined with utilities or dividend ETFs

Balanced Allocation

  • GRID for targeted grid exposure
  • PAVE for broader infrastructure diversification

Growth-Oriented Allocation

  • Grid ETFs alongside AI, semiconductors, and energy
  • Focus on long-term structural demand rather than short-term cycles

For most investors, grid ETFs work best as complements, not standalone holdings.


8. Why the Grid Theme Extends Beyond 2026

The most important point is this:

Grid investment is not a one-cycle story.

Once AI infrastructure is built:

  • Power demand does not decline
  • Maintenance and upgrades continue
  • Redundancy requirements increase

In other words, the grid does not “finish” upgrading—it evolves continuously.

This gives grid-focused ETFs one of the longest runways of any AI-related investment theme.


Conclusion: Owning the Wires Behind AI

AI may be digital, but its backbone is physical.

No matter which AI models win, which software platforms dominate, or which chips outperform, electricity must flow—reliably, continuously, and at scale.

That reality makes electrical grid and transmission infrastructure one of the most critical—and investable—AI enablers.

ETFs like GRID and PAVE allow investors to own this backbone:

  • Without betting on individual projects
  • Without chasing AI hype
  • With exposure to long-term, unavoidable investment needs

For 2026 and beyond, grid ETFs are not just an energy play—they are a strategic AI infrastructure allocation.

With interest rates still elevated and market volatility remaining a reality in 2026, many Canadian investors are actively searching for reliable monthly income without having to sell their investments. As a result, monthly income ETFs—particularly those using covered call strategies—have gained significant traction among retirees and income-focused portfolios.

Among Canadian providers, Hamilton ETFs has emerged as a specialist in high-income, covered-call-based ETFs, offering sector-specific solutions designed to convert market volatility into consistent cash flow.

In this article, we review the best Hamilton ETFs for monthly income in 2026, explain how their covered call strategies work, and help you determine which ETF may align best with your income needs and risk tolerance. The goal is not to chase yield blindly, but to understand how these ETFs fit within a well-structured income strategy.


Why Income Investors Choose Hamilton Covered Call ETFs

Hamilton ETFs focus on:

  • Monthly distributions
  • Covered call strategies to enhance income
  • Sector-specific exposure (banks, tech, utilities, energy, gold, broad markets)

These ETFs are not designed for maximum growth, but rather for:

  • steady cash flow,
  • income replacement,
  • and yield enhancement within diversified portfolios.
ETF Ticker Yield LeverageAUM (Approx.)
HMAX12.30%No$1.81 B
QMAX10.94%No$731.4 M
UMAX14.40%No$1.04 B
SMAX10.79%No$855.8 M
AMAX8.88%No$505.5 M

The Best Hamilton ETFs for Monthly Income

1. HMAX ETF Review – Canadian Bank Covered Call Income

HMAX ETF focuses on Canada’s major banks and financial institutions (RBC, TD, BMO, Scotiabank, etc.) and uses an active covered call strategy to generate higher monthly income.

Here is the key point most investors misunderstand: HMAX typically sells call options on about 50% of the portfolio, not 100%.

What does that mean in simple terms?

  • On half of the holdings, the manager sells at-the-money call options (usually short-term, often monthly).
  • In exchange, the ETF collects option premiums, which are paid out as monthly income.
  • The other 50% of the portfolio remains uncovered, allowing some participation in upside when bank stocks rise.

This balanced approach helps:

  • boost income without fully eliminating growth potential,
  • reduce volatility compared to fully covered portfolios,
  • and smooth cash flow for income-focused investors.

Investors like HMAX because it transforms relatively stable Canadian banks into a predictable monthly income source, while still keeping partial exposure to long-term capital appreciation.

Why invest in financials in the first place?

Financials—especially Canadian banks and insurers—are often considered a core sector for income-oriented investors.

Here’s why many investors allocate to financials:

  • Essential role in the economy
    Banks sit at the center of economic activity: lending, mortgages, payments, credit cards, and wealth management. As long as the economy functions, financial institutions remain relevant.
  • Strong cash flows
    Large banks generate consistent earnings which supports reliable dividends.
  • Dividend history and discipline
    Canadian banks, in particular, have a long track record of paying dividends.
  • Inflation and rate sensitivity
    In certain environments, higher interest rates can improve bank margins, helping earnings and income generation.
  • Lower volatility than many sectors
    Compared to tech or commodities, financials tend to be more stable, making them suitable for income-focused portfolios.

Best for:
Investors seeking reliable income from Canadian financials, especially retirees who value predictable cash flow.

Key risk:
Limited upside during strong bank rallies due to covered calls.


2. QMAX ETF Review – Technology Covered Call ETF for Monthly Income

QMAX ETF targets large-cap U.S. technology stocks and uses an active covered call strategy to turn volatility into monthly income.

Here’s what many average investors misunderstand: QMAX typically writes call options on about 50 % of the portfolio rather than fully covering all holdings.

What this means in practice:

  • On roughly half of the tech shares, the ETF sells at-the-money call options with short expiries (often monthly),
  • It collects premium income from those sales,
  • While the other half remains uncovered, allowing the portfolio to benefit from potential upside if tech stocks rally.

This strategy helps balance income generation with growth potential. Investors like QMAX because:

  • It offers higher monthly distributions than owning the stocks outright,
  • It harnesses the volatility inherent in tech stocks to generate cash flow,
  • And it still retains participation in market upswings thanks to the uncovered portion of the portfolio.

Why invest in technology in the first place (for QMAX)?

Technology stocks, particularly large-cap U.S. tech companies, are a cornerstone of many long-term investment portfolios — and there are several reasons investors choose this sector before even considering income strategies like QMAX:

  • Long-term growth leadership
    Many tech firms are market leaders with innovative products and services, strong competitive moats, and global reach. Over the past decade, technology has consistently led market returns.
  • High profitability and reinvestment power
    Dominant role in the modern economy
    Tech companies power digital transformation across industries — cloud computing, artificial intelligence, digital payments, social media, and more — making them less cyclical and more resilient over time.
  • Innovation-driven earnings
    Diversification benefit
    Including technology exposure in a portfolio can help diversify risks associated with sectors like financials, utilities, and energy.

Best for:
Income investors who still want exposure to technology, but with lower volatility than owning tech stocks outright.

Key risk:
Strong tech bull markets may cap upside returns.


3. UMAX ETF Review – Utilities Covered Call ETF (Defensive Income)

Defensive Utilities Income

UMAX ETF focuses on utility companies and uses a covered call strategy with at-the-money (ATM) options to generate enhanced monthly income.

A key point many average investors miss: UMAX typically sells ATM call options on about 50% of the portfolio, not on all holdings.

In simple terms:

  • On roughly half of the utility stocks, the ETF sells ATM call options, meaning the strike price is close to the current market price.
  • ATM options generate higher option premiums than out-of-the-money calls, which boosts monthly income.
  • The remaining 50% of the portfolio stays uncovered, allowing some participation if utility stocks rise.

Why invest in utilities in the first place?

Utilities are often considered defensive investments because:

  • Demand for electricity, water, and gas is relatively stable, regardless of economic cycles.
  • Revenues are often regulated, which can lead to more predictable cash flows.
  • Utility stocks tend to be less volatile than the broader market.

Investors like UMAX because it combines the stability of utilities with enhanced income generation, making it appealing for conservative, income-focused portfolios.

Why invest in utilities in the first place (for UMAX)?

Utilities are a core defensive sector in many investment portfolios, and there are solid reasons investors allocate to them before even considering income strategies like UMAX:

  • Stable demand and essential services
    Utility companies provide electricity, water, gas, and related infrastructure—services people and businesses need regardless of economic conditions.
  • Predictable cash flows
    Because their services are essential and often regulated, utilities tend to generate steady, predictable income, which supports reliable dividends.
  • Lower volatility
  • Defensive characteristics during downturns
  • Dividend focus
    Many utility companies have a history of paying dividends, appealing to investors seeking income and stability.

Best for:
Conservative investors prioritizing capital stability and income consistency.

Key risk:
Interest-rate sensitivity typical of utility stocks.


4. SMAX ETF Review – U.S. Equity Covered Call ETF (S&P 500-Style Income)

SMAX ETF is designed for investors seeking attractive monthly income while maintaining diversified exposure to large-cap U.S. equities across multiple sectors. With a current yield of 10.79% and monthly distributions, SMAX aims to convert equity market volatility into consistent cash flow.

The ETF holds a broad mix of U.S. stocks that closely resembles the sector composition of the S&P 500, including technology, financials, healthcare, consumer sectors, and energy. Instead of concentrating on a single theme, SMAX provides diversification across the U.S. economy, reducing reliance on any one stock or sector.

To generate income and reduce volatility, SMAX employs an active covered call strategy. Importantly, the coverage ratio is flexible, meaning calls are written on only part of the portfolio and adjusted over time to balance income generation with upside participation.

Best for:
Investors seeking diversified U.S. exposure with monthly income.

Key risk:
Income may fluctuate depending on market volatility.


5. AMAX ETF Review – Gold Miners Covered Call ETF for Income

AMAX ETF stands out because it combines gold producer exposure with an active covered call strategy to generate monthly income—a rare combination in the Canadian ETF landscape.

Unlike physical gold or traditional gold ETFs, AMAX invests in gold-mining companies, whose revenues and cash flows are leveraged to the price of gold. This creates higher volatility, but also higher option premiums, which the fund monetizes by selling covered call options. Those option premiums are the primary driver of AMAX’s income distributions.

Key characteristics include:

  • Exposure to gold miners, not bullion
  • A potential hedge against inflation and currency weakness, as gold often performs well when real interest rates fall
  • Higher volatility than traditional income ETFs, due to both commodity price swings and equity market sensitivity

AMAX is best viewed as a diversification and inflation-protection tool, rather than a core income holding. It can complement traditional income ETFs by adding a non-correlated income source, but investors should be comfortable with larger price swings in exchange for income and diversification benefits.

Best for:
Investors seeking diversification and inflation protection, with income.

Key risk:
Commodity price fluctuations can impact NAV.


Important Risks of High-Yield Covered Call ETFs

While Hamilton ETFs are attractive tools for generating monthly income, it is essential for investors to clearly understand the trade-offs involved before allocating capital. These ETFs are designed primarily for cash flow, not for maximizing long-term capital appreciation.

First, covered calls limit upside potential. By selling call options on a portion of the portfolio, the ETF collects option premiums that fund distributions. However, when markets rise sharply, gains on the covered portion are capped. This means investors may underperform the broader market during strong bull runs.

Second, high yields do not guarantee capital preservation. A double-digit yield can be appealing, but it does not imply safety. Distributions are generated from option premiums and dividends—not guaranteed returns—and market declines can still reduce the ETF’s net asset value (NAV).

Third, NAV erosion can occur in prolonged bull markets. When equities trend upward for extended periods, repeatedly selling calls can cause the ETF to lag the underlying stocks. Over time, this may result in slower NAV growth or even erosion compared to non-covered strategies.

Finally, these ETFs are best used as income tools, not pure growth investments. They are most effective when used intentionally—such as funding retirement income, enhancing portfolio cash flow, or replacing part of a bond allocation—rather than as long-term growth engines.

In short, Hamilton ETFs can play a valuable role in an income-focused portfolio, but success depends on understanding their mechanics and using them for the purpose they were designed for: reliable income, with controlled risk—not maximum growth.

Important Risks of High-Yield Covered Call ETFs

Final Thoughts

Hamilton ETFs offer some of the most compelling monthly income solutions available to Canadian investors today. By combining sector-focused equity exposure with actively managed covered call strategies, these ETFs can play a meaningful role in:

  • retirement income planning,
  • cash-flow-focused portfolios,
  • and yield enhancement strategies.

However, they are not one-size-fits-all investments. The higher income comes with clear trade-offs, including capped upside and potential NAV erosion over time. Understanding how each ETF generates income, which sector it targets, and the risks involved is essential before allocating capital.

Used thoughtfully—often as part of a broader, diversified portfolio—Hamilton ETFs can help investors prioritize income without losing sight of long-term portfolio stability. The key is aligning the ETF selection with your objectives, time horizon, and tolerance for volatility, rather than focusing solely on headline yields.

The Harvest Diversified High Income Shares ETF (TSX: HHIS) is designed to provide investors with diversified exposure to U.S. companies while generating a relatively high level of monthly income. It does this primarily through a portfolio of enhanced single-stock ETFs that use an active covered call strategy, and in certain cases, modest leverage. HHIS may appeal to investors looking for income from companies that are traditionally associated with growth rather than dividends.

This article provides an objective overview of how HHIS is structured, what it holds, how income is produced, potential advantages, risks, and how the ETF may fit within an investment portfolio.

Executive summary

Harvest Diversified High Income Shares ETF


ETF Objective and Investment Approach

HHIS seeks to combine three elements in one product:

  • exposure to large, well-known U.S. companies
  • monthly cash distributions
  • diversification through a basket of individual enhanced income ETFs

The ETF does not attempt to track a specific index. Instead, it is actively managed. Portfolio managers select and weight holdings and determine covered call activity levels. The primary income source is option premium generated by selling covered call options on the underlying positions.

HHIS is available in Canadian dollar and U.S. dollar trading classes, making it accessible to investors with income preferences in either currency.

Video


Portfolio Structure and Holdings

HHIS holds a portfolio of Harvest single-stock High Income Shares ETFs rather than owning individual securities directly. Each of those underlying ETFs typically:

  • focuses on one publicly listed U.S. company
  • writes covered calls on a portion of its position
  • may employ modest leverage (approximately 25% in enhanced series)
  • distributes income monthly

Therefore, HHIS functions as a fund-of-funds.

Holdings are diversified across several well-known U.S. companies in areas such as technology, e-commerce, semiconductors, pharmaceuticals, and fintech. Examples include ETFs tied to:

Allocations may change over time as the manager adjusts exposures. Investors should consult the most recent fact sheet or management report for precise weighting and current holdings.


Covered Call Strategy

The defining feature of HHIS is its covered call writing strategy implemented at the underlying ETF level. A covered call involves:

  1. holding a stock or ETF
  2. selling call options on that asset
  3. collecting option premiums in exchange for giving up some potential upside

Option premiums collected contribute materially to monthly distributions. However, covered call writing also reduces participation in strong upside price movements because gains above the option strike price are limited or foregone when calls are exercised.

Harvest typically limits overwrite levels to a maximum of 50% of the portfolio, allowing some portion of assets to remain uncovered, which preserves participation in potential growth.

The strategy is actively managed, meaning:

  • coverage levels may be adjusted based on volatility
  • strike selection varies
  • expiration timing can change based on market conditions

When volatility increases, option income potential typically rises but so does equity risk. When volatility is low, premium income declines but market conditions may be calmer.


Use of Leverage

Some of the single-stock enhanced ETFs within HHIS use approximately 25% leverage. The stated goal is to:

  • increase exposure to core holdings
  • potentially increase option premium income
  • enhance total return over time

However, leverage also magnifies losses during market downturns and increases portfolio volatility. Borrowing costs associated with leverage can rise when interest rates increase, which can impact fund performance and net income.

Investors considering HHIS should be aware that leverage is a meaningful risk factor and contributes to both higher income potential and increased drawdown risk.


Return of Capital (ROC): What HHIS investors should know

Investors in HHIS will notice that distributions may sometimes include Return of Capital (ROC). This is common among covered-call income ETFs and fund-of-fund structures. Understanding ROC is important because it affects taxation, adjusted cost base, and long-term returns.

What ROC is (and isn’t)

ROC is a distribution that is not immediately taxed as income when received in a taxable account. Instead, it is treated as a return of your own invested capital. Because it is not taxed when paid, ROC reduces your Adjusted Cost Base (ACB). When you eventually sell units, a lower ACB may result in a larger capital gain.

ROC does not automatically mean the fund is “giving your money back.” In covered-call ETFs, ROC can result from:

option premium income

portfolio rebalancing

distribution-smoothing policy

fund-of-fund tax mechanics

However, if ROC remains persistently high and NAV declines over time, investors should evaluate whether distributions are being supported by option income or primarily by capital erosion


Key Advantages

Objectively, potential advantages of HHIS include:

Diversified exposure to leading companies

Investors gain access to multiple large-cap and innovative U.S. businesses in one ETF, which may reduce single-stock risk compared with owning only one growth company.

Monthly income distribution

The covered call strategy produces option premiums that support regular monthly cash flow, which can be attractive for those drawing income or reinvesting distributions.

Simplicity

HHIS combines:

  • security selection
  • option writing
  • rebalancing
  • distribution management

into one product, reducing the need for active involvement from the investor.

Lower capital threshold

Some underlying U.S. companies trade at high share prices. HHIS allows fractional exposure through an ETF trading on the TSX at a typically lower per-unit price.


Key Risks, Limitations and Fees

HHIS also carries meaningful risks. Key considerations include:

Equity market risk

The ETF primarily invests in equities. Market downturns can significantly reduce net asset value.

Capped upside potential

Covered call strategies limit capital appreciation during strong bull markets because option income is earned in exchange for foregoing some gains.

Leverage risk

Leverage magnifies returns in both directions. Losses are accelerated during market drawdowns and borrowing costs can affect returns when interest rates are high.

Sector concentration risk

Although diversified by issuer, many holdings are concentrated in technology-oriented industries. Sector-specific downturns can materially affect fund performance.

Distribution risk

Monthly distributions are not guaranteed and can fluctuate or be reduced depending on market conditions and option income availability.

Fees

Fees deserve special attention. HHIS has a Management Expense Ratio (MER) of 1.88%. This figure already includes its proportionate share of the fees of the underlying ETFs in which it invests. The MER is typical for actively managed, leveraged, covered-call fund-of-funds structures in Canada, but it is higher than broad index ETFs and some U.S.-listed covered call ETFs, which can be cheaper. Investors should weigh the higher cost against what they receive in exchange: professional options management, leverage handling, and a bundled one-ticket portfolio of single-stock covered call strategies.


Performance / Distributions

The Performance / Distributions table provides information about HHIS’s cash-flow history rather than its total return, because performance figures cannot be shown until the ETF has completed one full year from its inception date of January 16, 2025. Until that milestone is reached, the table focuses on distributions. It lists the record date, ex-dividend date, payment date, monthly amount per unit, and the cumulative total since inception. The amounts shown indicate that HHIS has made consistent monthly distributions, with payments of $0.25 per unit initially and a gradual increase to $0.27 per unit later in the year. This table helps investors understand the income stream generated so far, the timing of distributions, and how much has been paid in total since launch, even though full performance metrics such as total return and risk statistics will only be available after the first year of operation.

Record DateEx-Dividend DatePay DateAmount per UnitType
2025-12-312025-12-312026-01-06$0.2700Monthly
2025-11-282025-11-282025-12-05$0.2700Monthly
2025-10-312025-10-312025-11-06$0.2600Monthly
2025-09-292025-09-292025-10-09$0.2500Monthly
2025-08-292025-08-292025-09-09$0.2500Monthly

Who HHIS May Be Suitable For

HHIS may be considered by investors who:

  • seek income from U.S. equity exposure
  • prefer simplified “one-ticket” diversified products
  • do not want to write options themselves
  • are comfortable with equity risk and distribution variability
  • understand that upside potential may be partially capped
  • accept leverage as part of the strategy

It may appeal to:

  • income-focused investors
  • retirees or pre-retirees seeking cash flow
  • investors who hold traditional index ETFs but want income-tilted exposure
  • those seeking diversification among several well-known U.S. companies

Financial advisors and portfolio managers may also use HHIS in discretionary portfolios for income mandates.

About the ETF Provider

HHIS is managed by Harvest ETFs, an independent Canadian asset manager specializing largely in income-oriented exchange-traded funds. The firm emphasizes investment in established companies combined with disciplined options strategies. Harvest manages multiple High Income Shares ETFs and a variety of sector and thematic income funds.


Conclusion

HHIS offers a way to obtain diversified exposure to major U.S. companies while generating consistent monthly income through an active covered call approach. Its structure simplifies access to covered call strategies and enhanced single-stock ETFs in a single product. However, investors must balance the benefits of income and diversification against the trade-offs of capped upside, leverage, sector concentration, and equity market risk.

HHIS may be appropriate for investors seeking income-focused equity exposure who understand how covered calls and leverage affect risk and return. As with any investment decision, prospective investors should review the prospectus, management reports of fund performance, and risk disclosures, and consider how HHIS fits within their broader financial objectives and risk tolerance.

VOO is one of the most owned ETFs on the planet. Managed by Vanguard, it tracks the S&P 500 index — the 500 largest publicly traded companies in the United States. With an expense ratio of just 0.03%, it is among the cheapest investment products ever created. Warren Buffett has famously recommended it. Millions of American investors hold it as their core retirement position.

For Muslim investors in both the United States and Canada, VOO comes up constantly. It is simple, cheap, and widely recommended. But is it halal?

The answer is no — VOO is not halal in its standard form. But understanding why, and what to do instead, is what this article is about.

What Does VOO Actually Hold?

VOO tracks the S&P 500 index, which includes 500 of the largest U.S. companies weighted by market capitalization. As of 2026, the top holdings include Apple, Microsoft, Nvidia, Amazon, Alphabet (Google), Meta, Berkshire Hathaway, and JPMorgan Chase.

At first glance this looks promising — tech companies dominate the top of the list, and many of them pass Sharia screening individually. But the S&P 500 is a broad market index, which means it holds companies from every sector of the economy — including sectors that are categorically excluded under Islamic finance principles.

Why VOO Is Not Considered Halal

There are two main reasons VOO fails Sharia screening.

Problem 1 — Financial Sector Holdings

The S&P 500 includes a significant allocation to the financial sector — approximately 12-15% of the total index depending on market conditions. This includes:

  • JPMorgan Chase — the largest U.S. bank by assets, whose primary business is interest-based lending
  • Bank of America, Wells Fargo, Citigroup — all excluded for the same reason
  • Berkshire Hathaway — Warren Buffett’s conglomerate, which owns major financial businesses including insurance companies and a large stake in Bank of America
  • Goldman Sachs, Morgan Stanley — investment banking and financial services
  • Visa and Mastercard — these are sometimes considered borderline, but they facilitate interest-bearing transactions at scale

Conventional banking is categorically excluded under Islamic finance because the entire business model is built on charging interest — Riba. Owning an index that includes a 12-15% allocation to conventional banks means owning a fundamentally non-compliant portfolio, regardless of how strong the tech component is.

Problem 2 — Other Prohibited Sectors

Beyond financials, the S&P 500 also includes allocations to:

  • Alcohol companies — companies with significant alcohol revenue within consumer staples and other sectors
  • Defense contractors and weapons manufacturers — Lockheed Martin, Raytheon Technologies, Northrop Grumman
  • Tobacco companies — Altria, Philip Morris
  • Casino and gambling companies — depending on the current S&P composition

None of these can be made permissible through purification. They are categorically excluded regardless of their weighting in the index.

VOO — Sharia Screening Summary Holds conventional banks (JPMorgan, BofA, Wells Fargo, etc.) → 🔴 Fail Holds weapons manufacturers (Lockheed, Raytheon) → 🔴 Fail Holds alcohol and tobacco companies → 🔴 Fail No Sharia supervisory board → 🔴 Fail No purification ratio published → 🔴 Fail Top tech holdings (AAPL, MSFT, NVDA) individually halal → ✅ Pass on this subset only OVERALL VERDICT: Not halal

What About the Fact That Tech Makes Up 30%+ of VOO?

This is the most common argument we hear: ‘But VOO is mostly tech now — Apple, Microsoft, Nvidia, Amazon make up over 30% of it. Doesn’t that make it mostly okay?’

The answer is no, and here is why. Owning a fund that is 30% halal tech and 70% uninvestigated (with 15% in clearly haram financials) is not the same as owning a halal fund. The fund holds the haram companies just as definitively as it holds the halal ones.

Think of it this way: if you bought a basket of mixed fruit that included some rotten pieces, you would not eat the whole basket just because most pieces were fresh. You would either remove the rotten pieces — which is exactly what a halal ETF does — or buy a basket that only contained fresh fruit.

A halal ETF removes the prohibited companies and gives you only the compliant ones. VOO does not do this.

The Halal Alternative to VOO

The good news is that there is now a direct halal equivalent to VOO. In fact, there are several.

TickerFund Namevs VOOMERNotes
SPUSSP Funds S&P 500 Sharia ETFClosest equivalent0.49%Screens S&P 500 for Sharia — best substitute
HLALWahed FTSE USA Shariah ETFVery similar0.50%U.S. large & mid-cap, FTSE methodology
ISUSiShares MSCI USA Islamic ETFSimilar scope0.50%BlackRock’s Islamic U.S. equity ETF
SPRE.TOSP Funds S&P 500 Sharia (CAD)For Canadians~0.49%Same as SPUS but trades in CAD on TSX

SPUS — The Most Direct VOO Substitute

SPUS is managed by SP Funds and applies AAOIFI Sharia screening to the S&P 500 universe. It removes the prohibited companies — primarily financial stocks, defense contractors, alcohol, and tobacco — and holds the remaining compliant companies.

The result is a portfolio that looks quite similar to VOO’s top holdings, but without the haram exposure. Apple, Microsoft, Nvidia, Amazon, Alphabet, and Meta remain prominent holdings (subject to their passing Sharia screening at each quarterly review). The financials are removed.

The cost is slightly higher than VOO — 0.49% versus VOO’s 0.03% — but this is a necessary price for the screening infrastructure. And compared to most actively managed funds, 0.49% is still very low.

SPUS has grown to over $2 billion in assets under management, making it the largest halal ETF listed on U.S. exchanges. It is available at Fidelity, Charles Schwab, Robinhood, and most other U.S. brokers.

What About VTI — Vanguard Total Stock Market ETF?

Some investors ask about VTI — Vanguard’s Total Stock Market ETF, which holds virtually every publicly traded U.S. company (around 3,700 stocks). If VOO is not halal, VTI is even further from compliance. It holds every financial company, every weapons manufacturer, every tobacco and alcohol company in the U.S. market with no filtering whatsoever.

VTI has the same fundamental problem as VOO, amplified. More companies means more prohibited holdings, not fewer. The answer is the same: not halal, replace with a Sharia-screened equivalent.

Canadian Investors — A Special Note on VOO

Canadian investors sometimes hold VOO directly through their RRSP or TFSA at Questrade or Wealthsimple. Beyond the Sharia compliance issue, there are also practical reasons why a Canadian-listed equivalent may be preferable.

SPRE.TO — the Canadian-listed version of the SPUS strategy — trades in CAD on the Toronto Stock Exchange. It eliminates the need for currency conversion, which can cost 1.5-2% at most bank brokerages if not using Norbert’s Gambit. It also functions cleanly inside a TFSA without the U.S. dividend withholding tax applying in the same way.

For Canadian Muslim investors who were holding or considering VOO: SPRE.TO in your TFSA, or SPUS in your RRSP (to benefit from the Canada-U.S. tax treaty waiving the withholding tax), are the recommended replacements.

What About Performance? Is SPUS Competitive With VOO?

This is a fair and important question. The honest answer is that SPUS has underperformed VOO in some periods and outperformed it in others. The difference in long-term compound returns has been small.

The reason performance tracks closely is that the financial sector — the main thing being removed — is not the primary driver of S&P 500 returns over most long-term periods. Technology has been the dominant driver, and halal indices are effectively overweight technology relative to conventional indices. In technology bull markets, halal ETFs often outperform. In periods when financials do well, they may lag slightly.

What matters for Muslim investors is not that SPUS perfectly matches VOO — it is that SPUS gives you competitive exposure to U.S. equities without compromising your principles. The expected long-term return difference is small. The principle difference is significant.

Final Verdict

Is VOO Halal? — The Bottom Line VOO is NOT halal.   It holds a significant allocation to conventional banks, insurance companies, weapons manufacturers, and other prohibited sectors that cannot be corrected through purification.   The direct halal substitute is SPUS (in USD) or SPRE.TO (in CAD for Canadian investors). Both apply AAOIFI Sharia screening to the S&P 500 universe and are available at major brokers.   The performance difference relative to VOO has historically been small. The principled difference is significant — and it is entirely possible to build a competitive long-term portfolio without VOO.

To check the current Sharia compliance status of any ETF or individual stock, use our Free Halal ETF & Stock Screener at halaletfhub.com/screener — updated regularly for both Canadian and U.S. investors.

— Rachid Fouadi, M.Sc., CPA  ·