The stock market remains marked by great volatility. From the precipitous market decline at the onset of the pandemic to recent record highs in 2021, the market has certainly tested the courage of investors. To help you, we have compiled 3 lists:
– the best Mega caps in terms of performance since the start of the year. Mega caps means that the company must have a market value greater than $ 200 billion;
– the best large cap stocks in terms of performance since the start of the year. Large cap means that the company must have a market value greater than $ 10 billion;
– the best mid cap stocks in terms of performances since the start of the year. Mid cap means the company must have a market value greater than $2 Billion;
– the best small cap stocks in terms of performances since the start of the year. Small cap means the company must have a market value greater than $300 Millions dollars;
Best US Stocks in 2021 (Mega cap) by performance
Name
YTD %Chg
3Y * %Chg
ASML – Asml Hld NY Reg ADR
63.1
290.1
LLY – Eli Lilly & Co
55.4
156.6
NVDA – Nvidia
55.3
218.2
GOOG – Alphabet Cl C
55.2
119.8
GOOGL – Alphabet Cl A
54.2
115.7
NVO – Novo Nordisk A/S ADR
40.6
109.5
ORCL – Oracle Corp
39.2
86.3
XOM – Exxon Mobil
37.8
-28.4
DHR – Danaher
37.5
204.6
FB – Facebook Inc
31.4
99.1
As of August 4th, Barchart.com , *Cumulative return
Similar posts:
Best US Stocks in 2021 (Large cap) by performance
Name
YTD %Chg
3Y %Chg
AMC – Amc Enter
1,307.5
71.0
GME – Gamestop Corp
679.1
858.2
BNTX – Biontech Se ADR
408.3
N/A
MRNA – Moderna Inc
301.1
N/A
ASAN – Asana Inc Cl A
146.7
N/A
FUTU – Futu Holdings Ltd ADR
133.9
N/A
LB – L Brands Inc
114.9
155.8
TFII – Tfi Inter Inc
113.4
206.7
FTNT – Fortinet Inc
104.6
303.8
CLR – Continental Res
101.4
-49.3
As of August 4th, Barchart.com , *Cumulative return
As of August 4th, Barchart.com , *Cumulative return
Best US Stocks in 2021 (Small cap) by performance
Name
YTD %Chg
3Y %Chg
VTNR – Vertex Energy
1,080.1
577.4
MOXC – Moxian Inc
601.4
20.2
SGOC – Sgoco Gr
451.7
676.7
EXPR – Express Inc
424.1
-54.7
PDSB – Pds Biotechnology Corp
420.5
-38.7
BTU – Peabody Energy Corp
356.8
-74.6
UXIN – Uxin Ltd ADR
303.4
-46.4
IDT – IDT Corp
302.0
857.4
XYF – X Financial ADR
289.5
N/A
OCGN – Ocugen Inc
271.0
-95.3
As of August 4th, Barchart.com , *Cumulative return
Disclaimer
The data on this website is for your information only. It does not constitute investment advice, or advice on tax or legal matters. Any information provided on this website does not constitute investment advice or investment recommendation nor does it constitute an offer to buy or sell or a solicitation of an offer to buy or sell shares or units in any of the investment funds or other financial instruments described on this website. Should you have any doubts about the meaning of the information provided herein, please contact your financial advisor or any other independent professional advisor.
June 16th 2021: In this post we will review the Top 10 Best Growth ETF in the United States that are leading the pack so far this year! We have selected only ETFs that had the highest returns. Also, we limited ourselves to ETFs that have asset under management (AUM) above 100 millions dollars. ETFs with low AUM tend to be less liquid and cost more when trading because of the spread (the difference between the bid and ask price) is often high.
Please note, past performance does not guarantee future results. Always consult a financial advisor before making any financial decisions.
Highlights
Dry Bulk shipping
Because commodities are in a strong upcycle following the gradual reopening of global economies. Dry bulk shipping is historically a major beneficiary of commodity cycles.
Dry bulkers carriers account for 43% of the world fleet. They carry out 55% of global work. They serve essential needs such as food and energy supplies.
Energy (Oil and Natural gas)
Energy has strongly rebounded this year. This is especially true, as oil price has been benefiting the most from the expectation of swift global economic recovery buoyed by rapid vaccination rollout.
Many argue that we are headed to a commodities super-cycle. A phenomenon caused by inadequate supply faced with increase demand for commodities. This will impact all major commodities.
Small Caps
Smaller stocks have historically led after recessions, which could augur well for small-caps if the economy continues to strengthen this year, and the new stimulus bill in the US is expected to boost spending. However, investors should keep in mind small caps are inherently risky and more volatile.
Table 1: Info on: Asset under management in Millions and Management fee.
BDRY provides long exposure to the dry bulk shipping market through a portfolio of near-dated freight futures contracts on dry bulk indices. The Fund is designed to give investors pure-play exposure to the dry bulk market through a portfolio of near-dated freight futures contracts on dry bulk indices without the need for a futures account.
BDRY ETF Holdings
Name
% Total Assets
BALTIC CAPESIZE TIME CHARTER /JUNE 2021
15.78%
BALTIC EXCHANGE PANAMAX T/C /JUNE 2021
14.86%
BALTIC CAPESIZE TIME CHARTER /JUL 2021
13.99%
BALTIC CAPESIZE TIME CHARTER /AUG 2021
13.97%
BALTIC CAPESIZE TIME CHARTER /SEPT 2021
13.88%
BALTIC EXCHANGE PANAMAX T/C /JUL 2021
10.83%
BALTIC EXCHANGE PANAMAX T/C /AUG 2021
10.45%
BALTIC EXCHANGE PANAMAX T/C /SEPT 2021
10.15%
SUPRAMAX 58 TC FFA 58KT
3.41%
Issuer’s website as of June 15th
2- PSCE – S&P Smallcap Energy Invesco
The Invesco S&P SmallCap Energy ETF (Fund) is based on the S&P SmallCap 600® Capped Energy Index (Index). The Fund will normally invest at least 90% of its total assets in the securities of small-capitalization US energy companies that comprise the Underlying Index.
PSCE ETF Holdings
Company
% of Fund
PDC Energy Inc
9.84
Range Resources Corp
8.10
Matador Resources Co
7.58
Helmerich & Payne Inc
7.50
Southwestern Energy Co
7.21
Renewable Energy Group Inc
6.08
SM Energy Co
4.87
Callon Petroleum Co
4.67
Core Laboratories NV
4.08
Patterson-UTI Energy Inc
3.99
Issuer’s website as of June 15th
3- FCG – Natural Gas FT
FCG is invested in exchange-listed companies that derive a substantial portion of their revenues from the exploration and production of natural gas.
FCG ETF Holdings
Security Name
Weighting
DCP Midstream, LP
4.89%
Devon Energy Corporation
4.70%
Western Midstream Partners LP
4.68%
Hess Corporation
4.60%
EOG Resources, Inc.
4.54%
Marathon Oil Corporation
4.27%
Diamondback Energy, Inc.
4.20%
ConocoPhillips
4.02%
Antero Resources Corporation
3.79%
Issuer’s website as of June 15th
4- PXI – DWA Energy Momentum Invesco
The Invesco DWA Energy Momentum ETF (Fund) invests in companies showing relative strength (momentum), and is composed of at least 30 securities from the NASDAQ US Benchmark Index.
PXI ETF Holdings
Company
% of Fund
Cheniere Energy Inc
5.45
Callon Petroleum Co
4.38
Ovintiv Inc
4.37
Matador Resources Co
4.32
Texas Pacific Land Corp
4.19
SM Energy Co
4.14
Antero Resources Corp
3.62
Nabors Industries Ltd
3.10
Southwestern Energy Co
3.10
Clean Energy Fuels Corp
3.00
Issuer’s website as of June 15th
5- AMZA – Infracap MLP ETF
The Fund seeks to provide exposure to midstream master limited partnerships (MLPs) with an emphasis on high current income.
AMZA ETF Holdings
Security
Weight %
MPLX LP
17.25
ENTERPRISE PRODUCTS PARTNERS
15.35
WESTERN MIDSTREAM PARTNERS L
12.00
PLAINS ALL AMER PIPELINE LP
11.79
NUSTAR ENERGY LP
10.19
ENERGY TRANSFER LP
9.51
DCP MIDSTREAM LP
8.66
BP MIDSTREAM PARTNERS LP
6.99
PHILLIPS 66 PARTNERS LP
6.44
CRESTWOOD EQUITY PARTNERS LP
5.28
Issuer’s website as of June 15th
6- XOP – S&P Oil & Gas Expl & Prod SPDR
XOP Seeks to provide exposure the oil and gas exploration and production segment of the S&P TMI, which comprises the following sub-industries: Integrated Oil & Gas, Oil & Gas Exploration & Production, and Oil & Gas Refining & Marketing
Seeks to track a modified equal weighted index which provides the potential for unconcentrated industry exposure across large, mid and small cap stocks
Allows investors to take strategic or tactical positions at a more targeted level than traditional sector based investing
XOP ETF Holding
Name
Weight
Range Resources Corporation
3.55%
Antero Resources Corporation
3.45%
Southwestern Energy Company
3.19%
Hess Corporation
3.19%
Callon Petroleum Company
3.14%
Devon Energy Corporation
3.11%
Murphy Oil Corporation
3.09%
EQT Corporation
2.97%
EOG Resources Inc.
2.91%
Marathon Oil Corporation
2.89%
7- IEO – US Oil & Gas Explor & Prod Ishares
The iShares U.S. Oil & Gas Exploration & Production ETF seeks to track the investment results of an index composed of U.S. equities in the oil and gas exploration and production sector.
IEO ETF Holdings
Name
Weight (%)
CONOCOPHILLIPS
17.03
EOG RESOURCES INC
10.27
PHILLIPS
8.27
MARATHON PETROLEUM CORP
7.40
HESS CORP
5.15
CHENIERE ENERGY INC
4.81
DEVON ENERGY CORP
4.39
PIONEER NATURAL RESOURCE
4.12
DIAMONDBACK ENERGY INC
4.12
VALERO ENERGY CORP
4.07
Issuer’s website as of June 15th
8- URNM – Northshore Global Uranium Mining ETF
The North Shore Global Uranium Mining ETF seeks to provide investment results that, before fees and expenses, correspond generally to the total return performance of the North Shore Global Uranium Mining Index (the “Index”). The Index is designed to track the performance of companies that are involved in the mining, exploration, development, and production of uranium, as well as companies that hold physical uranium or other non-mining assets.
URNM ETF Holdings
COMPANY NAME
% OF NET ASSET VALUES
NAK KAZATOMPROM AO
16.51%
CAMECO CORP
15.20%
URANIUM PARTICIPATION CORP
7.98%
YELLOW CAKE PLC
5.98%
PALADIN ENERGY LTD
5.33%
DENISON MINES CORP
5.16%
NEXGEN ENERGY LTD
5.02%
ENERGY FUELS INC
4.25%
URANIUM ENERGY CORP
3.94%
CGN MINING CO LTD
3.87%
Issuer’s website as of June 15th
9- OIH – Oil Services Vaneck ETF
OIH is intended to track the overall performance of U.S.-listed companies involved in oil services to the upstream oil sector, which include oil equipment, oil services, or oil drilling.
OIH ETF Holdings
Name
Weight %
SCHLUMBERGER NV
22.02
HALLIBURTON CO
13.72
BAKER HUGHES CO
6.29
TENARIS SA
5.15
CHAMPIONX CORP
5.14
TECHNIPFMC PLC
4.97
NOV INC
4.55
LIBERTY OILFIELD SERVICES INC
4.50
HELMERICH & PAYNE INC
4.04
CACTUS INC
3.87
Issuer’s website as of June 15th
10- VDE – Energy ETF Vanguard
VDE follows a passive strategy. It includes stocks of companies involved in the exploration and production of energy products such as oil, natural gas, and coal.
The data on this website is for your information only. It does not constitute investment advice, or advice on tax or legal matters. Any information provided on this website does not constitute investment advice or investment recommendation nor does it constitute an offer to buy or sell or a solicitation of an offer to buy or sell shares or units in any of the investment funds or other financial instruments described on this website. Should you have any doubts about the meaning of the information provided herein, please contact your financial advisor or any other independent professional advisor.
Intro
May 17, 2021: An analysis of investment flows last week by US site etf.com shows renewed interest in value ETFs at the expense of growth ETFs. Thus, 2 popular American ETFs: iShares MSCI USA Value Factor ETF (VLUE) and the SPDR S&P 400 Mid Cap Value ETF (MDYV) recorded significant positive flows.
Both Value stocks or ETFs are considered by investors to be more suitable in an environment marked by inflation and rising interest rates. This explains the strategic reallocation operated by major players in the market. In this article, we will review the value ETFs offering in the Canadian market. For each fund, we will summarize the most relevant information (Performance, Costs and strategy). The same information will be provided for the two most popular funds in the United States.
Value ETFs adopt an investment strategy based on acquiring undervalued securities in the market. These securities are commonly referred as “Value stocks”. The principle is simple:
• Determine the true value of a security using the present value of future earnings and cashflows;
• Wait until this security is on sale! Indeed, the markets vary according to the good or bad news that emerges. These variations are in the great majority of the time excessive. Therefore, an investor who follows this strategy will wait for the right time to acquire these securities.
List of available Value ETFs in Canada and US
See below for a list of most popular value ETFs listed on the Canadian market. The main difference between these funds is their geographic coverage. It’s up to you to choose the one that best suits your needs. Keep in mind the tax impact when investing in funds with foreign content.
Source: Brachart.com / YDT: Since the beginning of the year
FXM CI First Asset Morningstar Cda Value and VVL Vanguard Glob Val Factor had the best performance whether since the start of the year or in the last 52 weeks.
VXM-B CI First Asset Morningstar Intl Value Unheg
VXM-B invests in developed markets outside the United States and Canada. It is an index fund that tracks the performance of the Morningstar® Developed Markets Index® Outside North America Target ValueTM Index.
Securities are considered “good value” based on characteristics such as low price-to-earnings and price-to-cash flow ratios.
Portfolio dated May 14:
Nom
%
BANCA POPOLARE DI SONDRIO
0,76
BANCO DE SABADELL SA
0,71
FERREXPO PLC
0,68
BCO COM PORTUGUES EUR 1.125
0,65
BW LPG LTD USD 0.01 144A
0,65
NIPPON YUSEN KABUSHIKI KAISH
0,64
MITSUI OSK LINES LTD
0,62
SANDFIRE RESOURCES NL
0,61
MEKONOMEN AB
0,60
FRESENIUS SE & CO KGAA
0,59
BILIA AB NPV
0,59
FXM – CI First Asset Morningstar Cda Value
The Fund is designed to provide diversified exposure to Canadian issuers that are considered “good value” based on characteristics such as low price-to-earnings and price-to-cash flow ratios.
Nom
%
ARC RESOURCES LTD
7,28
POWER CORP CANADA
3,74
WESTON (GEORGE) LTD
3,69
GREAT WEST LIFECO INC
3,62
KEYERA CORP
3,61
ALTAGAS LTD
3,61
EQUITABLE GROUP INC
3,56
KINROSS GOLD CORP
3,54
ATCO LTD
3,52
VVL – Vanguard Glob Val Factor
Vanguard Global Value Factor ETF seeks to provide long-term capital appreciation by seeking to capture the potential for excess return generated by investing in developed market equity securities around the world that are low relative to their parameters. fundamentals.
Geographical distribution
Country
Weight
États-Unis
64,3 %
Japon
7,9 %
Royaume-Uni
4,9 %
Corée
3,9 %
Canada
3,1 %
France
3,0 %
Allemagne
2,6 %
Italie
1,6 %
Hong Kong
1,2 %
Pays-Bas
1,0 %
Holdings as of May 14th
Name
% Weight
Verizon Communications Inc.
0,50 %
Royal Dutch Shell plc
0,50 %
AT&T Inc.
0,50 %
CVS Health Corp.
0,50 %
FedEx Corp.
0,50 %
Bristol-Myers Squibb Co.
0,50 %
Walgreens Boots Alliance Inc.
0,50 %
Ford Motor Co.
0,50 %
General Motors Co.
0,50 %
Volkswagen AG
0,50 %
ZVU – BMO MSCI USA Value Index
BMO MSCI U.S. Value Index ETF invests in U.S. equities exhibiting high value characteristics based on three variables: price to book ratio, future price to earnings ratio and value to cash flow from operations. business.
Portfolio dated May 14, 2021
Weight (%)
Name
6,87%
AT&T INC
6,74%
INTEL CORP
3,58%
MICRON TECHNOLOGY INC
3,45%
GENERAL MOTORS CO
3,08%
INTERNATIONAL BUSINESS MACHINES CORP
2,35%
CITIGROUP INC
2,12%
TARGET CORP
2,12%
CISCO SYSTEMS INC/DELAWARE
1,88%
APPLIED MATERIALS INC
1,82%
FORD MOTOR CO
XCV – Ishares Canadian Value Index
XCV seeks long-term capital growth by replicating the performance of the Dow Jones Canada Select Value Index, net of expenses. XCV provides exposure to large and mid-sized Canadian companies that are believed to be undervalued by the market relative to comparable companies
Name
Weight (%)
TORONTO DOMINION
10,27
ROYAL BANK OF CANADA
9,98
BANK OF NOVA SCOTIA
9,58
BANK OF MONTREAL
7,97
CANADIAN IMPERIAL BANK OF COMMERCE
6,06
BARRICK GOLD CORP
5,28
MANULIFE FINANCIAL CORP
5,18
CANADIAN NATURAL RESOURCES LTD
5,04
SUNCOR ENERGY INC
4,38
NUTRIEN LTD
4,26
VLUE – iShares MSCI USA Value Factor ETF
This is an American ETF listed in the United States. This is by far the most popular value style ETF. Its management fee is very low at only 0.15%. As indicated, the fund invests in undervalued companies. These companies can be medium or large caps.
Portfolio as of May 14
Name
Weight (%)
AT&T INC
6.88
INTEL CORPORATION CORP
6.75
MICRON TECHNOLOGY INC
3.58
GENERAL MOTORS
3.45
INTERNATIONAL BUSINESS MACHINES CO
3.07
CITIGROUP INC
2.36
CISCO SYSTEMS INC
2.12
TARGET CORP
2.11
APPLIED MATERIAL INC
1.87
FORD MOTOR CO
1.82
MDYV – SPDR S&P 400 Mid Cap Value ETF
The fund invests in equities with the strongest value characteristics based on: the book value / price ratio; benefit / price ratio; and sales / price ratio.
Portfolio as of May 14
Name
Weight
Steel Dynamics Inc.
1.00%
Owens Corning
0.87%
East West Bancorp Inc.
0.87%
Reliance Steel & Aluminum Co.
0.85%
First Horizon Corporation
0.83%
Jones Lang LaSalle Incorporated
0.80%
Lear Corporation
0.80%
Alleghany Corporation
0.78%
AECOM
0.77%
Kohl’s Corporation
0.76%
Disclaimer
The data on this website is for your information only. It does not constitute investment advice, or advice on tax or legal matters. Any information provided on this website does not constitute investment advice or investment recommendation nor does it constitute an offer to buy or sell or a solicitation of an offer to buy or sell shares or units in any of the investment funds or other financial instruments described on this website. Should you have any doubts about the meaning of the information provided herein, please contact your financial advisor or any other independent professional advisor.
Intro
Growth ETFs specializing in the financial sector (Banking and Insurance) have been on the rise since the start of the year. In this post, we will discuss the factors that favored the good performance achieved and also the risks that could impact it in the short term. We will discuss the top 5 financial sector ETFs that performed best in Canada in 2021. We limited ourselves to funds with assets under management greater than $ 100 million.
Positive factors
In fact, several factors helped increase the performance of these ETFs:
– The expected increase in interest rates generally favors retail banks in the long term;
– The majority of banks found themselves with exceptional results following the reversal of provisions set for the pandemic. Now that the vaccination is going better than expected (especially in the United States), the banks have ruled that these provisions are no longer relevant. The reversal of these provisions resulted in record profits;
– The segment behind banks’ profitability in the first quarter of 2021 is trading and investment banking activities. The level of trading activities led by small investors lately is really high. This high interest by individual investors in the financial markets was fueled by social media such as Reddit groups. Obviously, Banks benefited from this enthusiasm because of the increase in commissions earned. However, historically this kind of profit can quickly collapse with the slightest major correction in the stock market. American banking executives call this kind of income a “one time deal”.
The three largest US banks (JPMorgan, Goldman and Wells Frago) reported results better than expected by analysts in the first quarter of the year. However, not all segments performed well. Thus, traditional activities (deposits and loans) experienced performance below expectations. JP Morgan executives have even warned that they do not expect any improvement in the short term for this segment. They added that household spending should increase to return to pre-pandemic levels later this year, but that activities related to loans and credits in general should resume more slowly. Hence, revenues should remain either flat and improve slowly by the end of the year.
Note that you may gain exposure to the US financial sector by purchasing US listed ETFs. Below is the list of American ETFs that specialize in the financial sector. This can be tax-efficient if held in a registered account (RRSP).
The BMO Equal Weight US Banks Hedged to CAD Index ETF (ZUB) has been designed to replicate, to the extent possible, the performance of the Solactive Equal Weight US Bank Index Canadian Dollar Hedged, net of expenses. The Fund invests in and holds the Constituent Securities of the Index in the same proportion as they are reflected in the Index. The U.S. dollar exposure is hedged back to Canadian dollars.
BMO Equal Weight US Banks Index ETF has been designed to replicate, to the extent possible, the performance of the Solactive Equal Weight US Bank Index, net of expenses. The Fund invests in and holds the Constituent Securities of the Index in the same proportion as they are reflected in the Index.
This ETF is not hedged.
Holding details as of May 13th
Weight (%)
Name
5,51%
WELLS FARGO & CO
5,35%
AMERIPRISE FINANCIAL INC
5,31%
US BANCORP
5,24%
BANK OF AMERICA CORP
5,17%
CITIZENS FINANCIAL GROUP INC
5,13%
PNC FINANCIAL SERVICES GROUP INC/THE
5,13%
KEYCORP
5,11%
FIRST REPUBLIC BANK/CA
5,10%
FIFTH THIRD BANCORP
4,96%
M&T BANK CORP
FLI – CI First Asset US Cda Lifeco Income ETF
FLI invests in a portfolio of stocks of major North American life insurance companies.
The fund has the following objectives:
i) quarterly cash distributions;
ii) the possibility of capital appreciation; and
iii) lower overall volatility of returns.
Name
%
LINCOLN NATIONAL CORP
10,84
PRUDENTIAL FINANCIAL INC
10,35
METLIFE INC
10,28
GREAT WEST LIFECO INC
10,00
PRINCIPAL FINANCIAL GROUP INC
9,87
UNUM GROUP
9,76
AFLAC INC
9,75
SUN LIFE FINANCIAL INC
9,29
MANULIFE FINANCIAL CORP
9,12
GLOBE LIFE INC
8,99
FSF – CI First Asset Global Financial Sector ETF
The Fund’s investment objectives are to seek long-term total returns consisting of long-term capital appreciation and regular dividend income from an actively managed portfolio composed primarily of securities of issuers in the global financial services sector across developed and emerging markets.
Name
%
SYNCHRONY FINANCIAL
9,75
CITIGROUP INC
9,62
ING GROEP NV
7,90
BURFORD CAPITAL LTD
6,09
CONDUIT HOLDINGS LTD
4,46
EQUITABLE HOLDINGS INC
4,43
EAST WEST BANCORP INC
4,24
ATHENE HOLDING LTD
3,96
MONETA MONEY BANK AS
3,91
MANULIFE FINANCIAL CORP
3,76
ZEB – BMO S&P TSX Equal Weight Banks Index ETF
The BMO Equal Weight Banks ETF has been designed to replicate, to the extent possible, the performance of the Solactive Equal Weight Canada Banks Index, net of expenses. The index includes the major Canadian banks with a balanced allocation as you can see in the composition of the portfolio below.
Holding details as of May 13th
Weight (%)
Name
17,18%
BANK OF MONTREAL
16,90%
TORONTO-DOMINION BANK/THE
16,78%
CANADIAN IMPERIAL BANK OF COMMERCE
16,59%
NATIONAL BANK OF CANADA
16,50%
ROYAL BANK OF CANADA
15,86%
BANK OF NOVA SCOTIA/THE
0,19%
CASH
Research firms track a wide array of stocks. Their analysts issue regularly stock recommendations that range from Sell to Strong buy. They also set price targets for the stocks they analyze. In this article, we will use their research to identify stocks with the highest upside potential.
Methodology
Selected only stocks with market capitalization above 300 M $;
Only stocks followed by 5 analysts or more were included;
Only stocks with high upside potential were considered. To be conservative, we used only the lowest target price set by the analysts. See below the formula:
Upside potential = (lowest target price – Current price ) / Current price
As you can see below, the stocks selected are either in Biotechnology or Mining. Both sectors are the riskiest investment someone can find in the stock market. For instance, Biotech stocks are often small, cash-strapped, and have a future inextricably tied to the success or failure of one clinical trial.
Please note, Analysts’ recommendations remain estimates based on hypothetical scenarios of future growth. They can be accurate or completely off. Always consult a financial advisor before making a financial decision.
Results (Top 10)
Table below show the top 10 stocks with the highest upside potential as per research firms. We included in this post a discussion surrounding the top 5 stocks. The remaining stocks we will share just a quick profile and the stats.
Aurinia Pharmaceuticals Inc., a biopharmaceutical company, develops and commercializes therapies to treat various diseases with unmet medical need in Japan and China. The company offers LUPKYNIS for the treatment of adult patients with active lupus nephritis. Aurinia market cap is 1.7 Billion dollars. Revenues almost doubled in the past 5 years.
On May 12th, Aurinia was trading at 14.14$. The lowest target price set by analysts is 27.2$. So, there is a 92.36% potential upside as per analysts’ research. This stock lost 43.62% of its value in past 12 months. Sales of the biotech’s newly approved lupus nephritis medication Lupkynis (aka voclosporin) failed to reach analysts’ estimate. This seems to be the main reason why investors were disgruntled with the stock.
Trillium Therapeutics Inc., a clinical stage immuno-oncology company, develops therapies for the treatment of cancer. Trillium market cap is 1.1 Billion dollars.
Trillium focused lately its resources on cancers of the blood and solid tumors via intravenous administration. The company raised recently more than 300 million dollars through two rounds of fundraising and a $25 million investment from Pfizer.
Village Farms International, Inc., together with its subsidiaries, produces, markets, and distributes greenhouse-grown tomatoes, bell peppers, and cucumbers in North America. It operates through three segments: Produce Business, Energy Business, and Cannabis and Hemp Business. Village Farms market cap is 822 Million dollars. The company’s revenues grew by only 3.9% in the past 5 years.
This stock lost 54% of its value in the past 3 months alone. Its recent financial results showed weakness (EBITDA falling 63% from 1.1 M to just 400 K). The decline can be explained by:
Lower profit due to historically weak tomato prices;
Unbranded sales of Marijuana products fell 49%.
Financial statements showed some improvements such as a 20% increase in sales of Marijuana branded products. It seems investors were not satisfied overall and chose to sell on the news driving the stocks price down.
Endeavour Mining Corporation operates as a multi-asset gold producer in West Africa. Endeavour Mining Corporation was incorporated in 2002 and is based in London, the United Kingdom.
The company reported C$1.33 EPS for the last quarter, topping analysts’ consensus estimates of C$0.91 by C$0.42. The business had revenue of C$721.26 million during the quarter, compared to analysts’ expectations of C$715.49 million.
Americas Gold and Silver Corporation engages in the acquisition, exploration, development, and operation of mineral properties in North America. It explores for silver, lead, zinc, copper, and gold deposits.
Recently the stock declined following labor issues in Mexico in one of its mines. Top executive of Americas Gold and Silver Corp mentioned in BNN (March 22nd) that he is optimistic the issue can be resolved. The shut down has lasted about 14 months so far.
BELLUS Health Inc., a clinical stage biopharmaceutical company, develops therapeutics for the treatment of chronic cough and other hypersensitization disorders.
Calibre Mining Corp., together with its subsidiaries, engages in the acquisition, exploration, and development of gold properties in Nicaragua. The company primarily explores for gold, silver, and copper deposits.
In this post, we will go over the best performing growth ETFs in the past 5 years. We focused on ETFs that had the highest returns and asset under management above 100 Million dollars. ETFs that have low asset under management tend to be less liquid and cost more for investors when they want to trade them. This is why they were excluded from this analysis.
Obviously, historical performance is no indication of future returns!
DXG is a actively managed fund. The fund invests primarily in a diversified portfolio of equity securities of businesses located around the world that pay or are expected to pay a dividend or distribution. These securities are selected actively based on size, profitability and liquidity. 56% of the funds holdings are invested in US companies, this is why it’s part of our list of the best US Dividend ETFs in Canada.
This ETF is ideal for investors seeking a dividend income from an international basket of large caps. The fund is well diversified across a variety of sectors mainly Technology, Industrials, Consumer discretionary and Health care.
DXG Holdings detail
Company Name
Allocation
Ashtead Group PLC
6.2%
Hoya Corp
5.8%
LVMH Moet Hennessy Louis Vuitton SE
5.7%
Facebook Inc Class A
5.4%
Capital One Financial
5.2%
Alphabet Inc Class A
5.2%
Salesforce.com Inc
4.9%
NVIDIA Corp
4.8%
Edwards Lifesciences
4.7%
BNP Paribas Act. Cat.A
4.3%
Please consult issuers’ website for the most up-to-date data
DXG Sector breakdown
Country
Fund
United States
62.3
International
35.8
Please consult issuers’ website for the most recent data
DXG Sector breakdown
Sector
% Allocation
Financial Services
21.7%
Technology
17.8%
Consumer Cyclical
15.0%
Please consult issuers’ website for the most up-to-date data
COW -Ishares Global Agri Index ETF
The fund seeks exposure to companies involved in the production of agricultural products, fertilizers and agricultural chemicals, agricultural machinery, and packaged foods and meats.
Name
Weight (%)
MOSAIC
9.34
ARCHER DANIELS MIDLAND
9.31
CORTEVA INC
8.49
BUNGE LTD
7.69
CNH INDUSTRIAL NV
7.40
DEERE
6.26
INTREPID POTASH INC
5.78
TRACTOR SUPPLY
5.37
TYSON FOODS INC CLASS A
4.61
CF INDUSTRIES HOLDINGS INC
4.49
Please consult issuers’ website for up-to-date data – Best Growth ETF
VGG – Vanguard US Div Appr and VGH – U.S. Dividend Appreciation Index ETF (CAD-hedged)
VGG and VGH are both index fund (passively managed). They have the same investment strategy. They currently seeks to track the performance of the NASDAQ US Dividend Achievers Select Index. The latter is comprised of a select group of securities with at least ten consecutive years of increasing annual regular dividend payments.
VGH is hedged: Meaning the manager will seek actively to reduce currency risk. VGG is not hedged against currency fluctuation risk.
Index funds can be great especially from an MER perspective. VGG and VGH charge 0.30% MER which the lowest among the ETFs selected in our list. They offer an exposure to large number of established US corporations, mostly Bluechips such as Microsoft, Walmart…etc.
The choice between VGG and VGH depends solely on the investor take on currency. If the Canadian dollar appreciates then a hedged ETF will be a better choice. On the other hand, if the US dollar appreciates, then the non hedged ETF will have a better performance.
VGG Holding details
Company Name
Allocation
Microsoft Corp
4.5%
JPMorgan Chase & Co
3.9%
Johnson & Johnson
3.8%
UnitedHealth Group Inc
3.3%
Visa Inc Class A
3.2%
The Home Depot Inc
3.1%
Please consult issuers’ website for the most up-to-date data
VGG Geographic allocation
Country
Fund
USA
99.3%
Please consult issuers’ website for the most up-to-date data
VGG Sector allocation
Sector
% Allocation
Financial Services
17.0%
Industrials
16.9%
Healthcare
15.5%
Please consult issuers’ website for the most up-to-date data
ZLU -BMO Low Volatility US Equity ETF CAD
The purpose of BMO’s Low Volatility US Equity ETF (ZLU) is to provide exposure to a low beta weighted portfolio of U.S. stocks. Beta is a measure of volatility.
Weight (%)
Name
1.58%
CAMPBELL SOUP CO
1.55%
DOLLAR GENERAL CORP
1.52%
DOMINO’S PIZZA INC
1.51%
JOHNSON & JOHNSON
1.45%
MERCK & CO INC
1.40%
KELLOGG CO
1.39%
CBOE GLOBAL MARKETS INC
1.37%
PFIZER INC
1.36%
QUEST DIAGNOSTICS INC
1.36%
BECTON DICKINSON AND CO
Please consult issuers’ website for up-to-date data
VFV – Vanguard S&P 500 Index ETF
Vanguard S&P 500 Index ETF seeks to track the performance of a broad U.S. equity index that measures the investment return of large-capitalization U.S. stocks. The S&P 500 Index, or the Standard & Poor’s 500 Index, is a market-capitalization-weighted index of the 500 largest publicly-traded companies in the U.S.
The S&P 500 is an excellent index because most of its constituents are large, established US corporations. Besides, It’s well-diversified across various sectors of the US economy. The S&P 500 is widely regarded as the best gauge of large-cap U.S. equities. It can be easily used to express an opinion on the US economy in general. In other words, if you are bullish on the performance of the American economy in the long term, it’s probably the best index for you.
VFV ETF Holdings
Holding Name
Weight %
Apple Inc.
6.03
Microsoft Corp.
5.74
Amazon.com Inc.
3.88
Facebook Inc. Class A
2.19
Alphabet Inc. Class A
2.18
Alphabet Inc. Class C
2.03
Tesla Inc.
1.70
NVIDIA Corp.
1.40
Berkshire Hathaway Inc. Class B
1.37
JPMorgan Chase & Co.
1.32
please consult issuers website for up-to-date data
In this post, we will be going over the Best Global Dividend ETFs in Canada. Only, Global ETFs that invest primarily outside of North America were considered.
Methodology: we started by selecting the most popular ETFs based on Asset under management. Then, we compared these ETFs based on the dividend yield, performance over a 3 years period and volatility. For each ETF, we provide the funds’ objective, holdings and sector/geographic allocation.
Global Dividend ETFs are a great way to get exposure to international markets. However, in comparison with US or Canadian Dividend ETFs, Global Dividend ETFs are much less popular in Canada. Overall, the performance has been the main reason behind this lack of interest. We were able to identify only 4 ETFs that have more than 100 Million dollar in assets and who are truly global (invest in international market excluding US and Canada). As you would see below, BMO dominates the list with their offering especially with their European high dividend covered call ETFs.
Comparison MER or Volatility
Refer to the 2 tables below (The yields and performance data were updated as of March 27th). Note: Past performance does not mean necessarily that the fund will do well in the future).
Source: barchart.com and Issuers website / AUM is asset under management
– ZDI – BMO International Dividend ETF has the lowest MER among our list at 0.44%! While, ZWP – BMO Europe High Div Cov Call ETF has the highest MER at 071%.
Comparison Yield and performance
Symbol
Div Yield %
YTD %
1 yr %
3 yr %
Beta*
ZWP
7.08
2.01
7.89
n/a
n-a
ZWE
7.33
0.98
-1.61
1.30
0.98
ZDI
4.65
2.73
6.42
0.41
1.17
RID
3.27
1.24
13.03
1.96
0.97
Source: Yahoo Finance April 1st, 2021 / Beta is a measure of risk, the higher the Beta the higher is the volatility
– ZWP – BMO Europe High Div Cov Call ETF and ZWE – BMO Europe High Div CC CAD Hedge ETF are the highest dividends paying ETFs in our list. They both pay a little bit over 7% in dividend which is great. But, investors should know that a portion of these payouts are dividends, the other portion are options’ premiums. In fact, because both of these ETFs write covered calls dynamically, they generate additional income through option premiums in certain conditions. This strategy overall has a negative impact on the performance of these ETFs. When you are writing covered calls, you are in essence giving up on the upside potential of the stocks you own.
– RID – RBC Quant EAFE Dividend Leaders ETF has the best performance among the selected ETFs in our list.
The BMO Europe High Dividend Covered Call ETF (ZWP) has been designed to provide exposure to a dividend focused portfolio. These dividend paying companies are selected based on:
dividend growth rate,
yield,
payout ratio and liquidity.
What’s unique about this ETF is that it uses covered calls to protect against downside risk. This being said, the covered call strategy provides limited downside protection. Also, when you write a covered call, you give up some of the stock’s potential gains. These ETFs will tend to have a higher yield and a lower performance.
Holdings
Weight (%)
Name
4.88%
VOLKSWAGEN AG PFD
3.97%
ALLIANZ SE
3.94%
SIEMENS AG
3.91%
UNILEVER PLC
3.89%
NESTLE SA
3.84%
BASF SE
3.84%
TOTAL SE
3.66%
ZURICH INSURANCE GROUP AG
3.62%
ENEL SPA
3.46%
SANOFI
Geographic allocation
Countries
Weight
Switzerland
23.64%
Germany
22.91%
United Kingdom
19.48%
France
17.10%
Other (multiple countries)
16.87%
Sector allocation
Type
Fund
Information Technology
6.30
Industrials
12.26
Consumer Discretionary
10.13
Health Care
16.82
Financials
14.63
Materials
10.56
Communication
8.08
Energy
4.32
Utilities
3.58
Issuers’ website as of Feb 26th 2021
ZWE – BMO Europe High Div CC CAD Hedge ETF
The BMO Europe High Dividend Covered Call ETF (ZWP) has been designed to provide exposure to a dividend focused portfolio. This ETF is similar to ZWP – BMO Europe High Div Cov Call ETF. The only additional feature ZWE has is the fact that it’s Canadian hedged to reduce exchange risk.
Holdings
Weight (%)
Name
Bloomberg Ticker
99.83%
BMO EUROPE HIGH DIVIDEND COVERED CALL ETF
ZWP
0.17%
CASH
–
Issuers’ website
For geographic allocation and Sector allocation, please see ZWP – BMO Europe High Div Cov Call ETF.
ZDI – BMO International Dividend ETF
The BMO International Dividend ETF (ZDI) has been designed to provide exposure to a yield weighted portfolio of dividend equities domiciled in international developed markets (outside North America).
Criteria used to select dividend paying stocks:
three-year dividend growth rate
yield
payout ratio
Holdings
Weight (%)
Name
2.57%
ALLIANZ SE
2.50%
SANOFI
2.50%
NESTLE SA
2.48%
ENEL SPA
2.48%
UNILEVER PLC
2.47%
TOYOTA MOTOR CORP
2.46%
ROCHE HOLDING AG
2.46%
TOTAL SE
2.44%
GLAXOSMITHKLINE PLC
2.42%
RIO TINTO PLC
Issuers’ website
Geographic allocation
Countries
Weight
Japan
17.58%
Germany
16.15%
United Kingdom
13.31%
France
12.18%
Switzerland
11.90%
Other (multiple countries)
28.88%
Sector allocation
Type
Weight (%)
Information Technology
2.99
Industrials
11.78
Consumer Discretionary
7.26
Consumer staples
11.98
Health Care
14.56
Financials
15.53
Materials
13.15
Communication
8.80
Energy
3.06
Utilities
8.31
Issuers’ website as of Feb 26th 2021
RID – RBC Quant EAFE Dividend Leaders ETF
RID seeks to provide unitholders with exposure to the performance of a diversified portfolio of high-quality dividend-paying equity securities in markets in Europe, Australasia and the Far East (EAFE) that will provide regular income and that have the potential for long-term capital growth.
Holdings
Holdings
Assets
ROCHE HOLDING AG
3.2%
KONE OYJ
2.7%
KUEHNE + NAGEL INTERNATIONAL AG
2.6%
ALLIANZ SE
2.1%
JAPAN TOBACCO INC
2.0%
OBAYASHI CORP
1.9%
ASML HOLDING NV
1.6%
DAIMLER AG
1.5%
NINTENDO CO LTD
1.4%
INDUSTRIA DE DISENO TEXTIL SA
1.4%
Geographic allocation
Countries
Weight
Japan
27.1%
Germany
10.2%
United Kingdom
12.4%
Australia
7.5%
France
6.4%
Spain
5.7%
Other (multiple countries)
30.7%
as of March 31st
Sector allocation
Type
Weight (%)
Information Technology
6.9
Industrials
14.70
Consumer Discretionary
12.3
Consumer staples
10.9
Health Care
10.4
Financials
18.30
Materials
7.0
Communication
8.7
Energy
2.5
Utilities
5.1
Issuers’ website as of March 31st
Disclaimer
The data on this website is for your information only. It does not constitute investment advice, or advice on tax or legal matters. Any information provided on this website does not constitute investment advice or investment recommendation nor does it constitute an offer to buy or sell or a solicitation of an offer to buy or sell shares or units in any of the investment funds or other financial instruments described on this website. Should you have any doubts about the meaning of the information provided herein, please contact your financial advisor or any other independent professional advisor.
What is behavioral finance
Behavioral finance is relatively a new field in the academic world of Finance. In a nutshell, it’s a combination of psychology and conventional economics. Research in this new field have contributed greatly in understanding retail investors’ behavior and its impact on market efficiency. If you are a retail investor, it’s probably the theory you should most understand and apply before making investments decisions. The good news is there is no complicated formulas here! Just common sense and principles we tend to overlook.
How emotions ruined my first investments’ plan
My initial plan
I remember the first time I had 5,000 $ to invest. I started by putting forward a plan to diversify my investments. I chose 50% fixed income and 40% equities. And, I made a decision to put a 10% of my investments in risky assets. To find this risky asset, I used google search and started randomly reading articles.
Poor research lead to poor decisions
Then, the idea to invest in a Natural Gas ETF came about. After just half an hour of research, Natural gas seemed like the best next move I could ever make! Why? It took me just a look at one graph describing the relationship between Oil and Natural Gas since the 1930’s. According to the author of the graph, the ratio was always almost 1/10. He was arguing you can’t have oil trading at 100$ a barrel (at that time) and Natural Gaz lingering below 3$. Natural Gaz was undervalued and should be at 10$. It just didn’t make sense according to him. He concluded every investor should rush and invest in Natural Gaz. Boy, the article was intentionally deceiving and omitted serval other factors that determine Natural Gaz price. For me, however, at that time, it made all the sense of the world.
Greed
I was checking my investments everyday. Most of my portfolio wasn’t moving much with the exception of the Natural Gas ETF that I have picked which was soaring by 5% on a daily basis. I have to insist ‘I have picked’. Without knowing I became attached to this single investment decision. It kind of made me proud!
Soon later, I decided to change my plans. I invested 80% of the 5,000 $ in the Natural Gas ETF. Why? Just out of greed. I felt it’s the right thing to do! After all, the past weeks have showed me I was a genius!
3 weeks later, after my ETF had gone up 30%, it started dropping rather quickly. Did I sell? Off course, No way. I was proud of my move. This sudden dip wouldn’t scare me. Did I research why Natural Gaz was losing ground? Obviously No. I was confident that my investment will pick up!
Refusal to admit my mistake
A week later, I realized I lost 2,000 $ just because of that ETF. What shocked me is I was still convinced it would go up. I had hope in my heart and it gave me confidence to carry on. I started watching BNN and reading every article that talks about Natural Gas to get some information that can back me up in my denial.
2 months later, I was watching a guest at a BNN program. The guest was asked about Natural Gaz prospects and how many investors believe it would go up! The guest seemed really frustrated by the question and the premise of Natural Gaz going up. He answered there is no way. There is ample supply because of a new technology called fracking. This technology allowed supply to go to levels unseen before, while the demand did not change at all. He concluded there is basically not a single evidence pointing otherwise.
2 seconds later, I had sold my Natural Gas ETF at a loss of over 65% of the amount invested. It really served as a lesson. And, it was a relief getting over this investment ☹
How understanding behavioral finance would have helped me?
Behavioural finance help us understand our bias. Researchers identified four of those:
Overconfidence
As retail investors, we are all overconfident. It’s by far the most common bias! After all, a retail investor relies on himself to make an investment decision. It’s hard to question our own research and be the judge on our own analysis.
My advice is to change our attitude and develop a disciplined methodology.
Our research should be only from a trusted source! We should give more credit to information from serious sources and less to unverified sources;
We should make sure to cover the topic we are investigating from all sides. If I am contemplating investing in a commodity for instance, I need to understand the supply of it and the demand. I should also look at what could shake up the status quo (new technologies or any major structural change in the short term).
Reducing regret
We all have done this. We get attached to a lousy investment. We can’t admit it was a mistake. As my former university professor described this, it’s like refusing to concede that your girlfriend dumped you, so you spend months next to the phone awaiting her phone call.
As humans, we try to avoid the feeling of regret. And this behavior can be costly in the world of investing. Let’s say you picked a value stock. You did your research and was convinced it’s the right move. Soon later, you realize this company is struggling and can’t deliver the outcome you are hoping. Moreover, the price of its shares start falling. Instead, of re-assessing your research and admitting it was not a good choice, you keep hoping it will comeback. Your hope is solely nourished by the fact that you can’t admit the reality. Consequently, instead of accepting a small loss and turning the page, you stay long and lose more money.
Limited Attention Span
We live in the age where distraction is everywhere. Media and social networks magnify news surrounding certain stocks or investment opportunities and thus condition us to act on these information bubbles. Psychologist Herbet Simon calls this ‘Bounded rationality’. As humans we want to reach decisions based on the limited knowledge we accumulate. Most of this knowledge is from specific pieces of news that social networks and media choose to emphasize. Ton of other information goes absolutely under the radar.
The media covers only a small portion of the equity market. We have to dig deeper in our research to find real valuable piece of information. This extra research will help find businesses full of potential and no one is talking about yet! To overcome this bias, we definitely need to diversify our source of information so we don’t limit ourselves to what the main stream media is covering. Finally, don’t let the media noise impact your decisions!
Chasing Trends
Humans love trends! In fact, research show that 39% of all new money committed to mutual funds went into the 10% of funds with the best performance the prior year. We tend to believe pattern will repeat themselves which is not true. In fact, we will end up buying the highs and sometime we enter right when the stock starts retreating.
If a stock has been going up steadily. It means simply that investors identified its potential a long time ago before you noticed. While they reap the fruits of their investments, you are embarking too late to see any profits coming your way.
As Warren Buffet mentioned in his approach: buy when others are fearful and sell when they’re confident.
Conclusion:
We are all guilty to a certain degree for letting these biases decide our financial moves. The best strategy is to have principles in place:
The investment plan where you have determined the allocation that best fit your personality and investments’ objective is a long term plan. You have to stick it. Do not replace your long term plan, with short term trading strategies. Research studies have all shown that retail investors who frequently trade have a much lower performance than buy and hold retail investors who trade far less;
Analyze your investments choices with objectivity. Do not act on feelings or media noise!
Base your decisions mainly on information from valuable sources.
You should have received already your T4A (for benefits issued by the CRA) and/or a T4E (for benefits issued by Service Canada) tax slip in the mail. Residents of Quebec should receive both a T4A and RL-1 slip.
Determine your tax bracket
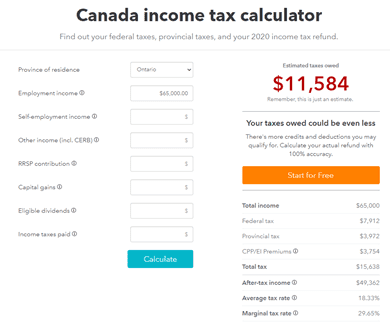
Second, you need to determine your taxable income for 2020 excluding any CERB benefits received. The easiest way is to use an online calculator. I found one on Turbotax website, it will quickly calculate for your Federal and provincial tax. Keep in mind, this is just an estimation (assuming you did not claim any tax credits for 2020).
Start by choosing your province of residence. After, you should enter your income in the appropriate field shown in the website.
For example, if you live in Ontario and your taxable employment income is 65,000 $ excluding any CERB benefits. Then, total amount of taxes due is $11,584.
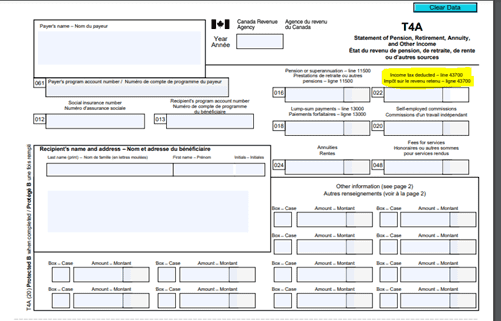
The third step is to determine if any taxes were deducted in your Tax slips.
Rule of thumb: • If you received the CERB or CESB, no tax was withheld when payments were issued. • If you received the CRB, CRSB, or CRCB, 10% tax was withheld at source. This does not mean you will no return a portion. It will depend on your tax rate for 2020. If your tax rate is higher than 10%, then you may have to pay back the difference between your real tax rate and the 10% withheld.
Once you receive your tax slips, you can check if an amount of tax was withdrawn at the source. See below the highlighted field.
How much should I pay back?
The fourth step you to use the calculator to estimate the taxes owing on your income without, and with, the government’s relief benefits — the difference between the two is how much extra money you should set aside for the 2020 tax year.
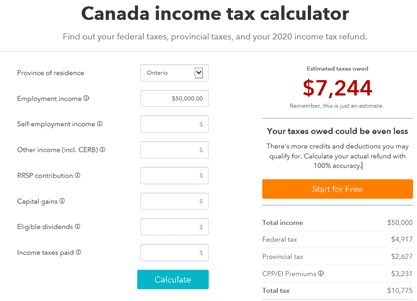
Let’s go through one example: David resides in Ontario and his employment income for 2020 was 50,000$. Because his hours of work were reduced, he had to apply to CERB program. Following his application, he received 10,000$ in CERB support benefits.
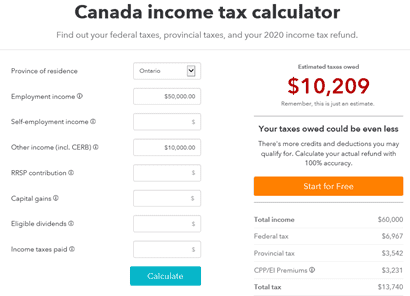
Using the turbotax website, his federal and provincial income taxes for 2020 (excluding CERB) are 7,244 $ (see image A). If we include the CERB payments received, his total taxes becomes 10,209$. David will have to reimburse the difference 2,965 $. The method above provides an estimation only. The calculation does not include any tax credit that David might be entitled to.
Image A
Image B
Will there be any interest charges?
No interest will be charged on related tax debt until April 30, 2022. The government took this decision on February 9th 2021. There is one condition to this rule which is that your income should not exceed 75,000$ in 2020.
Make sure to file on time your taxes otherwise you will be charged a 5% penalty and 1% for every full month past the deadline (to a maximum of 12 months).
Recommendation: use your tax credits to reduce the amount due!
if you have any amount due because you received CERB relief payment, you have to make sure to apply all the credits you are entitled too. This can help reduce the amount due.
here’s some credits that you can apply to:
Medical Expenses: you can claim medical expenses such as Medical costs incurrent during a Travel abroad, Dental care or medical supplies. It’s important to mention, you can only claim expenses that you have not been reimbursed for.
Childcare Expenses: you can claim expenses paid to caregivers, daycare centers, day camps…etc. These childcare expenses should be claimed only if it allowed you to gain employment income, carry on a business either alone or as an active partner or attend school/pursue academic research under certain conditions.
Work From Home Expenses: This a new tax credit. You have two options:
Simplified method: allows you to claim a maximum of 400$ tax credit if you worked from home 200 business days last year (rate of: 2$ per day). You have to fill out T777S form;
Detailed method: allows to claim more than the 400$ tax credit. However, you will have to provide more documention and proof. In addition to the T777S, you’ll need a T2200S form signed by your employer which certifies that you worked from home due to the pandemic. You’ll also need the receipts for all of your expenses.
Tuition: Fees paid by you to a post-secondary educational institution in Canada.
RRSP contributions: any amount contributed to an RRSP will reduce your taxable income. Consult your notice of assessment to know if you have any carry over contribution room.
Updated: May 18th 2021: Travel reward programs offered by Canadian credit cards issuers are very competitive. To help you find the card that can get you to your dream destination faster, we have gathered all the info your need to know in the list below.
American Express Cobalt
• 5X POINTS On eats & drinks Such as eligible restaurants or food delivery in Canada • 2X POINTS On travel & transit From eligible ride shares in Canada to a weekend getaway • 1X POINTS On everything else From streaming services to online shopping, and more
You can use the points to purchase gift cards, merchandise, purchases made at Amazon.ca or travel.
Annual fee 120$
Scotiabank Gold American Express
Earn 5x POINTS on eligible grocery stores, restaurants, fast food, and drinking establishments. Includes popular food delivery, food subscriptions and Includes movies, theatre, and ticket agencies. Earn 3x POINTS on eligible gas and daily transit. Includes rideshare, buses, taxis, subway and select streaming services. Earn 1x POINTS everything else
Annual fee 120$
MBNA Rewards Platinum Plus
Earn 2x points for every $1 spent on eligible gas, grocery and restaurant purchases thereafter ($5,000 annual cap on each category) Earn 1x point for every dollar spent on all other eligible purchases‡ Flexible rewards: Redeem your points for travel, cash back, and more