The Hamilton Technology Yield Maximizer ETF, commonly known as QMAX ETF, presents a compelling investment opportunity, especially for those looking to diversify their portfolio with a focus on technology equities. This QMAX ETF review aims to provide a comprehensive overview of its investment objectives, highlights, and suitability for investors, emphasizing its unique strategy and potential benefits.
Executive summary
Feature
Hamilton Technology Yield Maximizer ETF (QMAX)
Fund Overview
ETF focusing on technology stocks with a strategy to provide growth and income through dividends and a covered call strategy.
Investment Strategy
Invests in the 15 largest U.S. tech companies equally, while employing an active covered call strategy on approximately 30% of the portfolio.
Provides diversification by equally investing in major tech companies, avoiding overconcentration in a single stock.
Active Covered Call Strategy
Aims to enhance income and reduce volatility; involves selling call options on a portion of the portfolio.
Growth Potential
Although focusing on income, approximately 70% of the portfolio is unhedged, allowing significant growth potential from the tech sector.
Management Experience
Managed by a team with notable experience in managing covered call ETFs, adding a level of expertise in option strategies.
Risks
Includes capped upside potential due to call options, complexity in management, market volatility, and performance dependency on underlying stocks.
MER (Fees)
Not yet published; an important factor to consider as it will impact the overall performance and cost-effectiveness of the investment.
My Take on QMAX.TO
I find the Hamilton Technology Yield Maximizer ETF (QMAX-T) to be a compelling option for certain investors. Here’s why:
Balanced Option Strategy: The fund’s strategy of using covered calls on 30% of its portfolio strikes a reasonable balance. It aims to secure high dividend income without significantly compromising growth potential. With 70% of the portfolio unhedged, investors can still largely benefit from the robust growth potential of the tech industry.
Growth and Income Potential: The tech sector witnessed a dynamic growth. QMAX-T allows investors to tap into this growth while simultaneously receiving monthly income. This dual benefit can be particularly attractive in a diversified investment portfolio.
Experienced Management: Managers of the fund have a great experience with managing covered call ETFs. This adds a layer of confidence. Experienced management can be crucial in navigating the complexities of option strategies and making informed decisions that align with market conditions.
Diversification Benefits: With its equal-weight exposure to the 15 largest U.S. tech companies, the fund offers a well-diversified approach within the tech sector. This can help mitigate risks associated with overconcentration in a few stocks.
What is QMAX ETF?
The Hamilton Technology Yield Maximizer ETF is an Exchange-Traded Fund (ETF) that primarily focuses on technology stocks. Unlike traditional tech ETFs, QMAX-T aims to provide not just growth but also income. It does this through a strategy that involves investing in technology companies with potential for high dividend yields.
How Does QMAX ETF Work?
QMAX-T employs a strategy combining stock selection and options. The fund invests in selected technology stocks, which are expected to have stable or growing dividends. Additionally, it uses an options strategy, known as a “covered call,” to generate extra income. This involves selling call options on stocks it holds, which can provide income in addition to dividends.
QMAX Highlights
Monthly Distributions: QMAX-T provides monthly income, which can be attractive for investors seeking regular cash flow.
Equal-Weight Exposure: The fund invests equally in the 15 largest tech companies in the U.S. This equal-weight strategy avoids overconcentration in any single company, promoting diversification within the tech sector.
Active Covered Call Strategy: To enhance monthly income and potentially reduce volatility, QMAX-T actively employs a covered call strategy.
Coverage Ratio: Approximately 30% of the portfolio is involved in the covered call strategy, aiming to balance income generation with maintaining about 70% growth potential.
Understanding the Risks in Active Call Option Strategy
While the active covered call strategy can enhance income and reduce volatility, it’s crucial to understand the inherent risks:
Capped Upside Potential: When a call option is sold on a stock, the upside is capped. If the stock’s price rises significantly, the ETF only benefits up to the strike price of the call option.
Complexity and Management Risk: Active management of options requires skill and timing. Poor management decisions can lead to suboptimal outcomes.
Market Risk: Despite the strategy aiming to reduce volatility, tech stocks can be inherently volatile. The market risks are still present.
Dependence on Stock Performance: The effectiveness of the covered call strategy partly depends on the underlying stock’s performance. If the stocks in the portfolio perform poorly, the strategy may not generate expected income.
Why Consider QMAX ETF?
Income and Growth: For investors looking for exposure to the technology sector with the added benefit of income, QMAX-T can be attractive.
Diversification: Investing in a range of technology companies can help diversify a portfolio.
Professional Management: The ETF is managed by professionals who select stocks and manage the options strategy.
Things to Keep in Mind
Risk Profile: Like any investment in the stock market, QMAX-T comes with risks, including market volatility, especially in the tech sector.
Fees: ETFs have management fees, so it’s important to consider these costs.
Income vs. Total Return: The focus on income might mean lower potential for capital growth compared to other tech ETFs.
How QMAX is able to deliver a 13% target yield?
the QMAX ETF distinguishes itself through its use of at-the-money (ATM) options, as opposed to the more commonly used out-of-the-money (OTM) options by many competing funds. This choice of ATM options is a strategic one, as they typically offer higher premiums compared to OTM options. The premium, which is the income received by the ETF from selling these options, is a critical component of the fund’s overall return. The strategy is applied to 30% of the portfolio.
ATM options are sold with a strike price very close to the current market price of the underlying asset. This proximity to the market price means that these options are more likely to be exercised, but it also means they command a higher premium due to their higher intrinsic value. In contrast, OTM options have a strike price that is further away from the current market price, making them less likely to be exercised. While this reduces the risk of the underlying assets being called away, it also results in lower premium income.
By opting for ATM options, QMAX aims to strike a balance between generating higher income through premiums and managing the risk of the options being exercised. This strategy is integral to the ETF’s goal of providing higher income streams to its investors, making it a distinctive feature in its approach to income generation and risk management within the technology sector.
This post aims to provide an educational overview of QMAX-T for Canadian investors. Remember, it’s important to do your own research and consult with a financial advisor for personalized advice.
The SMAX Hamilton U.S. Equity Yield Maximizer ETF presents an interesting option for those interested in the U.S. equity market, especially with a focus on income. Let’s explore its key aspects.
Executive summary
Feature
Description
Large-Cap U.S. Equity Focus
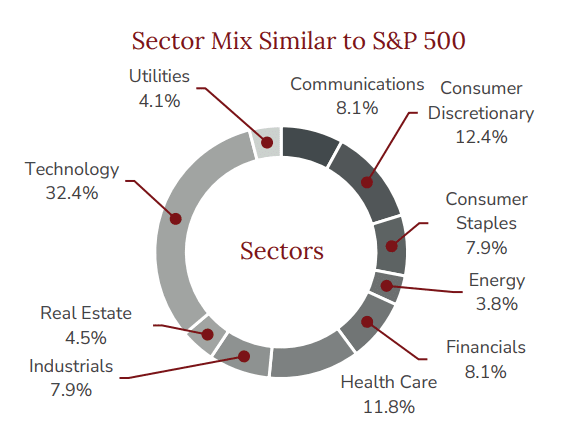
Invests in large-cap U.S. stocks to mirror the sector distribution of the S&P 500, offering diversified exposure.
Managed by Nick Piquard with over 25 years in options; involves holding stocks and selling call options.
Coverage Ratio
Maintains a coverage ratio of about 30%, intending to enhance monthly income while preserving 70% growth potential.
No Leverage Utilization
Avoids using leverage in its investment strategy, potentially appealing to risk-averse investors.
SMAX ETF
Investment Objective SMAX ETF
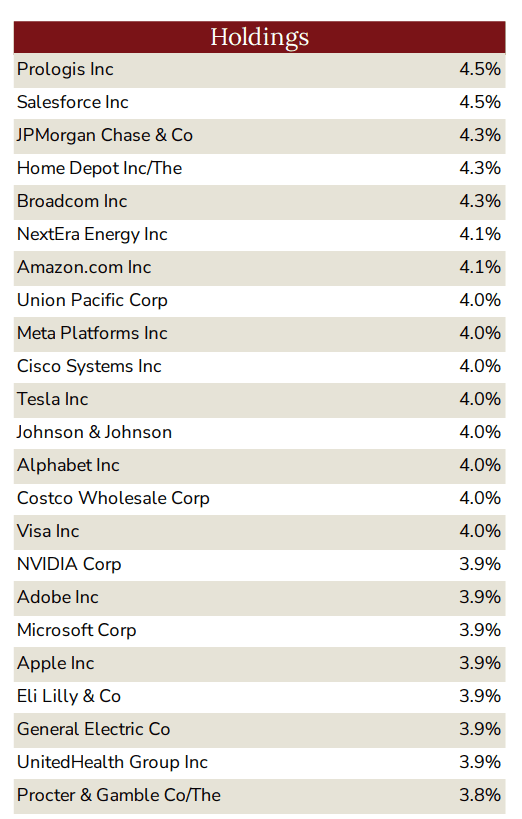
SMAX aims to provide investors with a portfolio primarily consisting of large-cap U.S. equity securities. Its key characteristics include:
The SMAX Hamilton U.S. Equity Yield Maximizer ETF offers an investment approach centered around large-cap U.S. stocks. Its strategy is to replicate the sector distribution seen in the S&P 500. This approach aims to provide investors with diversified exposure to the U.S. equity market. By focusing on large-cap stocks, SMAX targets well-established companies that are significant players in their respective industries. This can offer a balance between stability and growth potential within the U.S. equity space.
A distinctive feature of SMAX is its active covered call strategy. This strategy is managed by Nick Piquard, a seasoned professional with over 25 years of experience in options trading. The active covered call strategy involves holding a stock while simultaneously selling call options on the same stock. This can potentially increase the dividend income from the investments. The call options provide an additional income stream, typically in the form of premiums paid by the option buyers. This strategy can be particularly appealing to investors looking for enhanced income along with their equity investments.
Regarding its coverage ratio and growth potential, SMAX maintains a coverage ratio of approximately 30%. This means that the ETF writes covered calls on about 30% of its portfolio. The intent behind this ratio is to strike a balance between income generation and growth potential. By limiting the coverage to 30%, the ETF aims to enhance its monthly income while allowing approximately 70% of the portfolio the potential for capital growth. This balance is key for investors who are seeking income but do not want to entirely forego growth opportunities.
Finally, an important aspect of SMAX is its approach to leverage. The ETF does not use leverage in its investment strategy. This is a crucial consideration for investors who are cautious about the risks associated with leverage. By avoiding leverage, SMAX positions itself as a potentially lower-risk option compared to leveraged investment vehicles. This could make it an attractive choice for risk-averse investors who are keen on U.S. equity exposure but wish to minimize exposure to leveraged risk.
In summary, the SMAX ETF offers a unique combination of large-cap U.S. equity exposure, an active covered call strategy for income enhancement, a balanced approach to growth potential, and a no-leverage policy, catering to a diverse range of investor preferences in the U.S. stock market.
Who Might Consider SMAX ETF?
SMAX could be a fit for:
Investors seeking monthly income through dividends.
Those looking for exposure to large-cap U.S. equities with a sector composition similar to the S&P 500.
Investors comfortable with the use of an options strategy (covered calls) for income generation.
Understanding the Risks in Active Call Option Strategy
While the active covered call strategy can enhance income and reduce volatility, it’s crucial to understand the inherent risks:
Capped Upside Potential: When a call option is sold on a stock, the upside is capped. If the stock’s price rises significantly, the ETF only benefits up to the strike price of the call option.
Complexity and Management Risk: Active management of options requires skill and timing. Poor management decisions can lead to suboptimal outcomes.
Market Risk: Despite the strategy aiming to reduce volatility, tech stocks can be inherently volatile. The market risks are still present.
Dependence on Stock Performance: The effectiveness of the covered call strategy partly depends on the underlying stock’s performance. If the stocks in the portfolio perform poorly, the strategy may not generate expected income.
This post aims to provide an educational overview of SMAX.TO for Canadian investors. Remember, it’s important to do your own research and consult with a financial advisor for personalized advice.
Bonjour, chers investisseurs! Today, we’re exploring the Vanguard Total Stock Market ETF, commonly known as VTI. This ETF is a popular choice among investors, but what exactly is it, and why should you, as a Canadian investor, consider it? Let’s break it down.
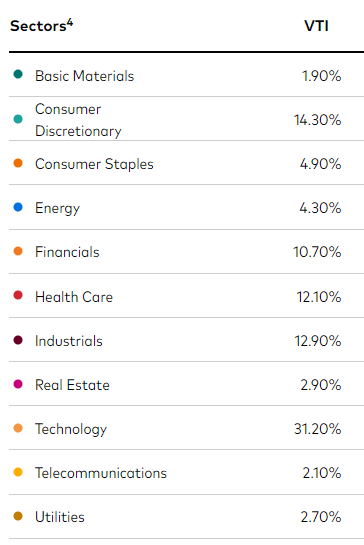
VTI is an Exchange-Traded Fund (ETF) that tracks the performance of the CRSP US Total Market Index. It’s managed by Vanguard, a well-known investment management company. The key features of VTI include:
Diversification:
The Vanguard Total Stock Market ETF, or VTI, is a great way to gain exposure to the entire U.S. stock market. What makes it special? It includes a wide range of stocks, from large-cap to mid-cap and even small-cap stocks. This means you’re not just investing in big, well-known companies, but also in smaller, potentially fast-growing ones. Diversification is like not putting all your eggs in one basket, and VTI does this well by spreading your investment across different company sizes.
Low-Cost:
Cost matters in investing. VTI stands out for its low expense ratio. This means it costs less to own compared to many other investment options. A lower expense ratio can have a big impact on your investment returns over time, making VTI an economical choice for investors.
Liquidity:
Now, let’s talk about liquidity. VTI is an ETF, which means it trades on the stock market just like any regular stock. Why is this good for you? It’s simple to buy and sell shares of VTI whenever the market is open. This ease of trading, or liquidity, is a big advantage, especially if you need to adjust your investments quickly.
Why Consider VTI as a Canadian Investor?
U.S. Market Exposure: The U.S. stock market is one of the world’s largest and most dynamic. VTI lets you tap into this market.
Diversification Benefits: Adding VTI to your portfolio can reduce risk. It helps in spreading investments across different sectors and companies.
Tax Efficiency: For Canadian investors, holding U.S. ETFs like VTI in specific accounts (like RRSP) can be tax-efficient due to tax treaties between Canada and the U.S.
Historical performance updated daily – VTI ETF for Canadian investors
VTI Holdings
Ticker
Holdings
% of fund
AAPL
Apple Inc.
6.35 %
MSFT
Microsoft Corp.
6.34 %
AMZN
Amazon.com Inc.
3.05 %
NVDA
NVIDIA Corp.
2.47 %
GOOGL
Alphabet Inc. Class A
1.77 %
META
Facebook Inc. Class A
1.64 %
GOOG
Alphabet Inc. Class C
1.49 %
TSLA
Tesla Inc.
1.46 %
BRK.B
Berkshire Hathaway Inc. Class B
1.45 %
VTI Holdings – VTI ETF for Canadian investors
Things to Keep in Mind
Currency Risk:
One critical aspect to consider with VTI is the currency risk. Since VTI is denominated in U.S. dollars, the value of your investment can be affected by changes in the exchange rate between the Canadian dollar (CAD) and the U.S. dollar (USD). This means if the CAD weakens against the USD, your investment in VTI could be worth more in CAD terms, and vice versa. It’s essential to be mindful of this currency dynamic, as it can impact your overall returns.
Tax Implications:
Another key factor to consider is the tax implications. Holding U.S. ETFs like VTI in accounts other than Registered Retirement Savings Plans (RRSPs) can have different tax consequences. In non-RRSP accounts, you might face withholding taxes on dividends from U.S. stocks. Understanding these tax nuances is crucial in making an informed investment decision. It’s always a good idea to consult with a tax professional to understand how these factors apply to your individual situation.
Long-Term Perspective:
Lastly, it’s important to recognize that ETFs like VTI are generally more suitable for long-term investing. Why? Because investing in the stock market involves volatility, and the value of your investments can fluctuate in the short term. By adopting a long-term perspective, you’re better positioned to ride out market fluctuations and benefit from the potential growth over time. This approach is especially relevant for a broad market ETF like VTI, which is designed to reflect the performance of the entire U.S. stock market.
How to Buy VTI in Canada?
You can purchase VTI through a brokerage account (Such as Questrade, Wealthsimple and CIBC Investors’ Edge…etc). Many Canadian brokerages offer access to U.S. markets. Remember to consider transaction fees and the exchange rate when buying.
Conclusion
VTI is a solid choice for those looking to diversify into the U.S. market. However, it’s crucial to consider your investment goals and understand the risks involved. Always do your due diligence before investing.
I hope this guide helps you understand VTI better. Remember, investing is a journey, and staying informed is key. Happy investing!
Introduction
As Canadian investors navigate the complexities of retirement planning, the importance of a well-structured RRSPETF Portfolio Strategy becomes increasingly apparent. A Registered Retirement Savings Plan (RRSP) is not just a tax-advantaged savings vehicle; it’s a powerful tool for building wealth over the long term. In this context, Exchange-Traded Funds (ETFs) emerge as a versatile and efficient component for any RRSP.
This article delves into the intricacies of crafting a robust RRSP portfolio using ETFs. We’ll explore why ETFs are an optimal choice for RRSPs, how to select the right mix of ETFs to meet diverse financial goals, and the strategic considerations for maintaining a balanced portfolio. Whether you’re a seasoned investor or just starting out, understanding the dynamics of an RRSP ETF portfolio strategy is pivotal.
RRSP ETF Portfolio Strategy
Introduction to Exchange-Traded Funds (ETFs)
Exchange-Traded Funds (ETFs) are investment funds traded on stock exchanges, much like stocks. They hold assets such as stocks, commodities, or bonds, and generally operate with an arbitrage mechanism designed to keep the trading close to its net asset value, although deviations can occasionally occur. ETFs combine the diversification of mutual funds with the ease of trading of individual stocks. This unique blend makes them highly attractive for a variety of investors.
Benefits of Including ETFs in Long-Term Investment Strategies
One of the primary benefits of including ETFs in a long-term investment strategy is this diversification. By investing in an ETF, you’re essentially buying a basket of assets. This can range from a broad market index to a specific industry sector. This diversification helps spread risk. For instance, if one stock in the ETF performs poorly, it’s buffered by the others, mitigating overall portfolio loss.
Moreover, ETFs offer flexibility and ease of trading. They can be bought and sold during trading hours at market price, unlike mutual funds which are traded once a day after the market closes. This allows for more dynamic portfolio management. Additionally, many ETFs have lower expense ratios compared to traditional mutual funds, making them a cost-effective option for long-term investment.
Diversification as a Key Aspect of Risk Management
In the context of risk management, diversification through ETFs can play a pivotal role. It’s a fundamental investment strategy that helps in smoothing out the market volatility over time. By allocating investments across various asset classes and geographies, ETFs can significantly lower the risk of major losses, paving the way for more stable and potentially consistent returns over the long term.
Criteria for Selecting ETFs for an RRSP
When selecting Exchange-Traded Funds (ETFs) for a Registered Retirement Savings Plan (RRSP), Canadian investors must consider several key criteria to ensure their portfolio aligns with their long-term financial goals. Understanding these factors is crucial for building a robust investment strategy that balances growth potential with risk management.
Diversification Across Asset Classes and Regions:
The first criterion is diversification. A well-diversified ETF portfolio should include a mix of asset classes such as equities, bonds, and potentially other securities like real estate or commodities. Additionally, geographical diversification is vital. Investing in both domestic and international ETFs exposes investors to different economies and sectors, mitigating the risk associated with any single market.
Expense Ratios and Fees:
The cost of investing in ETFs, primarily through management expense ratios (MERs), is a critical factor. Lower MERs translate to more of your investment working for you, particularly important in a long-term strategy like RRSP where fees can significantly impact compounded returns over time. Comparing the MERs of similar ETFs can lead to substantial savings.
Tracking Error and Index Alignment:
ETFs typically track specific indices, and it’s crucial to understand how well an ETF replicates its underlying index – known as tracking error. A lower tracking error means the ETF closely follows the performance of the index, which is desirable. Also, ensure the index itself aligns with your investment strategy and goals.
Liquidity:
Liquidity refers to how easily shares of the ETF can be bought and sold in the market without impacting the price. Highly liquid ETFs are preferable as they allow for easier portfolio adjustments and reduce the risk of being unable to sell shares in volatile markets.
Performance History and Fund Size:
While past performance is not indicative of future results, examining an ETF’s historical performance offers insights into how it has managed different market conditions. Additionally, larger funds typically offer more stability and efficiency due to their scale.
Tax Considerations:
Finally, within an RRSP, it’s essential to consider the tax implications of the ETFs you choose. Focus on funds that are tax-efficient and align with the tax-advantaged nature of RRSPs.
In summary, selecting ETFs for an RRSP involves a careful evaluation of diversification, costs, tracking accuracy, liquidity, historical performance, and tax efficiency. Balancing these factors can help Canadian investors build a resilient, growth-oriented portfolio for their retirement savings.
Canadian Equity ETFs: Essential for a Balanced Portfolio
Including Canadian equity ETFs in a balanced portfolio is crucial for investors, particularly those in Canada. These ETFs offer direct exposure to the Canadian economy’s growth and diversification benefits, making them a strategic choice in any investment portfolio. Canada’s unique market dynamics, dominated by sectors like financials, energy, and materials, provide a distinct investment landscape that Canadian equity ETFs capture effectively.
The Significance of Canadian Equities in Portfolio Diversification:
Investing in Canadian equities offers an opportunity to diversify into a market known for its strong natural resources and financial sectors. This diversification is particularly beneficial for Canadian investors, as it aligns with the economic strengths of their own country and reduces exposure to currency exchange risks. Additionally, the local market offers potential tax efficiencies, especially in accounts like RRSPs where Canadian dividends receive favorable tax treatment.
Key Canadian Equity ETFs: XIC, XIU, and HXT
iShares Core S&P/TSX Capped Composite Index ETF (XIC): XIC tracks the S&P/TSX Capped Composite Index, representing a broad spectrum of the largest companies on the TSX. It’s known for its comprehensive market coverage and low expense ratio.
iShares S&P/TSX 60 Index ETF (XIU): XIU focuses on the 60 largest companies in the Canadian market, as represented by the S&P/TSX 60 Index. This ETF is suitable for investors looking for exposure to major Canadian blue-chip companies.
Horizons S&P/TSX 60 Index ETF (HXT): HXT offers exposure to the same large-cap segment of the Canadian market as XIU but with a unique structure that aims to reduce tax liabilities on distributions, making it an attractive option for tax-conscious investors.
Advantages of Investing in Canadian Equity ETFs:
These ETFs provide a way to invest in a wide range of Canadian companies, reducing the risk associated with individual stock investments. They also allow investors to benefit from the overall growth of the Canadian economy. Given their different focuses, XIC, XIU, and HXT cater to various investment strategies and preferences, offering choices for diversification within the Canadian equity space.
A Long-Term View for RRSP Investors:
For RRSP holders, these ETFs offer a long-term investment opportunity. While the Canadian market may experience short-term volatility, the long-term growth perspective of equity markets and the stability offered by top companies in these ETFs can contribute to a solid retirement savings plan.
In summary, Canadian equity ETFs like XIC, XIU, and HXT are indispensable for achieving a balanced and diversified investment portfolio. They offer a mix of broad market exposure and specific sector focus, which is crucial for investors looking to leverage the growth potential of the Canadian economy within their RRSPs.
U.S. Equity ETFs
Investing in U.S. equity ETFs is a strategic move for Canadian investors looking to diversify their portfolio internationally. The U.S. stock market, being the largest and most liquid in the world, hosts some of the biggest and most influential companies globally. Exposure to U.S. equities through ETFs can provide growth opportunities and a hedge against domestic market volatility.
The Importance of U.S. Market Exposure:
The U.S. market is known for its diversity, with companies from technology, healthcare, consumer goods, and other sectors. This diversification is crucial for reducing country-specific risks and enhancing potential returns. Moreover, many U.S. companies are global leaders, making them essential for a well-rounded investment portfolio.
Popular U.S. Equity ETF Options:
ETFs like the Vanguard S&P 500 ETF (VOO) and the iShares Core S&P 500 ETF (IVV) offer exposure to the S&P 500, an index of the 500 largest U.S. companies. These funds provide a balance of stability and growth potential, with a history of solid long-term returns.
Benefits of Including U.S. Equity ETFs in an RRSP:
For Canadian investors, U.S. equity ETFs provide an opportunity to diversify outside of Canada’s relatively smaller market. The U.S. market’s potential for growth and innovation can complement the more resource and financial-sector-heavy Canadian market. Additionally, investing in U.S. ETFs in an RRSP can be tax-efficient, as foreign withholding taxes on dividends can potentially be recovered.
In conclusion, U.S. equity ETFs are a fundamental part of a diversified investment portfolio for Canadian investors. They offer access to a broad range of sectors and some of the most dynamic companies in the world, making them an ideal choice for growth-oriented investors.
VII. International Equity ETFs
International equity ETFs provide Canadian investors with crucial exposure to global markets, offering diversification benefits beyond North American equities. These ETFs typically invest in a wide array of countries across developed and emerging markets, giving investors access to a variety of economic sectors and geographical areas.
Diversification through International Exposure:
International equity ETFs extend an investor’s reach into different economic and geopolitical environments, which can lead to reduced volatility and risk in the portfolio. This is particularly important for Canadian investors, whose home market is heavily concentrated in certain sectors like natural resources and financials.
Examples of International Equity ETFs:
ETFs like the Vanguard FTSE Developed Markets ETF (VEA) and the iShares MSCI EAFE ETF (EFA) offer exposure to developed markets outside of North America. These ETFs encompass Europe, Asia, and Australia, providing a well-rounded international exposure. For those looking to venture into emerging markets, ETFs like the iShares MSCI Emerging Markets ETF (EEM) are available.
Role in a Balanced Portfolio:
Inclusion of international equity ETFs in an RRSP adds a layer of diversification that can lead to more stable long-term returns. These ETFs allow investors to participate in the growth of global economies, which may follow different cycles than the Canadian and U.S. markets. This can provide a cushion against regional downturns and offer potential for higher growth in emerging markets.
In summary, international equity ETFs are a key component in building a well-diversified investment portfolio for Canadian RRSP holders. They offer exposure to a wide range of global markets and sectors, helping to mitigate risks associated with concentrating investments in a single country or region.
Fixed Income ETFs
Fixed income ETFs play an essential role in balancing and stabilizing an investment portfolio, especially for those in a retirement savings plan like an RRSP. These ETFs invest in bonds and other debt instruments, providing a steady income stream and lower volatility compared to equity ETFs.
Stability and Income Generation:
Fixed income ETFs are known for their ability to provide stability in a portfolio. Bonds and other fixed income securities typically have lower risk profiles than equities. They offer regular interest payments, which can be particularly appealing for investors seeking a steady income stream or those nearing retirement.
Popular Fixed Income ETFs:
Examples of fixed income ETFs include the Vanguard Canadian Aggregate Bond Index ETF (VAB) and the iShares Core Canadian Universe Bond Index ETF (XBB). These ETFs offer exposure to a broad range of Canadian government and corporate bonds, providing a balance of credit quality and yield.
Role in Diversification and Risk Management:
Including fixed income ETFs in an RRSP is a strategy for risk management. These ETFs can reduce the overall volatility of a portfolio, particularly during times of stock market downturns. They provide a counterbalance to equity positions, as bonds and stocks often move inversely to each other.
In conclusion, fixed income ETFs are a critical component of a diversified RRSP portfolio. They offer stability, income generation, , and risk mitigation, making them an ideal choice for investors looking to balance their growth-oriented investments with more conservative fixed income securities.
Global or Multi-Asset ETFs: Comprehensive Investment Solutions
Global or multi-asset ETFs are an increasingly popular choice for investors seeking a diversified and balanced investment portfolio with a single product. These ETFs offer a mix of stocks and bonds from around the world, providing exposure to a wide array of markets and asset classes. This approach simplifies portfolio management while ensuring broad diversification, which is crucial for mitigating risk and achieving stable long-term returns.
The Appeal of Global ETFs:
Global ETFs like VEQT (Vanguard All-Equity ETF Portfolio) and XEQT (iShares Core Equity ETF Portfolio) provide exposure to a diverse range of global stocks. These funds are designed for investors looking for growth through 100% equity exposure, spanning across North American, international, and emerging markets. They are particularly suitable for those with a higher risk tolerance and a longer investment horizon, as they fully capitalize on the growth potential of global equities.
Balanced Approach with Multi-Asset ETFs:
For those seeking a more balanced approach, ETFs like VGRO (Vanguard Growth ETF Portfolio) and XGRO (iShares Core Growth ETF Portfolio) offer a mix of both stocks and bonds. These ETFs maintain a fixed allocation, typically with a higher proportion of equities for growth, complemented by bonds for stability. They are designed to offer a balanced risk-return profile, making them ideal for investors who prefer a middle ground between aggressive and conservative strategies.
Simplified Portfolio Management and Diversification:
One of the biggest advantages of global and multi-asset ETFs is the simplicity they offer. Investors can achieve a well-diversified portfolio across various asset classes and geographies without the need to manage multiple holdings. This not only saves time but also ensures that the portfolio remains balanced and aligned with the investor’s risk tolerance and goals.
In summary, global and multi-asset ETFs like VEQT, XEQT, VGRO, and XGRO provide an efficient and straightforward way for investors to access a diversified mix of global assets. They are particularly valuable for RRSP investors who seek a comprehensive investment solution that balances growth potential with risk mitigation.
Building an RRSP ETF Portfolio Strategy
Creating a balanced ETF portfolio for an RRSP involves combining different types of ETFs in a way that aligns with your investment goals, risk tolerance, and time horizon. Here are some examples of how you can mix Canadian equity, U.S. equity, international equity, and fixed income ETFs to achieve various investment strategies:
A conservative portfolio emphasizes stability and income, suitable for those with a low risk tolerance or nearing retirement. It has a higher allocation in fixed income ETFs to reduce volatility.
Balanced Portfolio RRSP Strategy
ETF Type
Example
Allocation
Canadian Equity ETFs
XIC, XIU
30%
U.S. Equity ETFs
VOO, IVV
30%
International Equity
VEA, EFA
20%
Fixed Income ETFs
VAB, XBB
20%
RRSP ETF Portfolio Strategy
A balanced portfolio offers a mix of growth and stability, suitable for investors with a moderate risk tolerance. It features an equal focus on equities (Canadian, U.S., and international) and fixed income.
Aggressive Portfolio RRSP Strategy
ETF Type
Example
Allocation
Canadian Equity ETFs
XIC, XIU
30%
U.S. Equity ETFs
VOO, IVV
35%
International Equity
VEA, EFA
30%
Fixed Income ETFs
VAB, XBB
5%
RRSP ETF Portfolio Strategy
An aggressive portfolio aims for higher returns and is suitable for investors with a high risk tolerance and a long-term investment horizon. It has a significant allocation in equities with minimal fixed income.
All-Equity Portfolio
ETF Type
Example
Allocation
Canadian Equity ETFs
XIC, XIU
33%
U.S. Equity ETFs
VOO, IVV
33%
International Equity
VEA, EFA
34%
RRSP ETF Portfolio Strategy
An all-equity portfolio is designed for maximum growth potential and is suitable for investors with a very high risk tolerance and a long investment horizon. It is entirely allocated to equities across different regions.
All-in-One ETF Portfolio
An All-in-One ETF is a single fund that provides a diversified portfolio across various asset classes, including Canadian, U.S., and international equities, as well as fixed income. These ETFs are designed to maintain a predetermined balance, automatically rebalancing to stay aligned with their target allocation.
Examples of All-in-One ETFs:
– VGRO (Vanguard Growth ETF Portfolio): A growth-oriented ETF with a mix of approximately 80% equities and 20% bonds.
– XGRO (iShares Core Growth ETF Portfolio): Similar to VGRO, offering a balance of equity and fixed income for growth.
– VEQT (Vanguard All-Equity ETF Portfolio): A 100% equity portfolio for those seeking maximum growth potential.
– XEQT (iShares Core Equity ETF Portfolio): Another 100% equity option, diversified across global markets.
Advantages of an All-in-One ETF Portfolio:
1. Simplicity: With just one ETF, investors can achieve a diversified, balanced portfolio without the need to manage multiple fund allocations.
2. Automatic Rebalancing: These ETFs automatically rebalance to maintain their target asset allocation, reducing the need for ongoing portfolio adjustments.
3. Diversification: Despite being a single ETF, these funds offer broad exposure to a range of asset classes and global markets.
4. Cost-Effective: Generally, all-in-one ETFs have lower fees compared to holding multiple ETFs, making them a cost-efficient choice.
This option is especially appealing for investors who prefer a straightforward, low-maintenance approach to their RRSP investments. It’s also ideal for those new to investing or with limited time to actively manage their portfolio. As always, it’s important to consider individual financial goals and risk tolerance when selecting any investment product.
Sure, here’s a Q&A section based on commonly asked questions about building an ETF portfolio for an RRSP:
Q&A
Q1: What is an RRSP and why is it important for Canadian investors?
A1: An RRSP, or Registered Retirement Savings Plan, is a retirement savings plan that is registered with the Canadian federal government. It allows Canadians to save for retirement on a tax-deferred basis, meaning taxes on earnings are delayed until the money is withdrawn. This can be a powerful tool for long-term savings, as it allows investments to grow tax-free over time.
Q2: Why choose ETFs for an RRSP?
A2: ETFs, or Exchange-Traded Funds, are popular for RRSPs due to their low cost, diversification, and flexibility. They allow investors to buy a basket of stocks or bonds, which helps in spreading risk. Additionally, the low management fees associated with ETFs can significantly enhance long-term returns.
Q3: How do I start building an ETF portfolio for my RRSP?
A3: Start by assessing your risk tolerance and investment goals. Then, choose a mix of Canadian, U.S., and international equity ETFs, along with fixed income ETFs to balance risk and return. You can also opt for all-in-one ETFs for simplicity. Regularly review and rebalance your portfolio to align with your investment strategy.
Q4: What are some recommended ETFs for an RRSP portfolio?
A4: Popular choices include Canadian equity ETFs like XIC and XIU, U.S. equity ETFs like VOO and IVV, international equity ETFs like VEA and EFA, and fixed income ETFs like VAB and XBB. For a one-fund solution, consider all-in-one ETFs like VGRO or XGRO.
Q5: How often should I review and rebalance my RRSP ETF portfolio?
A5: It’s generally recommended to review your portfolio at least annually or after significant market changes. Rebalancing helps in maintaining your desired asset allocation, which can shift over time due to differing performance of various assets.
When it comes to investing in growth stocks through ETFs, the Vanguard Growth ETF (VUG) is a popular choice in the United States. But what if you’re in Canada and looking for a similar investment option? Understanding the Canadian equivalent of VUG is crucial for investors who want to tap into the growth segment of the market.
Executive summary
Question
Answer and Explanation
What Makes VUG Special?
Focuses on U.S. large-cap growth stocks, emphasizing technology (53.4%) and strong diversification.
Is There a Direct Canadian Equivalent?
No, but combining 50% XQQ (tech-focused) and 50% VFV (broad S&P 500 exposure) replicates VUG’s approach.
Why Combine XQQ and VFV?
XQQ reflects VUG’s tech allocation; VFV diversifies into other sectors like healthcare and consumer discretionary.
Currency Hedging Considerations
XQQ is CAD-hedged, reducing currency risk, while VFV is unhedged, introducing USD/CAD fluctuation exposure.
Recommendation
A 50% XQQ and 50% VFV portfolio closely matches VUG’s growth orientation with added diversification and mixed hedging.
Executive Summary: Best Canadian Equivalent of VUG
What Makes VUG Special?
VUG is known for its focus on large-cap growth stocks in the U.S. market. It tracks the performance of the CRSP US Large Cap Growth Index and is favored for its diversified portfolio, low fees, and strong performance history.
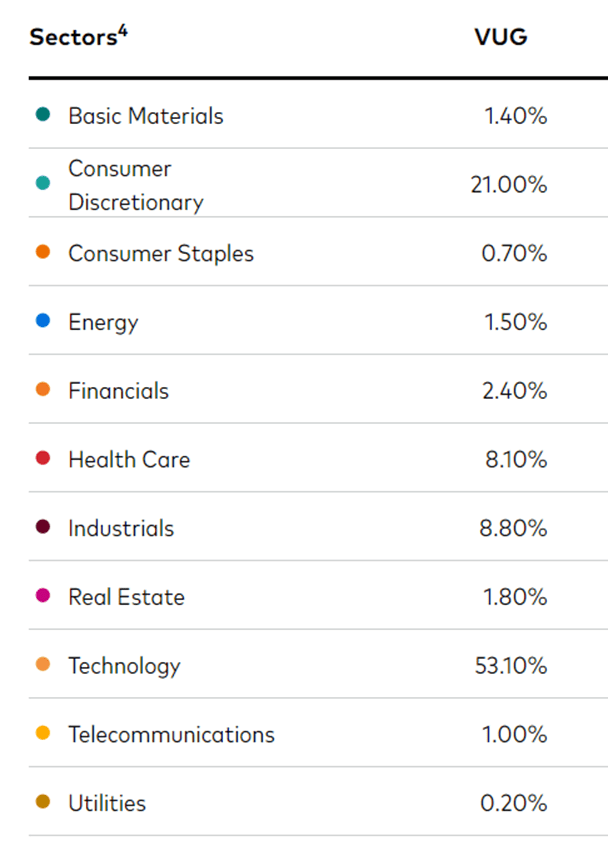
VUG Top Sector allocation:
Sector
VUG Weight
Consumer Discretionary
20.90%
Health Care
7.90%
Industrials
8.80%
Technology
53.40%
Sector allocation VUG – Canadian Equivalent of VUG
Exploring Canadian Equivalent of VUG
Investors in Canada can consider a strategic combination of ETFs. While a direct Canadian equivalent to VUG doesn’t exist, a mix of certain ETFs can provide a comparable market exposure. VUG is notable for its focus on large-cap growth stocks, predominantly in the U.S. market.
A thoughtfully constructed combination, such as 50% iShares NASDAQ 100 Index ETF (CAD-Hedged) (XQQ) and 50% Vanguard S&P 500 Index ETF (VFV), can offer a parallel investment strategy:
My favorite option: 50% in XQQ or ZQQ and 50% in VFV
XQQ (50%): XQQ tracks the NASDAQ-100 Index, which is heavily weighted towards technology. This aligns well with VUG’s significant technology allocation. However, XQQ is more concentrated in the technology sector compared to VUG.
VFV (50%): VFV tracks the S&P 500 Index, offering a broad exposure to U.S. large-cap stocks across various sectors. This helps diversify the portfolio beyond just technology. It aligns with VUG’s exposure to other sectors like healthcare, consumer discretionary, and industrials.
Detailed Analysis of Sector Balance
XQQ (50%): Primarily tracking the NASDAQ-100 Index, XQQ is heavily weighted towards the technology sector. Thus reflecting a significant portion of VUG’s tech exposure. The NASDAQ-100 includes leading tech giants like Apple, Microsoft, and Amazon, which are key constituents in VUG’s portfolio as well.
VFV (50%): VFV, which tracks the S&P 500 Index, offers a more diversified sector exposure, including healthcare, consumer goods, and financials, among others. This complements XQQ’s tech-centricity, aligning more closely with VUG’s diverse sector allocation. While VFV does include a substantial tech component, it also provides exposure to sectors less represented in XQQ.
Enhanced Insights on Geographic Focus
Both XQQ and VFV are focused on U.S. equities, similar to VUG’s U.S. market concentration. This alignment ensures that the combined portfolio largely reflects the geographic distribution of VUG. However, the emphasis within different U.S. sectors varies, with XQQ being more tech-oriented and VFV offering a broader market approach.
In-Depth Look at Growth Orientation
VUG and XQQ: Both include growth stocks. XQQ, in particular, emphasizes companies with significant growth potential, primarily within the tech sector.
VFV’s Diverse Composition: VFV includes a blend of growth and value stocks, mirroring the broader S&P 500 Index. The inclusion of value stocks in VFV may slightly dilute the overall growth-centric nature of the combination compared to VUG. But it still maintains a substantial growth focus due to the high growth potential of many S&P 500 companies.
Comprehensive View on Currency Hedging
XQQ’s Hedging: XQQ’s CAD-hedging strategy is beneficial for mitigating currency risks associated with investing in U.S. stocks. This hedging can protect Canadian investors from fluctuations in the USD/CAD exchange rate.
VFV’s Exposure: VFV does not offer currency hedging, changes in the USD/CAD exchange rate affects its performance. The lack of hedging in VFV introduces some currency risk to the combined portfolio, which can lead to additional volatility based on currency movements.
Conclusion Canadian Equivalent of VUG
The 50% XQQ and 50% VFV combination strategy offers Canadian investors a nuanced way to approximate the sector balance, geographic focus, and growth orientation of VUG. While it closely mirrors the U.S. market exposure and growth focus of VUG, the mix of hedged and non-hedged currency exposure and the inclusion of value stocks in VFV add unique elements to the combined portfolio.
The Vanguard Growth ETF (VUG) stands as a prominent player in the world of exchange-traded funds, specifically designed to mirror the performance of the CRSP US Large Cap Growth Index. In this comprehensive exploration, we delve into the intricacies of VUG, examining its investment approach, expenses, sector exposure, top holdings, performance, and associated risks.
Investment Approach and Objectives
The Vanguard Growth ETF (VUG) utilizes a passively managed, full-replication approach to mirror the CRSP US Large Cap Growth Index, providing investors with exposure to significant growth stocks. Notably, the fund imposes distinctive limitations on 75% of its assets, avoiding concentrations exceeding 10% in any single issuer’s voting securities or 5% in total assets for that issuer. Launched in 2004 and sponsored by Vanguard, VUG has grown into one of the largest ETFs, amassing assets exceeding $91.84 billion. Focusing on large-cap companies with market capitalizations over $10 billion, VUG prioritizes stability and predictable cash flows. Its strategy aligns with the growth segment, emphasizing companies poised for above-average sales and earnings growth rates. This historical background and strategic approach position VUG as a substantial and preferred choice for investors seeking growth exposure within the dynamic landscape of the US equity market.
Expense Ratio and Cost Efficiency
One of the standout features of VUG is its remarkably low expense ratio of 0.04%. This cost efficiency sets it apart, especially when compared to the average expense ratio of similar funds, which stands at 0.96%. The significance of expense ratios in determining an ETF’s total return cannot be overstated, and VUG’s affordability positions it favorably for investors seeking long-term value.
In addition to the low expense ratio, VUG offers a 12-month trailing dividend yield of 0.61%, providing a potential income stream for investors. The combination of cost efficiency and a modest dividend yield enhances the overall appeal of the fund.
While ETFs inherently offer diversified exposure, a closer examination of a fund’s holdings provides valuable insights. VUG allocates a substantial portion of its portfolio to the Information Technology sector, accounting for about 42.60%. This sector dominance is reflective of the tech-driven nature of growth stocks in the current market landscape.
The top three sectors in VUG, after Information Technology, include Consumer Discretionary and Telecom. This sectoral diversification aims to minimize single-stock risk while capturing opportunities across different segments of the economy.
At an individual holdings level, VUG’s top three positions are occupied by Apple Inc. (AAPL), Microsoft Corp. (MSFT), and Amazon.com Inc. (AMZN). Apple, with approximately 13.64% of total assets, leads the pack, underscoring the fund’s exposure to influential and high-performing companies.
The top 10 holdings collectively represent about 51.08% of the total assets under management. They offer a snapshot of the fund’s concentration and highlighting the significance of these key players in driving VUG’s performance.
VUG’s primary objective is to replicate the performance of the CRSP U.S. Large Cap Growth Index before fees and expenses. The CRSP US Large Cap Growth Index serves as a benchmark, encompassing growth companies within the broader CRSP US Large Cap Index.
Growth stocks, as represented by VUG, typically exhibit higher sales and earnings growth rates. This positions them as attractive investments during strong bull markets. However, it’s essential for investors to acknowledge the inherent trade-off—while growth stocks offer the potential for higher returns, they also come with higher valuations and increased risk compared to other equity types.
The fund’s performance should be evaluated in the context of market conditions, considering the cyclical nature of growth stocks. In robust economic environments, growth stocks tend to outperform their counterparts. But, they may face challenges in less favorable market conditions.
Conclusion:
In conclusion, the Vanguard Growth ETF (VUG) presents investors with a cost-effective avenue to gain exposure to the CRSP US Large Cap Growth Index. Its passively managed approach, coupled with a remarkably low expense ratio. The fund is ideal for those seeking to align their portfolios with the performance of major growth stocks.
While the fund’s concentration in the Information Technology sector and top holdings like Apple, Microsoft, and Amazon underscores its growth-oriented nature. Investors should approach VUG with an awareness of the inherent risks associated with growth stocks.
The Horizons Canadian Oil And Gas Equity Covered Call (ENCC ETF) stands out for its unique approach to income generation through a covered call strategy. This review aims to unpack the nuances of ENCC, shedding light on its performance, strategy, and suitability for investors seeking to enhance their income streams without veering too far into high-risk territories.
Investment Strategy:
At its core, ENCC employs a covered call strategy, a nuanced approach where the ETF holds a portfolio of stocks and sells call options on those same stocks. This method serves a dual purpose: it aims to provide investors with potential capital appreciation from the underlying stocks and generates income from the premiums received for selling the call options. This strategy is particularly appealing in flat or moderately bullish markets, where the option premiums can significantly augment the ETF’s income.
Key Details:
Ticker: ENCC
Inception Date: April 11, 2011
Net Assets: As of January 26, 2024, the ETF boasts $240,427,269 in net assets
Exchange: Listed on the Toronto Stock Exchange, ENCC is accessible to a wide range of investors.
Eligibility: Available for all registered and non-registered investment accounts, offering versatility for different investor needs.
Fees: With a management fee of 0.65% and a management expense ratio (MER) of 0.81% as of June 30, 2023, the costs are competitive within the ETF landscape.
Performance, Fees and Yield:
ENCC has demonstrated commendable performance, with its returns reflecting the effectiveness of its covered call strategy. While the exact numbers can fluctuate based on market conditions, the ETF has historically offered a competitive yield, making it an attractive option for income-focused investors. It’s important to note, however, that the covered call strategy might cap the potential upside during strong market rallies, as the sold call options can limit the growth of the underlying assets.
Summary table Risk vs Benefits of a covered call strategy
Aspect
Description
Strategy
Selling call options on a security already owned in the portfolio
Name
Covered call strategy
Risk
Potential for limited upside if the stock price rises above the strike price
Benefit
Generates additional income through premium payments received from selling call options
Goal
To earn income from stock holdings while potentially reducing downside risk
Use
Often used by investors who are willing to sell their stock at a certain price if it reaches that level
Outcome
If the stock price stays below the strike price, the option expires worthless, and the investor keeps the premium payment. If the stock price rises above the strike price, the option buyer may exercise their right to buy the stock, and the investor must sell the stock at the strike price, but still keeps the premium payment.
Distributions
Ex-Dividend Date
Record Date
Payment Date
Payment Amount
01/30/2023
01/31/2023
02/10/2023
0.13
02/27/2023
02/28/2023
03/07/2023
0.13
03/30/2023
03/31/2023
04/10/2023
0.13
04/27/2023
04/28/2023
05/05/2023
0.13
05/30/2023
05/31/2023
06/07/2023
0.13
06/29/2023
06/30/2023
07/10/2023
0.13
07/28/2023
07/31/2023
08/08/2023
0.13
08/30/2023
08/31/2023
09/08/2023
0.13
09/28/2023
09/29/2023
10/06/2023
0.13
10/30/2023
10/31/2023
11/07/2023
0.13
11/29/2023
11/30/2023
12/07/2023
0.13
12/28/2023
12/29/2023
01/08/2024
0.13
Top 10 Holdings
As at January 26, 2024
Security Name
Weight
Pembina Pipeline Corp
11.46%
TC Energy Corp
11.08%
Enbridge Inc
10.83%
ARC Resources Ltd
10.48%
Keyera Corp
10.34%
Canadian Natural Resources Ltd
10.03%
Imperial Oil Ltd
10.02%
Suncor Energy Inc
9.65%
Tourmaline Oil Corp
8.65%
Cenovus Energy Inc
8.02%
Conclusion:
The ENCC ETF offers a balanced approach for those looking to diversify their income-generating investments. With its strategic use of covered calls, it provides a unique blend of income and growth potential, albeit with some limitations on the upside. As with any investment, it’s crucial to consider how ENCC fits within your broader portfolio and investment goals. Thorough due diligence and consideration of your risk tolerance are advised before incorporating ENCC into your investment strategy.
For Canadian investors navigating the complexities of the market, ENCC represents a compelling option, blending innovation with income generation. As always, stay informed and consider consulting a financial advisor to tailor your investments to your personal financial landscape.
When it comes to investing in ETFs that track the S&P 500, Canadian investors often find themselves comparing VFV (Vanguard S&P 500 Index ETF) and VOO (Vanguard S&P 500 ETF). These ETFs are similar in that they both aim to replicate the performance of the S&P 500 Index, but they have distinct differences that can affect investment outcomes, especially when held in different account types like a Tax-Free Savings Account (TFSA) or a Registered Retirement Savings Plan (RRSP).
Executive summary VFV vs VOO
Here’s a summary table comparing the characteristics of holding a US-denominated ETF (like VOO) versus a Canadian-denominated ETF (like VFV), particularly in the context of Canadian investors:
Factor
US-Denominated ETF (e.g., VOO)
Canadian-Denominated ETF (e.g., VFV)
Currency of Trade
Traded in US dollars.
Traded in Canadian dollars.
Exchange
Traded on a US exchange, such as the New York Stock Exchange.
Traded on the Toronto Stock Exchange.
Dividend Withholding Tax
In an RRSP, US dividends are not subject to withholding tax due to the tax treaty. In other accounts, 15% withholding tax applies.
Dividends are subject to a 15% withholding tax regardless of the account, though it can be recoverable in non-registered accounts.
Currency Conversion Costs
Currency conversion is required if the investor’s base currency is not USD. This can lead to conversion fees.
No currency conversion needed for Canadian investors, saving on conversion fees.
Expense Ratios
Generally lower expense ratios due to larger scale and competition in the US market.
Slightly higher expense ratios but still relatively low for international investments.
Liquidity
Often higher trading volumes and liquidity.
Slightly lower liquidity compared to their US counterparts.
Currency Risk
Exposure to currency risk if the investor’s base currency is not USD.
Choose a Hedged ETF to reduce currency risk. If non hedged the currency risk exist but can also be considered as a way of diversification
VFV vs VOO
Understanding VFV and VOO
VFV:
VFV, or Vanguard S&P 500 Index ETF, commenced its journey on November 2, 2012, and is managed by Vanguard Investments Canada Inc. It encompasses 507 stocks, predominantly in the large-cap blend sector, indicating a focus on well-established companies. The ETF has a set management expense ratio (MER) of 0.09%, offering a reasonable cost structure for its investment services. Classified with a medium risk level, VFV is tailored to investors seeking a balanced approach to equity investment. The ETF yields dividends between 1.23% and 1.98%, demonstrating its ability to generate regular income for its shareholders.
Trading on the Toronto Stock Exchange (TSX) in Canadian dollars, VFV is particularly advantageous for Canadian investors looking to gain exposure to the US S&P 500 Index without incurring currency conversion costs. By tracking this index, VFV enables investors to participate in the performance of large-cap U.S. companies, thereby aiming for long-term capital growth. The ETF employs index/passive management techniques, ensuring a diversified investment in some of the largest and most innovative companies, while maintaining a straightforward and cost-effective investment approach. For Canadian investors keen on accessing U.S. markets with the convenience of domestic currency trading, VFV presents a compelling option.
VOO:
The Vanguard S&P 500 ETF, commonly known as VOO, was established on September 7, 2010, and is managed by The Vanguard Group. It consists of 507 stocks, focusing primarily on a large-cap blend of market capitalizations. VOO is recognized for its low management expense ratio (MER) of 0.03%, appealing to investors conscious of minimizing costs. The ETF is categorized with a moderate to aggressive risk level, reflecting its all-equity composition and market position. In terms of returns, it offers a dividend yield ranging between 1.23% and 1.98%.
VOO operates on the New York Stock Exchange (NYSE) and is denominated in US dollars. The ETF’s strategy is to track the performance of the US S&P 500 Index, providing investors exposure to some of the largest and most established companies in the United States. Its 100% equity allocation underscores its objective of long-term capital growth, targeting investors who are looking for robust growth potential in their portfolio and are comfortable with the associated risk level. VOO’s exceptionally low expense ratio combined with its strategic focus on large-cap U.S. companies makes it an attractive option for investors looking at significant exposure to the U.S. market.
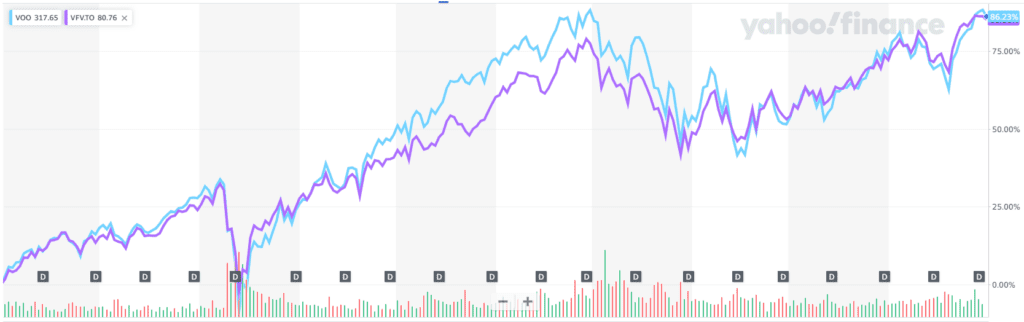
Comparing Performance VFV vs VOO
VFV vs VOO
When comparing VFV (Vanguard S&P 500 Index ETF) and VOO (Vanguard S&P 500 ETF), several factors such as performance, costs, tax implications, and currency considerations come into play. Each has its unique advantages and considerations, which vary depending on the investor’s situation, investment goals, and account type.
Performance and Expense Ratio VFV vs VOO:
VFV has shown to be a strong performer for Canadian investors seeking exposure to the U.S. S&P 500 index without the hassle of currency conversion, as it trades in Canadian dollars on the Toronto Stock Exchange. It has a slightly higher management expense ratio (MER) of 0.09% compared to VOO. However, its performance has been commendable, often attributed to the currency fluctuations between the CAD and USD.
VOO, on the other hand, trades on the New York Stock Exchange in U.S. dollars and is known for its low MER of 0.03%. This lower cost structure can potentially translate into higher returns for investors over time. The fund’s performance is directly related to the U.S. market and currency, providing a purer form of exposure to the S&P 500 for those who hold U.S. dollars.
Dividend Yield and Tax Implications:
VOO tends to have a higher dividend yield and, importantly, dividends from VOO are not subject to the 15% withholding tax in RRSP and RRIF accounts due to the U.S.-Canada tax treaty. This makes it an attractive option for those holding these accounts, as it optimizes the dividend income.
VFV, while offering a competitive dividend yield, has dividends subject to a 15% withholding tax. This tax impact can reduce the overall return, especially in accounts like TFSA where you cannot recover the withholding tax. However, in non-registered accounts, the foreign tax credit can offset some of these taxes.
Currency Considerations:
The choice between VFV and VOO may also hinge on the investor’s currency preference. VFV allows Canadian investors to invest directly in Canadian dollars, avoiding the currency exchange fees. This makes it a convenient and cost-effective option for those who do not wish to engage in currency conversions.
VOO requires Canadian investors to convert their CAD to USD, incurring conversion fees unless they already have USD or use strategies like Norbert’s Gambit to minimize these costs. However, holding U.S. dollars might be more efficient for those who anticipate making several investments in U.S. securities or for those who already hold U.S. income or savings.
Investment Horizon and Usage:
For individuals, particularly those nearing or in retirement, frequent currency conversion between CAD and USD can be cumbersome and costly. In such scenarios, VFV might be more beneficial despite the tax on dividends. It eliminates the need for ongoing currency management and can provide a simpler investment experience.
Conversely, for long-term investors or those with a significant time horizon, transitioning to USD and investing in VOO might be more cost-effective in the long run. The lower fees and tax efficiency in specific account types can compound significantly over time, enhancing overall returns.
Special Considerations:
Investors particularly concerned about currency risk might not find either VFV or VOO ideal if they are looking for currency-hedged options. In such cases, exploring currency-hedged versions of S&P 500 ETFs would be more appropriate to mitigate currency fluctuation risks (such as VSP).
Holding in TFSA vs RRSP
When deciding between holding these ETFs in a TFSA or an RRSP, it’s crucial to understand the tax implications:
TFSA:
US Dividend Withholding Tax: 15% withholding tax on dividends from US stocks applies.
Capital Gains: Tax-free.
Currency Conversion: If investing in VOO, investors need to convert CAD to USD, incurring additional costs.
TFSAs are great for tax-free growth and withdrawals, but the 15% withholding tax on US dividends diminishes the returns from US-based ETFs like VFV and VOO. However, it’s a flexible account that allows for tax-free withdrawals at any time.
RRSP:
US Dividend Withholding Tax: Exempt for US stocks or ETFs like VOO.
Capital Gains: Tax-deferred until withdrawal.
Currency Conversion: Necessary for VOO, but no conversion needed for VFV.
RRSPs offer a tax-deferred growth environment, making them particularly beneficial for holding US securities like VOO. The exemption from the US dividend withholding tax enhances the appeal of VOO in an RRSP. However, consider that eventual withdrawals from RRSPs are taxed as income at your marginal rate.
Factors to Consider
Currency Conversion and Costs: VFV allows Canadians to invest in the S&P 500 without currency conversion fees, making it more straightforward and cost-effective. VOO requires currency conversion, adding a layer of cost and complexity. However, if you have USD or are willing to use currency conversion strategies like Norbert’s Gambit, VOO’s lower MER might be more appealing.
Tax Implications: The choice between TFSA and RRSP is critical. VFV’s dividend withholding tax applies regardless of the account, while VOO’s exemption in RRSPs can be a significant advantage. Consider your current and future tax brackets, as well as the purpose of your investment (e.g., retirement savings vs. general investment).
Investment Goals and Risk Tolerance: Both VFV and VOO are 100% invested in equities, making them volatile. Ensure these ETFs fit within your broader investment strategy and risk tolerance. Diversification and understanding your long-term goals are key to making the right choice.
Performance and Returns: While historical performance isn’t indicative of future results, the difference in returns due to expense ratios, withholding taxes, and currency fluctuations should be considered. VFV’s outperformance might be attractive, but remember to consider all factors, including costs and taxes.
Conclusion VFV vs VOO
Choosing between VFV and VOO, and deciding whether to hold them in a TFSA or an RRSP, is a decision that should be tailored to your individual circumstances, goals, and financial situation. VFV offers ease and cost-effectiveness for Canadians, while VOO appeals with its low expense ratio and tax efficiency in RRSPs. Consider all aspects, including currency conversion, tax implications, fees, and your investment strategy, before making a decision. As always, consider consulting with a financial advisor to understand how these choices fit into your overall financial plan. Your investment journey should be as unique as your financial goals, and understanding the nuances
Introduction
In the realm of Canadian investing, bond Exchange-Traded Funds (ETFs) are popular for those seeking stable income and lower risk compared to stocks. Today, we’re comparing two well-known ETFs: BMO Aggregate Bond Index ETF (ZAG) and iShares Core Canadian Universe Bond Index ETF (XBB). Both aim to provide exposure to Canadian bonds, but they have distinct features that may appeal to different types of investors (ZAG vs XBB).
Executive summary
Summary Table: ZAG vs XBB
Feature
ZAG (BMO Aggregate Bond Index ETF)
XBB (iShares Core Canadian Universe Bond Index ETF)
Objective
To replicate the Bloomberg Barclays Canadian Float Adjusted Bond Index performance.
To track the FTSE Canada Universe Bond Index performance.
MER
0.09% (On a $10,000 investment, annual fee would be $9)
0.10% (On a $10,000 investment, annual fee would be $10)
AUM
$6.40 billion (indicating higher popularity and potential liquidity)
$4.51 billion (robust but less than ZAG)
Diversification
Broad range of government and corporate Canadian bonds.
Similar broad exposure to Canadian government and corporate bonds.
Liquidity
Generally higher due to larger AUM.
Sufficient, though slightly less than ZAG due to smaller AUM.
Performance
Steady, reflecting overall Canadian bond market.
Aims for consistent income and capital preservation, mirroring broader market.
Investment Suitability
Suitable for those seeking a diversified, low-cost bond ETF. Preferred for its slightly lower fees and higher liquidity.
Also suitable for diversified bond exposure with slightly higher fees but robust performance.
ZAG vs XBB
ZAG: BMO Aggregate Bond Index ETF Overview
ZAG is designed to replicate the performance of the Bloomberg Barclays Canadian Float Adjusted Bond Index. It includes a wide range of government and corporate bonds, offering a diversified bond portfolio.
Management Fee: Low, making it an attractive option for cost-conscious investors.
Diversification: Covers a broad spectrum of Canadian bonds.
Performance: Known for steady performance, reflecting the overall Canadian bond market.
XBB: iShares Core Canadian Universe Bond Index ETF Overview
XBB seeks to track the performance of the FTSE Canada Universe Bond Index. Similar to ZAG, it invests in a diversified portfolio of Canadian bonds, including government and corporate bonds.
Management Fee: Slightly higher than ZAG, but still competitive.
Diversification: Similar broad exposure to the Canadian bond market.
Performance: Aims for consistent income and preservation of capital, mirroring the broader bond market.
Key Differences to Consider ZAG vs XBB
Index Tracked:
ZAG follows the Bloomberg Barclays index, while XBB tracks the FTSE Canada Universe. The difference in indices may lead to variations in holdings and performance.
Fees: A Closer Look
The cost of an ETF is reflected in its Management Expense Ratio (MER), a crucial factor for many investors. The MER is a yearly charge deducted from the ETF’s net asset value (NAV), affecting overall returns.
XBB: Features an MER of 0.10%. This means on a $10,000 investment, the annual fee would be $10.
ZAG: Comes in slightly lower at 0.09% MER, equating to $9 annually on a $10,000 investment.
While both ETFs are competitive, ZAG edges out with marginally lower fees, making it a slightly more cost-efficient choice in the long run.
Size and Liquidity: Importance of AUM
The Assets Under Management (AUM) of an ETF are indicative of its size and liquidity. Larger AUM generally means better liquidity, lower bid-ask spreads, and lesser risk of being delisted.
XBB: Boasts an AUM of $4.51 billion, indicating robust trading and stability.
ZAG: Has a higher AUM of $6.40 billion, making it more popular and potentially offering better liquidity.
Both ETFs have substantial AUM, ensuring sufficient liquidity for most investors. However, ZAG’s larger size might provide a bit more confidence for those concerned about liquidity and market presence.
Which One Should You Consider ZAG vs XBB?
Risk Profile and Investment Goals: Both ETFs are suitable for those seeking income and lower risk. Your choice may depend on the specific index you prefer or slight differences in fees and liquidity.
Cost-Sensitivity: If you are particularly sensitive to fees, ZAG might be the more appealing option due to its lower MER.
Diversification Needs: Both offer broad market exposure, but it’s worth looking into the specific bonds each holds to ensure alignment with your diversification strategy.
Both ZAG and XBB are reputable ETFs offering Canadian investors quality bond exposure. The choice between the two might boil down to slight differences:
Cost-conscious investors might lean towards ZAG for its marginally lower MER.
Liquidity-focused investors could prefer ZAG due to its larger AUM, though both ETFs are quite liquid.
Conclusion
Both ZAG and XBB are strong contenders in the Canadian bond ETF space. They offer diversified exposure to Canadian bonds, with slightly different approaches and fee structures. As always, it’s essential to consider your investment goals, risk tolerance, and costs before making a decision. Remember, while ETFs can be part of a diversified portfolio, it’s crucial to understand the underlying assets and risks involved.
Remember to consult with a financial advisor or do further research before making investment decisions. Stay informed and invest wisely!
When it comes to investing in ETFs, many Canadians look for all-in-one solutions that offer a diversified portfolio with a single transaction. XEQT and VGRO are two popular all-in-one ETFs that aim to simplify investing for individuals. Each ETF provides a different investment strategy, asset allocation, and risk level, and understanding these differences is key to choosing the right one for your investment goals (XEQT vs VGRO).
Invests entirely in other iShares ETFs for global equity exposure
Invests in a mix of Vanguard ETFs for a diversified blend of stocks and bonds
Risk Profile
High (due to full equity exposure)
Moderate to High (due to mixed assets)
Intended Investor Profile
Investors with high risk tolerance and long-term growth focus
Investors seeking a balance of growth and income, with moderate risk tolerance
Market Exposure
Global, including U.S., Canada, developed international markets, and emerging markets
Global, with a diversified portfolio across various markets and asset classes
Potential for Returns
Higher potential returns with higher volatility
Potentially lower returns compared to XEQT, but with reduced volatility due to bond inclusion
Income Generation
No direct income focus, as it is all equities
Provides income through the fixed income component
Investment Horizon
Suitable for long-term investors who can withstand periods of market volatility
Suitable for investors looking for long-term growth with some level of stability
XEQT: iShares Core Equity ETF Portfolio
XEQT, the iShares Core Equity ETF Portfolio, is offered by BlackRock Canada. It’s designed for investors looking for long-term capital growth with a 100% equity allocation. This ETF is a fund of funds, meaning it invests in other iShares ETFs. It has a global reach, including exposure to the U.S., Canada, developed international markets, and emerging markets.
The 100% equity composition makes XEQT an aggressive investment option, suitable for investors with a higher risk tolerance and a longer time horizon. It does not include bonds, which typically provide stability and income. As a result, investors can expect higher volatility but also the potential for higher returns over the long term compared to mixed-asset ETFs.
VGRO: Vanguard Growth ETF Portfolio
The fund VGRO, by Vanguard Canada, is another popular choice for investors looking for an all-in-one ETF solution. VGRO aims to provide long-term capital growth with a strategic allocation of roughly 80% in equities and 20% in fixed income. This blend of stocks and bonds is designed to strike a balance between risk and return.
VGRO’s diversified approach across different markets and asset classes makes it suitable for investors with a moderate to high risk tolerance. The inclusion of bonds serves to temper the volatility associated with stock markets. It provides a cushion during market downturns and a steady stream of income through interest payments.
Key Differences Between XEQT vs VGRO
Investment Strategy
XEQT is an all-equity portfolio, making it more aggressive with the potential for higher returns and higher risk. VGRO includes a mix of equities and bonds, aiming for growth while mitigating risk with income-generating assets.
Asset Allocation
With XEQT, you are looking at a 100% allocation to stocks, whereas VGRO offers an 80/20 split between stocks and bonds.
Risk Profile
XEQT is geared towards investors with a high-risk tolerance, while VGRO caters to those with a moderate to high-risk tolerance, offering a more balanced approach.
Potential Returns
While both ETFs aim for growth, XEQT’s all-equity profile suggests higher potential returns accompanied by greater volatility. VGRO’s mixed allocation may result in more stable but potentially lower returns over the same period.
Which One Should You Choose XEQT vs VGRO?
The choice between XEQT and VGRO should be based on your investment horizon, risk tolerance, and financial goals. If you are a younger investor with a long time horizon and a capacity to withstand market swings, XEQT might align with your growth-oriented strategy. Conversely, if you seek a balance between growth and income with a slightly lower risk profile, VGRO may be more appropriate.
Conclusion
Both XEQT and VGRO offer diverse, all-in-one investment solutions that cater to different investor profiles. XEQT suits those who are fully focused on equity growth and can handle the associated risks, while VGRO is for those who prefer a mix of growth and income with a slightly tempered risk approach. Whichever you choose, these ETFs can be convenient, low-maintenance options for building your investment portfolio. Always consider consulting with a financial advisor to ensure that your investment choice aligns with your overall financial plan.