FMAX, the Hamilton U.S. Financials Yield Maximizer ETF, aims to generate income by investing in a diversified portfolio of U.S. financial services companies. It combines the potential for capital appreciation with an active covered call strategy to enhance yield and mitigate volatility, making it a compelling option for income-seeking investors. Here’s a full FMAX ETF review.
Strategic Approach to Yield and Volatility
FMAX’s approach involves writing covered call options on its holdings. This method is designed to capture premium income which can increase the fund’s yield. By writing at-the-money options, FMAX targets higher cash premiums compared to out-of-the-money options. However, the strategy is applied to only approximately 30% of the portfolio’s holdings. This allows the remaining 70% of the portfolio the opportunity to appreciate in value, striving for a balance between income and growth.
Benefits of Covered Call Strategies
Covered call strategies, like the one used by FMAX, are popular for their ability to generate income and provide a buffer against minor price declines in the underlying securities. The income from selling call options can offer a cushion during market dips, as the premium income can offset some capital losses.
Risk Considerations
Investing in FMAX involves several risks. Options strategies can limit upside potential since the sold calls cap the growth of the underlying stock at the strike price. In a surging market, this could mean missing out on significant gains. Additionally, the ETF’s focus on the financial sector means that it may be more vulnerable to industry-specific risks, including regulatory changes and economic cycles that disproportionately affect financial companies.
The Role of FMAX in a Portfolio
For investors looking for monthly income and a moderate level of risk, FMAX might be a fitting addition to a diversified portfolio. Its strategy offers a different risk-return profile than owning the stocks outright, potentially making it suitable for those with an intermediate risk tolerance.
Investors in FMAX can benefit from its tax-efficient distribution strategy. This is particularly advantageous within an RRSP, where the 15% withholding tax on U.S. dividends does not apply. Holding FMAX in an RRSP can enhance the tax efficiency of the income generated, making it an attractive option for investors seeking to maximize their after-tax returns. This strategic placement within registered accounts can make a significant difference in the long-term growth of an investment portfolio.
No Leverage Utilized
FMAX does not use leverage, which can often amplify losses. By avoiding leverage, the ETF seeks to provide a more stable investment experience.
Accessibility and Flexibility
All Hamilton ETFs, including FMAX, are available for purchase on the Toronto Stock Exchange (TSX). They can be included in various registered accounts like RRSPs and TFSAs, which can offer additional tax benefits.
Setting Up a DRIP
Investors interested in reinvesting their dividends can set up a Dividend Reinvestment Plan (DRIP) by contacting their brokerage. This can compound returns by automatically reinvesting income into additional shares of the ETF.
FMAX Holdings
TICKER
NAME
WEIGHT
BRK/B
Berkshire Hathaway Inc
5.0%
V
Visa Inc
5.0%
JPM
JPMorgan Chase & Co
5.0%
MA
Mastercard Inc
5.0%
BAC
Bank of America Corp
5.0%
WFC
Wells Fargo & Co
5.0%
BX
Blackstone Inc
5.0%
MS
Morgan Stanley
5.0%
SPGI
S&P Global Inc
5.0%
AXP
American Express Co
5.0%
GS
Goldman Sachs Group Inc/The
5.0%
BLK
BlackRock Inc
5.0%
SCHW
Charles Schwab Corp/The
5.0%
PGR
Progressive Corp/The
5.0%
C
Citigroup Inc
5.0%
CB
Chubb Ltd
5.0%
MMC
Marsh & McLennan Cos Inc
5.0%
FI
Fiserv Inc
5.0%
CME
CME Group Inc
5.0%
ICE
Intercontinental Exchange Inc
5.0%
Final Thoughts FMAX ETF review
In conclusion, FMAX represents a nuanced investment product that combines exposure to U.S. financials with an options overlay strategy to enhance yield and manage risk. While it offers several potential benefits, including monthly income and reduced volatility, investors must also consider the associated risks and the possibility of capped upside potential. As with any investment, it’s crucial to align with your financial objectives and risk tolerance. Before making investment decisions, reviewing the latest information on the Hamilton ETFs website and consulting with a financial advisor is advised.
Hello, Canadian investors! Today, we’re diving into a comparison that’s often a topic of interest: VUN vs. VTI. Both are popular ETFs offering the same exposure to the U.S. stock market, but they have some distinct differences that are crucial to understand. Let’s break them down.
VUN, the Vanguard U.S. Total Market Index ETF, offers a unique opportunity for Canadian investors. It’s a Canadian-listed ETF, specifically designed to track the performance of a broad U.S. stock market index. This makes VUN an attractive option for those looking to invest in a wide range of American companies.
One of the key features of VUN is its listing on the Toronto Stock Exchange, where it trades in Canadian dollars (CAD). This is a significant advantage for Canadian investors, as it eliminates the need for currency conversion from CAD to U.S. dollars (USD). Investing directly in CAD simplifies the investment process, saving both time and the potential costs associated with currency exchange.
While both VTI and VUN aim to replicate the performance of the CRSP US Total Market Index, there are nuances in their holdings due to their targeted investor base. VTI holds the actual stocks in the index, providing direct exposure to U.S. companies. VUN, on the other hand, primarily holds units of the U.S.-based Vanguard Total Stock Market ETF, effectively making it a “wrap” of VTI for Canadian investors. This structure ensures that VUN investors have similar exposure to the U.S. market as VTI investors, despite the cross-border investment.
For Canadian investors, VUN’s convenience is unmatched. It avoids the complexities of investing in a foreign currency and dealing with the associated exchange rate fluctuations. This ease of investment, combined with the broad market exposure, makes VUN an ideal choice for those seeking a straightforward and effective way to invest in the U.S. stock market.
What is VTI?
VTI, the Vanguard Total Stock Market ETF, stands as a popular choice for investors looking to gain comprehensive exposure to the U.S. stock market. This U.S.-listed ETF tracks the CRSP US Total Market Index, encompassing a wide array of American stocks across various market capitalizations.
A notable aspect of VTI is its listing on American exchanges, where it trades in U.S. dollars (USD). This feature is crucial for Canadian investors to consider, as it involves currency conversion from Canadian dollars (CAD) to USD. While this adds an extra step in the investment process, it also opens up opportunities to directly invest in the U.S. market, which can be particularly appealing for those looking to diversify internationally.
The difference in the listing currency and exchange of VUN and VTI is a crucial factor for Canadian investors. VUN is listed in Canadian dollars (CAD) on the Toronto Stock Exchange (TSX), offering a straightforward investment process for Canadians. This eliminates the need for currency conversion, avoiding the associated costs and fluctuations in exchange rates. In contrast, VTI is listed in U.S. dollars (USD) on American exchanges. Investing in VTI requires Canadians to convert CAD to USD, incurring currency conversion fees. Additionally, the ongoing fluctuation between CAD and USD can impact the investment’s value and returns.
Tax Considerations:
The tax implications of VTI and VUN are significantly different, especially concerning RRSP accounts. VTI, being a U.S.-listed ETF, is subject to the Canada-U.S. tax treaty. This means that when VTI is held in an RRSP, it benefits from the treaty’s provisions, potentially making it more tax-efficient. The treaty reduces the withholding tax on U.S. dividends, a benefit not applicable to VUN, as it is a Canadian-listed ETF.
Expense Ratios:
VUN MER = 0.17%
VTI MER = 0.03%
VTI generally boasts a lower expense ratio compared to VUN. An expense ratio is an annual fee expressed as a percentage of the fund’s total assets and is deducted from the fund’s assets, affecting its overall return. VTI’s lower expense ratio can make a significant difference in long-term investment returns, as lower costs typically translate to higher net returns for investors.
Dividend Withholding Taxes:
When it comes to dividend withholding taxes in non-RRSP accounts, VTI and VUN differ. For Canadian investors holding VTI in non-RRSP accounts, there’s a U.S. dividend withholding tax. This tax reduces the dividend amount received from the investment. VUN, on the other hand, does not attract U.S. dividend withholding taxes in non-RRSP accounts, as it’s a Canadian-listed ETF. This can be a crucial factor for investors when deciding between the two ETFs, particularly if they plan to hold their investments in taxable accounts.
Which One Should You Choose?
The choice between VUN and VTI depends on several factors:
Currency Preference: If you prefer to trade in CAD and avoid currency conversion, VUN is suitable.
Account Type: For RRSPs, VTI might be the better choice due to tax efficiency.
Cost Considerations: Consider the impact of expense ratios and potential withholding taxes on your investment returns.
Conclusion
Both VUN and VTI offer Canadian investors great ways to invest in the U.S. stock market. Your choice should align with your investment strategy, currency preferences, and account types. As always, it’s important to do your own research and consider consulting with a financial advisor.
Remember, knowledge is power in the world of investing. Stay informed and invest wisely!
Disclaimer: This content is for informational purposes only and is not intended as investment advice.
Canadian investors have a wealth of options when it comes to building a diversified portfolio. Among the myriad of choices, VUN (Vanguard U.S. Total Market Index ETF) and XEQT (iShares Core Equity ETF Portfolio) stand out for their unique features and investment strategies. This post delves into the key differences and potential benefits of each ETF, helping investors make informed decisions based on their financial goals and risk tolerance.
Executive summary VUN vs XEQT
Feature
VUN (Vanguard U.S. Total Market Index ETF)
XEQT (iShares Core Equity ETF Portfolio)
Market Focus
U.S. Equities
Global Equities
Number of Stocks
Over 3,500
Over 9,000
Geographic Exposure
United States
Canada, U.S., Developed and Emerging Markets
Investment Strategy
Tracks CRSP US Total Market Index
Invests in iShares ETFs for global equity exposure
Equity Allocation
100% U.S. Equities
100% Global Equities
Management Expense Ratio (MER)
Low
Low
Risk Profile
Varied due to broad market exposure
Higher, due to all-equity global portfolio
Suitability
Investors bullish on the U.S. market
Investors seeking global diversification and higher risk tolerance
Growth Potential
High, with exposure to innovative U.S. companies
High, with diversified global market exposure
Portfolio Management
Simplified U.S. market investment
Simplified global equity investment through a single transaction
VUN: Diving into the U.S. Market
VUN is designed to track the performance of the CRSP US Total Market Index, encompassing large-, mid-, small-, and micro-cap equity securities in the U.S. This ETF is a solid choice for investors looking to gain broad exposure to the U.S. stock market, benefiting from the growth potential of a wide range of U.S. companies.
Key Features:
Broad Exposure: VUN offers exposure to over 3,500 U.S. stocks, providing a comprehensive snapshot of the U.S. equity market.
Low Fees: With a low management expense ratio (MER), VUN is an economical choice for cost-conscious investors.
Growth Potential: The U.S. market is known for its innovative companies and growth opportunities, making VUN an attractive option for growth-oriented investors.
XEQT: Embracing Global Diversification
XEQT takes a different approach by offering investors an all-equity portfolio that spans global markets, including Canada, the U.S., developed international markets, and emerging markets. This ETF aims to provide long-term capital growth by investing primarily in iShares ETFs, thereby offering a diversified, global equity exposure.
Key Features:
Global Diversification: XEQT provides investors with exposure to over 9,000 stocks worldwide, reducing country-specific risks and taking advantage of global growth opportunities.
All-Equity Portfolio: Targeting 100% equity, XEQT is suitable for investors with a higher risk tolerance and a long-term investment horizon.
Simplified Portfolio Management: By investing in XEQT, investors can achieve a diversified global equity portfolio through a single transaction, simplifying portfolio management.
Choosing Between VUN vs XEQT
The choice between VUN and XEQT boils down to your investment objectives, risk tolerance, and preference for market exposure.
U.S. vs. Global Exposure: If you’re bullish on the U.S. market and prefer concentrated exposure to U.S. equities, VUN might be your go-to. Conversely, if you value global diversification and want to spread your investments across various geographic regions, XEQT could be more aligned with your strategy.
Risk and Return Profile: VUN’s focus on the U.S. market might offer a different risk-return profile compared to XEQT’s global approach. Consider how each ETF fits within your overall risk tolerance and investment goals.
Investment Horizon: Both ETFs are suitable for long-term investors, but your horizon might influence your choice. XEQT’s global diversification might appeal more to those with a very long-term perspective and a belief in global economic growth.
Conclusion
Both VUN and XEQT offer unique advantages to Canadian investors, from VUN’s comprehensive U.S. market exposure to XEQT’s global diversification. When deciding between the two, consider how each aligns with your investment philosophy, risk tolerance, and long-term goals. Remember, the best choice is the one that fits seamlessly into your broader investment strategy, contributing to a well-rounded and resilient portfolio.
The Horizons Equal Weight Canadian Bank Covered Call (BKCL ETF) is designed to provide exposure to a diversified array of Canadian banks. The fund aims to achieve two primary objectives: (a) mimicking the performance of Solactive Equal Weight Canada Banks Index, comprised of equally-weighted shares from a variety of Canadian banks, and (b) delivering attractive monthly distributions derived from both dividends and income generated from call options.
BKCL employs a dynamic covered call option writing program as a means to generate income. This strategy involves selling call options on the underlying equities held within the ETF’s portfolio. The goal is to generate additional returns from the premiums collected through these options, which can provide a cushion against potential downward movements in the market.
A distinctive feature of BKCL is its utilization of leverage. Leverage, in this context, involves borrowing funds to enhance investment potential. BKCL employs leverage at a controlled ratio of approximately 125%, which means that for every dollar of the ETF’s assets, an additional 25 cents are borrowed. This approach has the potential to amplify the fund’s performance, both in growth periods and when aligned with the performance of the Underlying Index.
BKCL was introduced on July 05, 2023. The Target Yield is 15% based on the fund fact sheet.
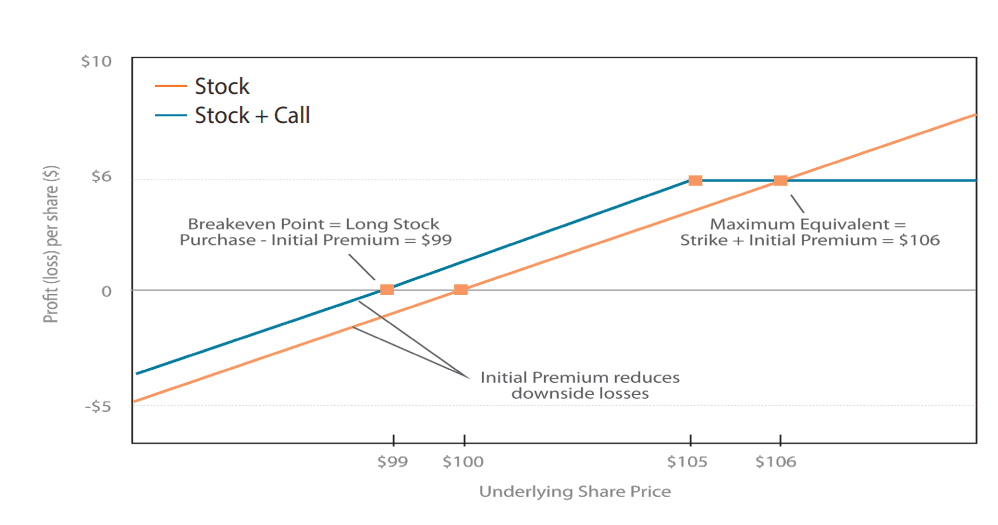
Although Horizons’ actively managed covered call ETFs are flexible in their management, they adhere to key investment principles that optimize their strategic performance. Across all equity-focused covered call ETFs, a consistent practice involves writing covered calls with certain characteristics. Specifically, these ETFs tend to engage in the writing of shorter-dated (expiring in less than two months) and out-of-the-money (OTM) covered call options. Shorter-dated options strike a balance between earning attractive premiums and increasing the likelihood that the options will not be exercised in-the-money, which is advantageous for those who write covered calls.
The team responsible for writing options generally focuses on covering up to 50% of the underlying equities portfolio. This strategic approach aims to safeguard a portion of the potential price gains in the underlying securities. Consequently, these ETFs exhibit a close correlation with the performance of the securities upon which they write calls. Investors should expect to follow a trajectory that aligns with the underlying securities’ performance, enhanced by the additional income from the generated call option premiums.
It is important to note that the risk profile of covered call ETFs utilizing OTM options closely resembles that of the underlying securities they invest in. The following example illustrates how the OTM strategy aims to generate a total return primarily comprising a segment of the underlying security’s price return, combined with the value of the option premium generated through writing calls.
Source: Horizons ETF website
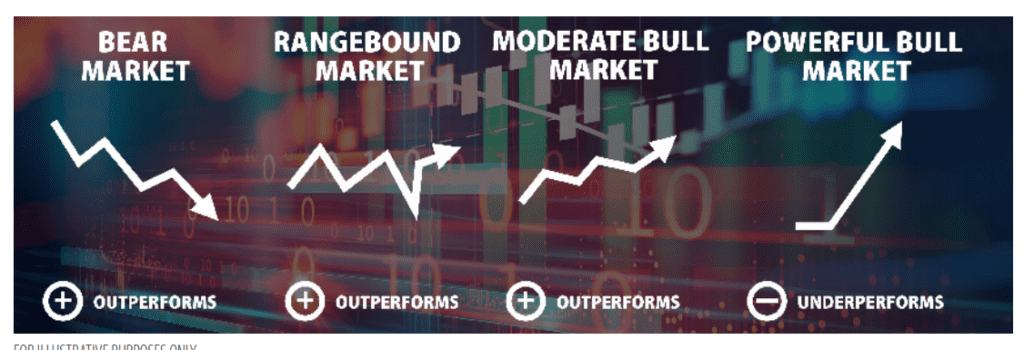
How had Covered call ETF’s performed historically?
In historical contexts characterized by bear markets, range-bound markets, and moderate bull markets, a covered call strategy has typically demonstrated the ability to outperform its underlying securities. However, during robust bull markets, when the underlying securities experience frequent rises beyond their strike prices, covered call strategies have historically exhibited slower growth. Nevertheless, even in these bullish phases, investors typically realize moderate capital appreciation alongside the accrual of dividends and call premiums.
BKCL vs HMAX! comparison
Strategy
The BKCL ETF from Horizons sells out-of-the-money (OTM) call options on 50% of the stocks. The OTM strategy caps the return of the written positions at the option strike price until the option expires. Generally, for Horizons ETFs, option expiries are 1 to 2 months.
When it comes to dividend investing, particularly in the realm of ETFs, two popular choices among investors are the Vanguard U.S. Dividend Appreciation ETF (VIG) and its Canadian counterpart, the Vanguard U.S. Dividend Appreciation Index ETF (VGG). Both aim to provide investors with exposure to U.S. companies that have a history of increasing dividends, but they come with their nuances, especially when considering the investment vehicle, such as a Registered Retirement Savings Plan (RRSP) or a Tax-Free Savings Account (TFSA) in Canada. (VIG vs VGG)
Executive summary VIG vs VGG
Feature
VIG (U.S. Dividend Appreciation ETF)
VGG (Vanguard U.S. Dividend Appreciation Index ETF)
Listing
NYSE
TSX
Currency
USD
CAD
Ideal for
RRSP accounts due to U.S.-Canada tax treaty benefits
TFSA accounts for more straightforward tax handling
Withholding Tax
No U.S. withholding tax on dividends in RRSP
Withholding taxes apply, but less relevant in a TFSA
Investor Focus
Suitable for those seeking U.S. dividend growth stocks and are comfortable with USD investments
Designed for investors wanting exposure to U.S. dividend stocks without currency conversion concerns
Tax Efficiency
High in RRSP due to tax treaty
High in TFSA due to Canadian listing and no need for currency conversion
MER
0.10%
0.29%
Access
Direct access to U.S. markets, may require currency conversion
Easy access for Canadian investors, traded in CAD
VIG: Vanguard U.S. Dividend Appreciation ETF
VIG is listed on the NYSE and primarily targets U.S. investors, although it’s also accessible to international investors, including Canadians. It tracks the performance of the NASDAQ US Dividend Achievers Select Index, comprising U.S. stocks that have a record of increasing dividends for at least ten consecutive years. VIG’s appeal lies in its focus on companies with the potential for long-term capital appreciation and a steady increase in dividends, making it an attractive option for growth-oriented dividend investors. This ETF is designed to follow an index comprised of U.S. companies that also meet rigorous standards for sustaining dividends. As a result, the ETF’s holdings represent some of the most reliable and esteemed businesses in the U.S. market.
One significant advantage of holding VIG, especially for Canadian investors, comes into play within an RRSP. Thanks to the tax treaty between Canada and the U.S., Canadian investors holding U.S.-listed securities like VIG in an RRSP are exempt from U.S. withholding taxes on dividends. This makes VIG particularly appealing for long-term holdings in an RRSP, where the compounding effect of reinvested dividends can significantly enhance portfolio growth over time without the drag of withholding taxes.
VGG: Vanguard U.S. Dividend Appreciation Index ETF
VGG, on the other hand, is a Canadian-listed ETF that seeks to replicate the performance of the U.S. Dividend Appreciation Index, excluding withholding taxes. It offers Canadian investors direct exposure to U.S. dividend-paying stocks but is traded in Canadian dollars on the Toronto Stock Exchange, making it more accessible and eliminating the need for currency conversion for Canadian investors.
For investments within a TFSA, VGG stands out as the better choice. The TFSA’s unique tax-free status does not extend to recovering withholding taxes on foreign dividends. Therefore, holding a Canadian-listed ETF that invests in U.S. stocks, like VGG, can be more tax-efficient. Investors benefit from the growth and dividend payouts of U.S. companies while avoiding the complexity and potential tax inefficiencies associated with foreign withholding taxes.
Investors holding Canadian dollars might lean towards VGG, whereas those with investments in U.S. dollars could prefer VIG. This is due to its significantly reduced management expense ratio (MER) – VIG’s MER stands at 0.10%, in contrast to VGG’s 0.29%. While dividends from international companies typically face less advantageous tax considerations, the fund has demonstrated commendable tax efficiency to date.
In terms of investment strategy, both ETFs align with a long-term, dividend-growth approach. Investors looking for steady income along with capital appreciation may find these ETFs aligning with their investment goals. However, investors should base their choice between VIG and VGG on their account type (RRSP vs. TFSA), tax situation, and currency preference.
Conclusion
For Canadian investors, the choice between VIG and VGG is not merely about the underlying dividend growth strategy but also involves considering the investment account and the associated tax implications. Holding VIG in an RRSP can maximize the benefits of the U.S.-Canada tax treaty, enhancing long-term growth without the burden of withholding taxes. For TFSAs, where such tax advantages do not apply, VGG offers a more straightforward and potentially more tax-efficient way to gain exposure to U.S. dividend growth stocks. As with any investment decision, it’s crucial to consider one’s financial goals, tax situation, and investment horizon before choosing between VIG and VGG.
In this article we will publish the complete list of stocks making the “S&P 500 Dividend aristocrat” by sector. Also, we will review the strategy of investing in dividend stocks. The “S&P 500 Aristocratic Dividend” is one of the most attractive indices for investors looking for a quality dividend Name and Symbols. The criteria’s for admission to the “S&P 500 Dividend Aristocrats” are very strict. The stocks that make up the list must have had 25 consecutive years history of increasing their dividends. The index is mainly composed of large cap stocks (Bluechips). If you are looking for the Best dividend stock to buy, there is no question that Dividend aristocrats are a good starting point.
Investing in dividend paying stocks is a strategy that appeals to young and old investors. Here is a quick reminder of the main concepts to keep in mind before applying this strategy:
Investment horizon: 5 years or more minimum. The strategy of investing in dividend paying stocks is not suitable for an investor with a short term horizon (less than 5 years).
Objective: The strategy can help you build passive income or further grow your capital by reinvesting the dividends received.
Risk Tolerance: Medium (provided you restrict yourself to selecting quality securities and having a diversified portfolio across several sectors).
About the list
The list of S&P 500 Dividend Aristocrats. The research firm Standard and Poors updates this list annually. In the update, Standard & Poor’s withdraws securities that would not have increased their dividend payments from the previous year. The index is rebalanced quarterly in January, April, July and October.
Again, the list is just a starting point to begin your research! The list has been organized by industry to make it easier for you to build a diversified portfolio.
Canadian Reits are listed companies that invest in real estate. A good number of investors would like to invest in real estate to diversify their investments, or out of the conviction. However, the direct management of a property presents many constraints, and requires time and skills. Also, delegating the management of the property to an agency does not solve all the problems. The solution lies in investing directly in Reits listed on the Toronto Stock Exchange.
How REITs operate?
A REIT is a real estate company. Its business is to invest the capital it raises in the acquisition or construction of buildings, with a the purpose of leasing them. Its activity provides it with rents and, where appropriate, capital gains. REITs are listed on the stock exchange, so REITs shares are open to individual investors within an regular investment account.
However, REITs have several particularities. They are present in different sectors of activity. They invest, for example, in different types of assets, such as shopping centres, offices, logistics buildings, hotels, among others. The other specificity of listed property companies is that they use financial leverage. That is to say that these companies will have equity to invest in real estate. But they will also use the loan to be able to maximize the return on their equity.
The third specificity of listed real estate investment companies is that they benefit from a tax exemption. Their income and capital gains are taxed at the level of its shareholders and not at the level of the property company itself. Note that REITs are required to redistribute to their shareholders at least 95% of their revenues. After deduction of costs, rents are distributed to shareholders as dividends, without being taxed at the company level.
You can hold REITs inside a Tax Free Saving Account or Registered Retirement Saving Plan, as well as a regular cash trading account. If you’re looking for an easy way to add the real estate asset class to your portfolio, REITs or ETFs might be the way to go.
Are there Risks with REITs?
Like a stock, a REIT is a market investment that fluctuates in value and is not guaranteed. Therefore, there are inherent risks when you invest in REITs. One example is how market cycles can impact REIT returns. When the real estate market drops, REITs tend to follow suit. REIT values can also fluctuate with interest rates. As rates rise, REIT values tend to rise, depending on other factors. This is why you should never invest all of your money in REITs, or any single asset class for that matter.
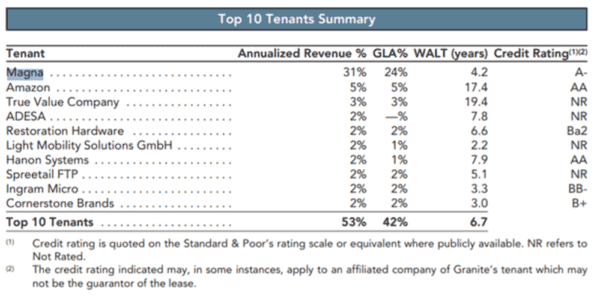
Granite Real Estate Investment Trust (GRT-UN), commonly known as Granite REIT, is a Toronto-based real estate investment trust that focuses primarily on the acquisition, development, ownership, and management of industrial properties, including warehouses and logistics sites. The trust’s portfolio spans multiple countries, with a significant presence in North America and Europe, catering to a diverse range of tenants from various sectors.
Strengths
Diversified Portfolio: Granite REIT’s portfolio is geographically diversified across North America and Europe, reducing the risk associated with regional economic downturns. This diversification helps stabilize cash flows and revenue.
Quality Tenants: The trust tends to lease properties to high-quality, creditworthy tenants, which ensures steady rental income and reduces the risk of defaults.
Industrial Focus: The focus on industrial and logistics real estate is a significant strength, especially given the rising demand for warehousing and distribution centers driven by e-commerce growth and changes in global supply chains.
Financial Health: Historically, Granite REIT has maintained a solid balance sheet with reasonable levels of debt, which is crucial for sustaining operations and funding growth initiatives.
investors’ presentation – Top 10 tenants – Best Canadian Reits
Allied Properties Real Estate Investment Trust (AP-UN) is a leading owner, manager, and developer of urban office environments across major cities in Canada. Allied Properties REIT focuses on a distinctive niche, converting light industrial structures into modern office spaces, often catering to technology and creative industry tenants. This focus on urban workspaces in key Canadian markets, including Toronto, Montreal, and Vancouver, positions Allied in a unique segment of the real estate market.
Strengths
Urban Office Niche: Allied’s focus on transforming light industrial properties into trendy, urban office spaces appeals to a growing segment of the workforce, particularly in the technology and creative industries. This specialization differentiates Allied from other REITs with more traditional office or retail portfolios.
Prime Locations: Allied’s properties are strategically located in Canada’s major cities’ core urban areas, where space is at a premium and demand for office space remains strong, particularly from industries less affected by remote work trends.
Tenant Diversification: Despite a focus on specific sectors, Allied boasts a diversified tenant base within the tech and creative industries, reducing reliance on any single tenant or industry.
Sustainable Practices: Allied has a commitment to sustainability, which is increasingly important to tenants and investors. This includes maintaining and upgrading properties to high environmental standards, potentially reducing long-term operating costs and increasing appeal to eco-conscious tenants.
Adaptive Reuse Expertise: Allied’s expertise in the adaptive reuse of industrial buildings positions it well to capitalize on urban revitalization trends and the growing preference for unique, non-commodity office spaces.
3) Canadian Apartment REIT (CAR.UN)
Canadian Apartment Properties Real Estate Investment Trust (CAPREIT) (CAR.UN) is a publicly traded real estate investment trust specializing in the ownership and management of residential rental apartments, townhomes, and manufactured home communities across Canada. CAPREIT aims to provide secure, high-quality housing options to its tenants while delivering stable, long-term returns to its unitholders.
Strengths
Diverse Portfolio: CAPREIT boasts a large and diverse portfolio of residential properties, including apartment buildings, townhouses, and manufactured home communities. This diversity helps mitigate risks associated with regional economic downturns and fluctuating market conditions.
Geographical Spread: With properties spread across major urban centers and smaller cities in Canada, CAPREIT benefits from a broad geographical footprint. This spread can provide stability and growth opportunities, as the trust is not overly reliant on any single market.
High Occupancy Rates: CAPREIT typically enjoys high occupancy rates, a testament to the demand for its residential units and effective property management. High occupancy is crucial for generating steady rental income streams.
Experienced Management: The trust is managed by an experienced team with a proven track record in property management, acquisitions, and finance. This expertise is vital for strategic growth and operational efficiency.
Focus on Sustainability: CAPREIT has been focusing on sustainability initiatives, including energy-efficient upgrades and green building practices, which can lead to lower operating costs and appeal to environmentally conscious tenants.
4) CT REIT (CRT.UN)
CT Real Estate Investment Trust (CT REIT) (CRT.UN) is a Canadian-based closed-end real estate investment trust that focuses on owning and operating a portfolio of retail properties across Canada. Primarily anchored by Canadian Tire stores, CT REIT’s portfolio includes a mix of retail, mixed-use, and distribution centers. The trust’s strategic relationship with Canadian Tire Corporation provides a unique advantage in terms of tenant stability and portfolio focus.
Strengths
Strong Anchor Tenant: The majority of CT REIT’s properties are leased to Canadian Tire Corporation, one of Canada’s most recognized and established retail brands. This relationship provides a stable base of rental income and reduces the risk of significant vacancy rates.
Diverse Property Portfolio: Despite the strong association with Canadian Tire, CT REIT also owns and operates a variety of other retail and mixed-use properties, contributing to income diversification.
Strategic Growth Initiatives: CT REIT has demonstrated a capacity for strategic growth through the acquisition and development of new properties, as well as the expansion and improvement of existing ones, enhancing the overall value of its portfolio.
Long-Term Leases: Many of CT REIT’s leases are long-term agreements, which provides income stability and reduces the risk associated with tenant turnover.
Geographical Spread: With properties across various regions in Canada, CT REIT benefits from a broad market presence, mitigating the impact of regional economic fluctuations.
5) H&R REIT
H&R Real Estate Investment Trust (H&R REIT) is one of Canada’s largest diversified real estate investment trusts. H&R REIT’s portfolio spans a broad range of asset classes, including office, retail, industrial, and residential properties across Canada and the United States. This diversification across both geography and property types is a cornerstone of H&R REIT’s strategy, aiming to provide unitholders with stable and growing cash distributions by owning a diversified, growth-oriented portfolio.
Strengths
Diversified Portfolio: H&R REIT’s diversified asset base across various sectors—office, retail, industrial, and residential—helps mitigate the risk associated with any single market or economic sector. This diversification is a key strength, particularly in volatile market conditions.
Geographical Presence: With properties in both Canada and the United States, H&R REIT benefits from a broad market presence, which allows for capitalizing on different economic cycles and real estate markets in North America.
Scale and Scope: As one of Canada’s largest REITs, H&R has significant scale advantages, including access to capital, operational efficiencies, and the ability to engage in larger transactions that may not be accessible to smaller entities.
Experienced Management: H&R REIT benefits from an experienced management team with a proven track record in property management, acquisitions, and navigating the complexities of the real estate markets in North America.
Adaptive Strategy: H&R REIT has shown adaptability in its strategy, such as repositioning its portfolio by divesting non-core assets and focusing on high-growth areas, which can enhance long-term unitholder value.
In this post, we will review a popular index ETF on the TSX: the Vanguard S&P500 Canadian Hedge (VSP ETF). We will first explain what’s an index ETF. Then, we will discuss VSP’s historical performance, fees and holdings. Finally, we will compare VSP against similar ETFs.
There are several types of ETFs. Index ETFs are the king of the hill. The first-ever ETF introduced to a North American Exchange was an index ETF. Index ETFs offer exposure to many securities and sometimes to a whole stock exchange at a meager cost. Their main goal is to acquire, on your behalf, all the securities that constitute a specific index to achieve the same return of the tracked index minus the fees.
One significant advantage of owning an index ETF is low fees. The manager is simply replicating the index’s performance either by acquiring directly or indirectly (using derivatives) the constituents of the index. There is no additional effort involved in the selection process, thus no need to generously compensate the portfolio manager. It might also be pertinent to know that empirical studies have consistently shown that active portfolio managers rarely beat the S&P 500 index in the long term. In other words, only a few managers can outguess the market in the long run.
VSP ETF Investment objective
Vanguard S&P 500 Index Canadian Hedge ETF seeks to track the performance of a broad U.S. equity index that measures the investment return of large-capitalization U.S. stocks. The S&P 500 Index, or the Standard & Poor’s 500 Index, is a market-capitalization-weighted index of the 500 largest publicly-traded companies in the U.S.
The S&P 500 is an excellent index because most of its constituents are large, established US corporations. Besides, It’s well-diversified across various sectors of the US economy. The S&P 500 is widely regarded as the best gauge of large-cap U.S. equities. It can be easily used to express an opinion on the US economy in general. In other words, if you are bullish on the performance of the American economy in the long term, it’s probably the best index for you.
What’s a Canadian hedge ETF?
When the manager has to replicate a U.S. index such as the S.P. 500 or the Nasdaq 100. It must acquire these assets in U.S. dollars. So, on a fairly regular basis, the fund has to convert the funds available in Canadian dollars into U.S. dollars. These conversions may be beneficial or have a negative impact depending if the Canadian dollar has appreciated or depreciated.
Many investors want to reduce this risk. To meet their needs, the majority of ETFs that reproduce a U.S. index offer a “hedged” version of their funds and sometimes another version that is traded only in U.S. dollars. Coverage acts as a kind of insurance. See the scenarios presented below:
VSP, ZUE and XSP have very low MER. Considering the quality of the portfolio of securities held by these ETFs, the low MER makes them very attractive to investors.
VSP is slightly ahead in terms of long-term performance. However, since all three ETFs track the same index and it’s understandable they will have very close performance.
VSP ETF: Morningstar rating
Rating: 3 out of 5.
VSP Dividend history
Type
Ex-div Date
Payment Date
Cash Distrib per Unit
Income
29 Jun 2022
08 Jul 2022
$0.207999
Income
24 Mar 2022
01 Apr 2022
$0.176667
Income
30 Dec 2021
10 Jan 2022
$0.247884
Capital Gains (ETFs)
30 Dec 2021
10 Jan 2022
$0.000000
Income
29 Sep 2021
08 Oct 2021
$0.201278
please consult issuers website for up-to-date data
VSP ETF Holdings
Holding Name
% of Market Value
Apple Inc.
6.63%
Microsoft Corp.
6.06%
Amazon.com Inc.
2.93%
Alphabet Inc. Class A
2.06%
Alphabet Inc. Class C
1.90%
Tesla Inc.
1.78%
Berkshire Hathaway Inc. Class B
1.55%
UnitedHealth Group Inc.
1.52%
Johnson & Johnson
1.47%
NVIDIA Corp.
1.19%
please consult issuers website for up-to-date data
please consult issuers website for up-to-date data
An Exchange Traded Fund (ETF) is a financial instrument traded on stock exchanges, managed by professional fund managers. In Canada, various issuers offer ETFs, including prominent banks such as BMO and TD, as well as investment companies like Vanguard and iShares.
With over 1000 ETFs presently accessible in the market, investors have a wide array of options. These funds cater to diverse investment preferences and risk appetites, making them suitable for both active and passive management strategies. Whether an investor seeks broad market exposure or specific sector focus, there’s likely an ETF designed to meet their unique needs within the expansive ETF landscape.
What is an index fund?
There are several types of ETFs. And index ETFs are the most popular in the financial markets. In fact, the first ETF to be launched on the North American stock exchange was an index ETF. Index ETFs offer exposure to a large number of securities and sometimes to a whole stock market at a very low cost. Their main objective is to acquire, on your behalf, all securities that constitute a specific index in order to obtain the same return of the index minus management fees.
S.P. 500 Index
The S&P 500 Index, or the Standard & Poor’s 500 Index, is a market-capitalization-weighted index of the 500 largest publicly-traded companies in the U.S.
The S&P 500 is an excellent index because most of its constituents are large established US corporations. It’s well diversified across various sectors of the US economy. The index is widely regarded as the best gauge of large-cap U.S. equities. It can be easily used to express an opinion on the US economy in general. In other words, if you are bullish on the performance of the American economy in the long term, it’s probably the best index for you.
All ETFs that replicate the performance of the S.P. 500 index will have the same securities in their assets and at about the same proportions as the index itself.
The Nasdaq 100
The Nasdaq-100 is one of the world’s preeminent large-cap growth indexes. It includes 100 of the largest domestic and international non-financial companies listed on the Nasdaq Stock Market based on market capitalization.
This index is dominated by companies in the Information Technology sector.
S&P/TSX 60
An index of the 60 largest companies on the Toronto Stock Exchange. This index is dominated by the energy and finance sectors.
What’s a Dividend ETF?
A Dividend ETF is an Exchange Traded Fund specifically designed to invest in a diversified portfolio of dividend-paying stocks. Dividend-paying stocks are shares of companies that distribute a portion of their profits back to shareholders in the form of dividends.
The primary objective of a Dividend ETF is to provide investors with a steady income stream through the regular payment of dividends. These funds typically focus on selecting stocks of companies that have a history of paying consistent and reliable dividends. Dividend ETFs may include stocks from various sectors and industries, and they often follow an index that emphasizes high dividend-yielding stocks.
Investing in a Dividend ETF can be attractive for income-oriented investors who seek a combination of capital appreciation and a steady flow of income. Additionally, these ETFs may offer diversification benefits by holding a basket of dividend-paying stocks, spreading risk across different sectors and companies.
Dividend: Tax implications for owning ETFs
There are so many possible structures for an ETF. Below, we will discuss mainly three common structures:
if held in an investment account (non registered)
Type 1: Canadian ETFs that invest in US or international stocks directly. There is 15% withholding tax that will impact the fund’s return;
Type 2: Canadian ETFs that invest in US ETFs which invests in US stocks. There is 15% withholding tax that will impact the fund’s return;
Type 3: Canadian ETFs that invest in US listed ETFs which invest in international stock. This is the structure that’s the least interesting for investors from a taxation perspective. 2 Taxes will be applied by the foreign country first and then the US.
if held in registered account: TFSA, RESP, RRSP
Canadian ETF: 1$ dividend scenario
Taxes
Dividend received
1- Holding US or International stocks directly
-0.15$ (withholding tax from US or foreign jurisdiction) Creditable
0.85$
2- Holding US listed ETFs that invest in US stocks
-0.15$ (withholding tax from US or foreign jurisdiction) Creditable
0.85$
3- Holding US listed ETFs that invest in International stocks
-0.15$ (withholding tax from foreign jurisdiction) Non creditable -0.13 (withholding tax from US) Creditable
ZXM.TO : CI Morningstar International Momentum Index Common Units (CAD Hedged)
ZZZD.TO : BMO Tactical Dividend Fund
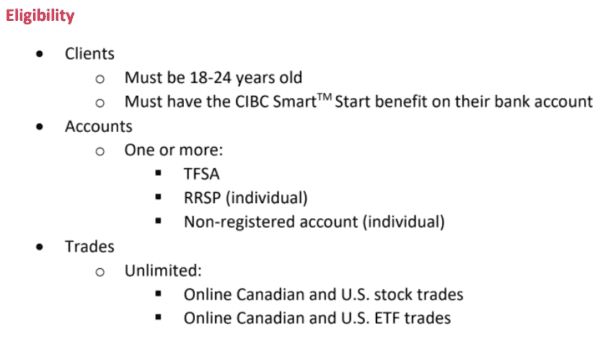
With CIBC’s new investor-friendly offer, you’ll have no more excuses to start building your wealth. Indeed, 18-24 year olds who apply for this offer will be able to benefit from:
Free online trading of Canadian and US stocks and ETFs. Save on the regular price of 6.95;
No administration fees for registered and non-registered accounts. It’s $200 up to that you save;
No minimum balance to maintain.
Summary of the Offer
Visit CIBC’s Investor’s Edge Website to take advantage of this offer
With its exclusive advantages, you can invest with peace of mind knowing that you are dealing with a major Canadian bank. Indeed, CIBC pro-investor is known for:
1 – Free investment research tools!
If you are new to investing or have little investment knowledge, there are several resources available to you within CIBC’s pro-investor brokerage platform. Indeed, the platform hosts a wide range of research, tools and educational resources.
2 – Quick and easy account opening
The process of opening a new account can be done entirely online. They also have agents available by phone, chat, and email if you need help. They guide you through the process of creating an account, transferring money and your first transaction.
3 -Security
CIBC is one of the largest banks in North America and one of the top five in Canada. CIBC Investor’s Edge is a division of CIBC Investor Services Inc., a subsidiary of CIBC. CIBC Investor Services Inc. is a member of the Canadian Investor Protection Fund (CIPF) and the Investment Industry Regulatory Organization of Canada (IIROC).
4 – A quality mobile application
The CIBC Investor ‘s Edge mobile app offers users a convenient way to monitor account balances and trade stocks, ETFs, options and more anytime, from anywhere. Users can also stay informed about important investment news, such as new IPOs, so they can take advantage of new opportunities as they arise.
Users will also have access to charts and tables to help them analyze their entire portfolio in one easy-to-read view, or review different investment accounts separately.
5 -Type of accounts offered
You can open all major investment accounts using CIBC Investor’s Edge, including:
Step 1 – Open a chequing account with CIBC Smart™ Start • Get a bank account with no monthly fees and unlimited transactions • Open an account at the Banking Center (starting April 18) or online (starting May)
Step 2 – Open a CIBC Investor’s Edge account • Choose from TFSA, RRSP and non-registered account • Open an account at the Banking Center or online