Covered call ETFs have become extremely popular among Canadian investors looking for higher monthly income and more predictable cash flow. Many of these ETFs now manage billions of dollars in assets as investors search for alternatives to traditional dividend investing.
By selling call options on their holdings, these ETFs can generate significantly higher yields than regular dividend ETFs — with some funds now paying more than 10% annually.
The main advantages of covered call ETFs include:
- Higher monthly income
- Reduced volatility
- More consistent cash flow
However, there is an important trade-off: covered call strategies often sacrifice part of the upside during strong bull markets in exchange for higher income today.
In this article, we’ll compare the best covered call ETFs in Canada for 2026, including:
- the top diversified covered call ETFs,
- the best bank and technology covered call ETFs,
- and which funds currently offer the best balance between yield, performance, and long-term portfolio stability.
We’ll also highlight our top ETF picks for income-focused Canadian investors.

Executive summary
List of Best Covered Call ETF in Canada
Covered Call ETFs Ranked by AUM (High to Low)
| Ticker & Fund Name | MER Category | AUM |
|---|---|---|
| ZWB – BMO Covered Call Canadian Banks | Low | $4.21B |
| ZWC – BMO CDN High Div Covered Call | Low | $2.28B |
| HMAX – Hamilton Canadian Financials Yield Maximizer | Medium | $2.25B |
| HDIV – Hamilton Enhanced Multi-Sector Covered Call | High | $1.59B |
| HYLD – Hamilton Enhanced U.S. Covered Call ETF | High | $1.12B |
| ZWP – BMO Europe High Div Cov Call | Low | $1.10B |
| ZWH – BMO US High Dividend Covered Call | Low | $1.08B |
| HBF – Harvest Brand Leaders Plus Income | Medium | $881M |
| HTA – Harvest Tech Achievers Growth & Inc | Medium | $879M |
| HDIF – Harvest Diversified Monthly Income ETF | High | $524M |
| ZWK – BMO Covered Call US Banks | Medium | $330M |
Performance and dividend yield comparison
| Div Yield | 1 Yr | 3 Yrs | 5 Yrs | |
| ZWB | 5.04% | 53.29% | 22.87% | 14.20% |
| ZWC | 5.62% | 31.10% | 14.77% | 11.83% |
| ZWP | 6.28% | 16.00% | 11.23% | 10.89% |
| ZWH | 6.10% | 21.84% | 11.15% | 10.15% |
| ZWK | 6.43% | 37.41% | 23.53% | 5.64% |
| HTA | 8.93% | 34.60% | 23.70% | 14.49% |
| HBF | 7.52% | 26.35% | 12.64% | 7.40% |
| HDIF | 10.57% | 27.43% | 15.68% | na |
| HDIV | 9.68% | 48.14% | 24.25% | na |
| HMAX | 11.89% | 37.86% | 19.14% | na |
| HYLD | 12.12% | 37.78% | 20.85% | na |
as of May 14th 2026 – Source Yahoo finance – Performance = Total return incl. Dividends
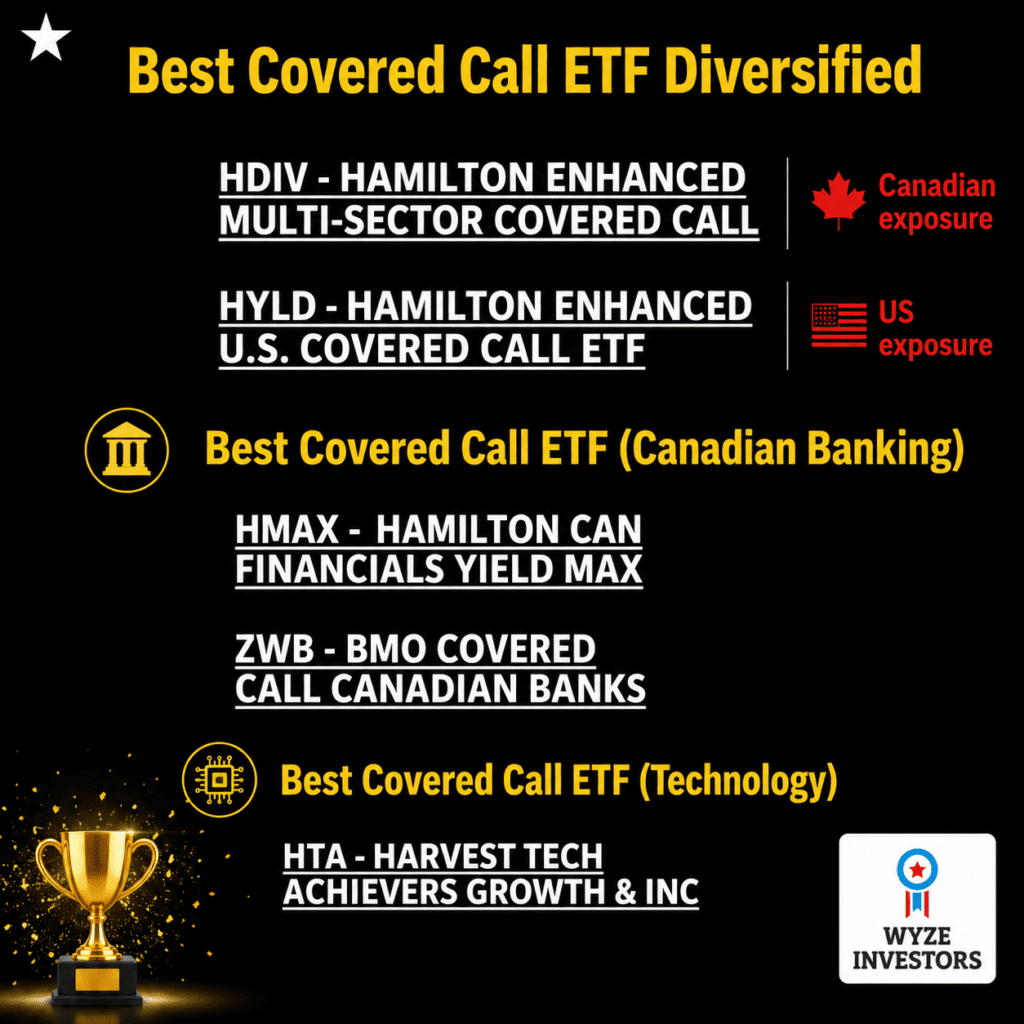
Best Diversified Covered Call ETFs
HDIV – Best Overall Diversified Covered Call ETF
HDIV (Hamilton Enhanced Multi-Sector Covered Call ETF) remains one of the strongest all-around covered call ETFs available on the TSX today.
What makes HDIV stand out is its diversified “ETF-of-ETFs” structure. Instead of relying on a single sector, HDIV invests across several covered call sectors including:
- Canadian financials
- Utilities
- Energy
- Healthcare
- Technology
- Infrastructure
The ETF also uses approximately 25% leverage to enhance both yield and total return potential.
HDIV Performance (As of May 14th, 2026)
- Dividend Yield: 9.68%
- 1-Year Total Return: 48.14%
- 3-Year Total Return: 24.25%
HDIV has delivered one of the strongest combinations of income and performance among Canadian covered call ETFs. Despite paying a very high monthly distribution, the ETF has still generated strong capital appreciation over the past several years.
For investors looking for a “one-ticket” diversified income ETF, HDIV is arguably the best choice currently available in Canada.
HYLD – Best U.S. Covered Call ETF for Canadians
HYLD (Hamilton Enhanced U.S. Covered Call ETF) is designed for investors who want broad U.S. market exposure combined with very high monthly income.
Like HDIV, HYLD uses modest leverage (approximately 25%) to enhance yield and returns. However, HYLD focuses specifically on diversified U.S. covered call ETFs, giving investors exposure to some of the largest and most innovative companies in the world.
HYLD Performance (As of May 14th, 2026)
- Dividend Yield: 12.12%
- 1-Year Total Return: 37.78%
- 5-Year Total Return: 20.85%
One major advantage of HYLD is simplicity. Instead of building a portfolio of multiple U.S. income ETFs, HYLD packages everything into one diversified solution.
Many investors assume covered call ETFs cannot produce strong long-term returns because the strategy caps upside during bull markets. However, HYLD’s performance shows that diversified covered call strategies can still generate attractive total returns while paying double-digit yields.
For Canadian investors seeking exposure beyond Canada’s banking and energy sectors, HYLD can play a very important role inside an income portfolio.
HDIF – Best Conservative Diversified Covered Call ETF
HDIF (Harvest Diversified Monthly Income ETF) is ideal for investors who want diversification and high monthly income without the added volatility that comes with leverage.
Unlike HDIV and HYLD, HDIF does not use leverage to boost returns. This makes it potentially more attractive for retirees and conservative investors seeking a smoother investment experience.
The ETF spreads investments across multiple sectors including:
- Financials
- Utilities
- Healthcare
- Technology
- Global brand leaders
HDIF Performance (As of May 14th, 2026)
- Dividend Yield: 10.57%
- 1-Year Total Return: 27.43%
- 3-Year Total Return: 15.68%
Although HDIF has slightly lower total returns compared to HDIV, many investors appreciate its more conservative structure.
The ETF still delivers:
- double-digit income,
- broad diversification,
- and monthly cash flow,
while potentially reducing some of the risks associated with leveraged covered call strategies.
Final Thoughts
Diversified covered call ETFs can be powerful tools for generating passive income while maintaining exposure to equity markets. However, investors should remember that higher yields often come with trade-offs such as capped upside, leverage risk, or reduced long-term growth compared to traditional index ETFs.
Still, funds like HDIV, HYLD, and HDIF have shown that covered call ETFs can deliver both strong income and competitive total returns when used properly.
For many Canadian investors, combining diversified covered call ETFs with traditional index ETFs may provide the best balance between income, growth, and long-term portfolio stability.
Best Sector-Focused Covered Call ETFs in Canada (2026)
While diversified covered call ETFs provide broad market exposure, many Canadian investors still prefer sector-focused covered call ETFs to target industries with strong dividend potential and consistent cash flow generation.
In Canada, banking and technology remain the two dominant sectors for covered call ETF investors. Canadian banks continue to generate reliable dividends and stable earnings, while technology ETFs offer a unique combination of growth potential and monthly income.
Here are the best sector-focused covered call ETFs in Canada for 2026 based on yield, total return performance, and long-term investment potential.
ZWB – Best Canadian Bank Covered Call ETF
The BMO Covered Call Canadian Banks ETF remains the benchmark covered call ETF for Canadian bank exposure. Built around Canada’s Big Six banks, ZWB combines high-quality dividend-paying financial institutions with a covered call overlay designed to generate additional monthly income and reduce volatility.
For many investors, ZWB represents one of the safest and most reliable covered call ETF strategies available on the TSX.
ZWB Performance (As of May 14th, 2026)
- Dividend Yield: 5.04%
- 1-Year Total Return: 53.29%
- 3-Year Total Return: 22.87%
- 5-Year Total Return: 14.20%
The recent performance has been extremely strong, benefiting from the recovery in Canadian financial stocks and higher interest rate environments supporting bank profitability.
One of ZWB’s biggest advantages is stability. Canadian banks have historically demonstrated resilient earnings, strong dividend growth, and relatively lower volatility compared to many other equity sectors.
For investors seeking dependable monthly income with long-term exposure to Canada’s financial sector, ZWB remains one of the best core covered call ETFs available today.
HMAX – Highest Yield Canadian Bank Covered Call ETF
For investors prioritizing maximum monthly income, HMAX (Hamilton Canadian Financials Yield Maximizer ETF) continues to stand out.
Unlike traditional bank covered call ETFs, HMAX uses an enhanced yield strategy that combines aggressive covered call writing with modest leverage to generate exceptionally high distributions.
HMAX Performance (As of May 14th, 2026)
- Dividend Yield: 11.89%
- 1-Year Total Return: 37.86%
- 3-Year Total Return: 19.14%
HMAX has rapidly become popular among income-focused investors because of its massive monthly distributions. However, investors should understand the trade-offs involved.
Higher yield strategies often come with:
- increased volatility,
- reduced upside participation during strong bull markets,
- and greater sensitivity during market corrections.
That said, HMAX has still delivered very strong total returns alongside double-digit income. For investors comfortable with a more aggressive income strategy focused on Canadian financials, HMAX remains one of the most attractive high-yield covered call ETFs in Canada.
HTA – Best Technology Covered Call ETF
The Harvest Tech Achievers Growth & Income ETF) continues to be one of the best examples of a successful “growth + income” covered call ETF strategy.
Technology stocks are traditionally associated with growth rather than income. However, HTA combines exposure to major global technology leaders with a covered call overlay to generate monthly cash flow while still participating in long-term tech sector growth.
HTA Performance (As of May 14th, 2026)
- Dividend Yield: 8.93%
- 1-Year Total Return: 34.60%
- 3-Year Total Return: 23.70%
- 5-Year Total Return: 14.49%
Even with covered calls partially capping upside, HTA has delivered impressive long-term performance while maintaining a very attractive yield.
The ETF provides exposure to many of the world’s largest technology companies, making it appealing for investors who:
- want exposure to AI and technology trends,
- prefer monthly income,
- and seek lower volatility than owning individual tech stocks directly.
For investors who want to combine technology exposure with passive income generation, HTA remains one of the strongest covered call ETFs available on the TSX.
ZWK – U.S. Bank Covered Call ETF
ZWK (BMO Covered Call U.S. Banks ETF) offers investors targeted exposure to major U.S. financial institutions while generating enhanced income through covered call writing.
The ETF provides diversification beyond Canadian banks and gives exposure to some of the largest banking institutions in the United States.
ZWK Performance (As of May 14th, 2026)
- Dividend Yield: 6.43%
- 1-Year Total Return: 37.41%
- 3-Year Total Return: 23.53%
- 5-Year Total Return: 5.64%
ZWK’s recent short-term performance has improved significantly compared to prior years, helped by the recovery in U.S. financial stocks and stronger banking sentiment.
However, over longer periods, Canadian bank covered call ETFs such as ZWB have generally delivered stronger consistency and long-term stability.
Still, ZWK can play a useful role for investors seeking:
- geographic diversification,
- exposure to U.S. financial institutions,
- and additional monthly income outside Canada.
hly cash flow, diversification, and exposure to sectors that tend to drive returns.
Dividend frequency: Best Covered Call ETF Canada
| Frequency | |
| ZWB | Monthly |
| ZWC | Monthly |
| ZWP | Monthly |
| ZWH | Monthly |
| ZWK | Monthly |
| HTA | Monthly |
| HBF | Monthly |
| LIFE | Monthly |
| HDIF | Monthly |
| HDIV | Monthly |
| HMAX | Monthly |
Review of UMAX: Hamilton Utilities Yield Maximizer ETF (13% Target yield)
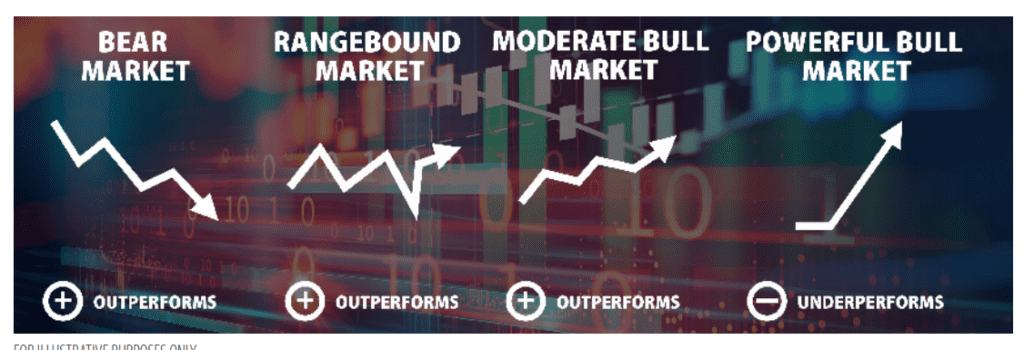
How had Covered call ETF’s performed historically?
In historical contexts characterized by bear markets, range-bound markets, and moderate bull markets, a covered call strategy has typically demonstrated the ability to outperform its underlying securities. However, during robust bull markets, when the underlying securities experience frequent rises beyond their strike prices, covered call strategies have historically exhibited slower growth. Nevertheless, even in these bullish phases, investors typically realize moderate capital appreciation alongside the accrual of dividends and call premiums.
Popular Covered Call ETFs in Canada
| ETF | Focus / Objective | Sectors / Geography | Investor Appeal |
|---|---|---|---|
| ZWB – BMO Covered Call Canadian Banks | Canadian banks + call premiums | 100% Canadian Big 6 banks | Stable, income-focused play on Canadian banks |
| ZWC – BMO Canadian High Dividend CC | Broad Canadian high dividend portfolio | Financials & Energy = ~53% | Conservative, tax-efficient, steady monthly income |
| ZWP – BMO Europe High Dividend CC | European dividend payers + options | Switzerland, Germany, UK, France | Diversifies income outside North America |
| ZWH – BMO U.S. High Dividend CC | U.S. large-cap dividend names | Broad U.S. exposure, ~23% Tech | U.S. exposure with yield + lower volatility |
| ZWK – BMO Covered Call U.S. Banks | U.S. banking sector | 100% U.S. banks (~38 names) | Higher yield (~6%), targeted U.S. financials |
| HTA – Harvest Tech Achievers | Global tech leaders + covered calls | Heavy in semis + software | Tech growth exposure with reduced volatility |
| HBF – Harvest Brand Leaders | 20 global “top brands” | ~20% Financials, 20% Tech, 15% Comm. Services | Blue-chip global exposure, monthly distributions |

ZWB – BMO Covered Call Canadian Banks
The ZWB aims to provide exposure to a portfolio of dividend-paying securities (Canadian Banks), while collecting premiums related to call options. The portfolio is chosen on the basis of the criteria below:
• dividend growth rate; • yield; • payout ratio and liquidity.
ZWB holdings
| Name | Weight |
| BMO Equal Weight Banks ETF | 27.2% |
| Bank of Montreal | 12.9% |
| Canadian Imperial Bank of Commerce | 12.7% |
| Royal Bank of Canada | 12.1% |
| National Bank of Canada | 11.9% |
| The Toronto-Dominion Bank | 11.9% |
| Bank of Nova Scotia | 11.4% |
ZWC –BMO CDN High Div Covered Call
The BMO Canadian High Dividend Covered Call ETF (ZWC) has been designed to provide exposure to a dividend focused portfolio, while earning call option premiums. The underlying portfolio is yield-weighted and broadly diversified across sectors.
The fund selection methodology uses 4 factors: – Liquidity; – Dividend growth rate; – Yield and payout ratio.
ZWC is an excellent option for conservative investors looking for a steady income and low volatility. It’s tax-efficient because the dividends are all coming from Canadian companies. The financial sector and Energy represents 53% of the total overall sector allocation.
ZWC ETF Holdings
| Company Name | Allocation |
|---|---|
| Canadian National Railway Co | 5.4% |
| BCE Inc | 5.2% |
| TELUS Corp | 5.1% |
| Enbridge Inc | 5.0% |
| Royal Bank of Canada | 5.0% |
| Canadian Imperial Bank of Commerce | 4.9% |
| Bank of Nova Scotia | 4.7% |
| The Toronto-Dominion Bank | 4.6% |
| Manulife Financial Corp | 4.3% |
ZWP – BMO Europe High Dividend Covered Call ETF
The BMO Europe High Dividend Covered Call ETF (ZWP) has been designed to provide exposure to a dividend focused portfolio. These dividend paying companies are selected based on:
- dividend growth rate,
- yield,
- payout ratio and liquidity.
ZWP Dividend ETF Holdings
| Company Name | Allocation |
|---|---|
| Roche Holding AG | 4.0% |
| Nestle SA | 4.0% |
| Novartis AG | 4.0% |
| GlaxoSmithKline PLC | 4.0% |
| Sanofi SA | 3.8% |
| TotalEnergies SE | 3.7% |
| Unilever PLC | 3.7% |
| Enel SpA | 3.7% |
Geographic allocation
| Countries | Weight |
| Switzerland | 23.66% |
| Germany | 24.24% |
| United Kingdom | 18.76% |
| France | 16.72% |
| Other (multiple countries) | 16.62% |
Sector allocation
| Type | Fund |
| Information Technology | 6.22 |
| Industrials | 12.18 |
| Consumer Discretionary | 11.56 |
| Consumer Staples | 11.78 |
| Health Care | 16.56 |
| Financials | 14.79 |
| Materials | 9.48 |
| Communication | 8.10 |
| Energy | 3.89 |
| Utilities | 3.66 |
ZWH – BMO US High Dividend Covered Call ETF
ZWH has been designed to provide exposure to a dividend focused portfolio, while earning call option premiums. The underlying portfolio is yield-weighted and broadly diversified across sectors. The Fund utilizes a rules-based methodology that considers the following criteria:
dividend growth rate,
yield,
payout ratio,
liquidity.
ZWH Dividend ETF Holding
| Company Name | Allocation |
|---|---|
| Apple Inc | 4.2% |
| Microsoft Corp | 4.2% |
| Coca-Cola Co | 4.1% |
| AbbVie Inc | 4.1% |
| The Home Depot Inc | 4.1% |
| Procter & Gamble Co | 4.1% |
| Pfizer Inc | 4.0% |
Geographic allocation
| Country | Fund |
| USA | 100.0% |
Sector allocation
| Sector | Fund |
| Information Technology | 22.61% |
| Industrials | 8.39% |
| Consumer Discretionary | 10.06% |
| Health Care | 12.40% |
| Financials | 15.50% |
| Materials | 4.36% |
| Communication | 9.58% |
| Consumer Staples | 7.35% |
| Energy | 3.86% |
| Utilities | 3.84% |
| Real estate | 2.05% |
Please consult issuers’ website for up-to-date figures
ZWK -BMO Covered Call US Banks
The BMO Covered Call U.S. Banks ETF (ZWK) is professionally managed by BMO Global Asset Management. The fund has been designed to provide exposure to a portfolio of U.S. banks while earning call option premiums.
The fund invests in 38 US Banks. It’s ideal for investors looking for dividend income. The dividend yield on November 24th was 6.19%!
The fact that the fund uses call options accomplishes two things:
- increases the dividend yield;
- reduces volatility but also growth potential. So, it’s something to keep in mind.
| Weight (%) | Name |
|---|---|
| 5.86% | SIGNATURE BANK/NEW YORK NY |
| 5.58% | CITIZENS FINANCIAL GROUP INC |
| 5.55% | REGIONS FINANCIAL CORP |
| 5.52% | AMERIPRISE FINANCIAL INC |
| 5.52% | M&T BANK CORP |
| 5.46% | SVB FINANCIAL GROUP |
| 5.43% | KEYCORP |
| 5.41% | TRUIST FINANCIAL CORP |
| 5.40% | FIFTH THIRD BANCORP |
| 5.38% | BMO EQUAL WEIGHT US BANKS INDEX ETF |
HTA -Harvest Tech Achievers Growth & Income
HTA is an ETF that invests in an equally weighted portfolio of 20 large-cap technology companies (globally). In order to generate an enhanced monthly distribution yield, an active covered call strategy is engaged.
Covered call strategies are great as they generate additional income for investors (in the form of premiums). The strategy is somewhat conservative and aims at preserving the capital invested primarily. On the other hand, the strategy limits potential growth.
| Name | Weight | Sector |
|---|---|---|
| NVIDIA Corporation | 6.9% | Semiconductors |
| Advanced Micro Devices, Inc. | 6.5% | Semiconductors |
| QUALCOMM Inc | 6.5% | Semiconductors |
| Intuit Inc. | 5.5% | Software |
| Apple Inc. | 5.3% | Technology Hardware |
| Applied Materials | 5.2% | Semiconductors |
| Keysight Technologies | 5.2% | Electronic Equipment |
| Broadcom Inc. | 5.1% | Semiconductors |
| Microsoft Corp | 5.1% | Software |
| Adobe Inc. | 5.0% | Software |
HBF – Harvest Brand Leaders Plus Income
HBF is an equally weighted portfolio of 20 large companies selected from the world’s Top 100 Brands. The ETF is designed to provide a consistent monthly income stream with an opportunity for growth. In order to generate an enhanced monthly distribution yield, an active covered call strategy is engaged.
HBF Holding details
| Company Name | Allocation |
|---|---|
| JPMorgan Chase & Co | 5.4% |
| Royal Dutch Shell PLC ADR Class A | 5.3% |
| McDonald’s Corp | 5.3% |
| Alphabet Inc Class A | 5.2% |
| Microsoft Corp | 5.2% |
| Citigroup Inc | 5.1% |
| The Walt Disney Co | 5.1% |
HBF Sector breakdown
| Sector | % Allocation |
|---|---|
| Financial Services | 20.2% |
| Technology | 20.1% |
| Comm. Services | 15.3% |
HDIF -Harvest Diversified Monthly Income ETF
HDIF is a relatively new fund from Harvest ETFs (created on Feb 2022). It’s a covered call ETF and its main target audience are income/dividend investors.
HDIF is a fund of funds. It means this ETF invests in other ETFs to provide investors with diversification across various sectors of the economy ( Healthcare, Global Brands, Technology, Utilities, and US Banks). The primary objective is to provide a higher yield than traditional dividend ETFs by using a covered call strategy.
Additional facts about HDIF:
– The portfolio is reconstituted and rebalanced quarterly (minimum);
– The covered call strategy is applied on up to 33% of each equity securities held in underlying portfolios.
Sector allocation
| Sector | % Allocations |
|---|---|
| Financial Services | 31.8% |
| Healthcare | 21.8% |
| Technology | 23.4% |
| Comm. Services | 15.0% |
| Utilities | 13.7% |
HDIF ETF review: Portfolio
| ETF | Allocation |
|---|---|
| HUTL Harvest Equal Weight Glbl Utilts Inc | 20.5 |
| HHL Harvest Healthcare Leaders Inc | 20.3 |
| HBF Harvest Brand Leaders Plus Inc | 20.7 |
| HUBL Harvest US Bank Leaders Income Cl A | 20.7 |
| HTA Harvest Tech Achievers Gr&Inc | 20.7 |
| HLIF Harvest Canadian Equity Income Leaders ETF | 23.3 |
| Cash and other Liabilities | (26.2) |
Please visit issuers’ website for most up-to-date data
HDIV -Hamilton Enhanced Multi-Sector Covered Call
HDIV is a passive covered call ETF. It’s ideal for investors who seek high dividend income and low volatility. HDIV invests in a basket of 7 covered call & sector focus ETFs. The fund manager uses also cash leverage of 25% to enhance yield and growth potential. The index tracked is The Solactive Multi-Sector Covered Call ETFs Index TR x 1.25.
The ETFs held within HDIV invest primarly in large corporations. In addition to using the covered call strategy, the funds ensure diversification of your investments across various sectors. See below the list of the 7 ETFs that make up HDIV:
| HEP – Horizons Enhanced Income Gold Producers |
| NXF – CI Energy Giants Covered Call |
| ZWU – BMO Covered Call Utilities |
| HHL – Harvest Healthcare Leaders Income |
| FLI – CI U.S. & Canada Lifeco Income |
| ZWB – BMO Covered Call Canadian Banks |
| HTA – Harvest Tech Achievers Growth & Income |
All the funds that make up HDIV are covered call ETFs offered by various issuers such as: Harverst, BMO, CI Financial and Horizons.
Video HDIV overview
HMAX – Hamilton Canadian Financials Yield Maximizer
HMAX ETF is a new fund offered by Hamilton ETF. The fund invests in the Canadian banking sector. This fund aims to provide an attractive dividend yield (target 13%) using a covered call strategy. The strategy consists of writing call options on (50% of the portfolio) to collect premiums and maximize monthly distributions.
HMAX ETF Holdings
| NAME | WEIGHT |
| Royal Bank of Canada | 23.1% |
| Toronto-Dominion Bank | 20.5% |
| Bank of Montreal | 11.5% |
| Bank of Nova Scotia | 10.5% |
| Brookfield Corp | 10.0% |
| Canadian Imperial Bank of Commerce | 6.7% |
| Manulife Financial | 6.0% |
| Sun Life Financial | 4.8% |
| Intact Financial | 4.1% |
| National Bank of Canada | 4.1% |
HMAX ETF sector allocation
█ Asset Management 10.0%
█ Banks 76.4%
█ Insurance 14.9%
Video
HYLD – Hamilton Enhanced U.S. Covered Call ETF
Objective: Designed to provide attractive monthly income by investing in a diversified portfolio of U.S. equity covered call ETFs and applying modest leverage (25%) to enhance yield and growth potential.
Strategy:
Invests primarily in U.S.-focused covered call ETFs across different sectors (technology, healthcare, financials, etc.).
Uses covered call writing to generate option premiums.
Adds 25% cash leverage to boost distributions.
Investor Appeal: Suitable for Canadian investors seeking high monthly distributions from U.S. equities, while accepting capped upside and slightly higher risk due to leverage.
Q&A
Do covered call ETFs pay dividends?
Yes, Covered call ETF’s offer an excellent dividend yield. Their dividend yield is usually superior to ‘regular’ dividend ETF’s. Thanks to premiums collected issuing covered calls, the manager boost the fund distributions (Dividends plus Premiums), thus the dividend yield is usually high.
Some Covered Call ETFs use leverage to enhance returns even higher.
Do covered calls beat the market?
During market corrections, the answer would be probably yes. In essence, the covered call strategy is a convervative strategy that tends to forego profits for stability and income.
In a bull markets, covered call ETFs would have a lousy performance. A ‘regular’ dividend ETF would definitely perform better in bull market that a Covered call ETF.
If you are retired or close to retiring, a covered call ETF could be a better option for you. For young investors building wealth, covered call ETFs are not a good choice because they deprive their holders of growth perspective.
How risky is covered calls?
Covered call ETFs are generally low to medium risk funds. However, if the fund manager uses leverage, the fund would be considered medium to high risk.