Investment objective
The Global X Nasdaq-100 Covered Call ETF (QYLD) is one of the most popular income-oriented exchange-traded funds in the U.S. With a double-digit yield and the promise of monthly income, it attracts investors looking for consistent cash flow. But behind the headline yield, there are trade-offs that every investor should understand before buying.
This article provides a comprehensive review of QYLD, including how it works, its advantages, drawbacks, performance history, and whether it deserves a place in your portfolio. This post is available in Video format!

What Is QYLD?
QYLD was launched by Global X Funds in 2013. The fund is designed to provide high current income by using a covered call strategy on the Nasdaq-100 Index.
Here’s how it works:
QYLD buys all the stocks in the Nasdaq-100 (the same holdings as QQQ).
The fund then sells (“writes”) at-the-money call options on the Nasdaq-100 index.
The premiums collected from selling these options are distributed to shareholders as monthly dividends.
This strategy is often called a “buy-write” approach: you buy the index and simultaneously write calls against it.
Is QYLD a good investment?
Let’s break down the main benefits of holding QYLD:
Positives
Attractive Yield: QYLD consistently pays out yields in the 12–13% range, significantly higher than traditional dividend ETFs.
Monthly Income: Unlike many ETFs that pay quarterly, QYLD distributes income monthly — making it easier to plan cash flow for expenses.
Lower Volatility vs. QQQ: While it won’t fully protect against losses, the option premiums provide some cushion in choppy or declining markets.
Liquidity: With more than $6 billion in assets under management, QYLD trades with tight bid-ask spreads, making it accessible for retail and institutional investors alike.
Ease of Use: For investors who like the idea of covered calls but don’t want to manage options directly, QYLD offers a turnkey solution.
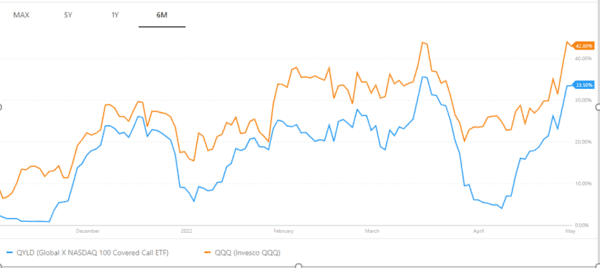
The charts highlight that QYLD generally exhibits lower volatility than the Nasdaq-100. By writing covered calls, the fund collects option premiums that help smooth out price swings. This makes QYLD less sensitive to sudden surges and corrections, offering investors a steadier ride compared to a pure growth index ETF.
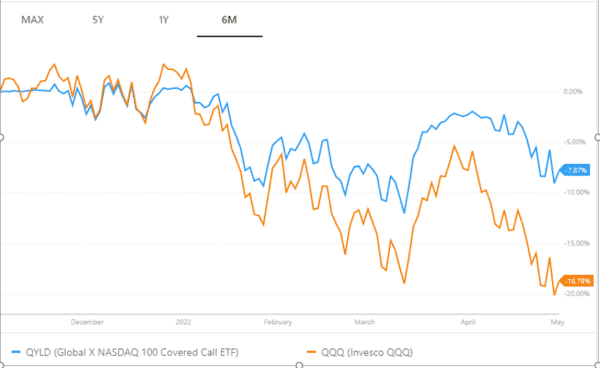
Over shorter horizons, this strategy shows its strengths in choppy or declining markets. The second chart illustrates how, during downturns, QYLD has been able to limit losses more effectively than the Nasdaq-100. The income from option premiums acts as a cushion, allowing the ETF to protect capital while still delivering monthly cash flow.
That said, the trade-off is visible during rising markets, where QYLD underperforms because its upside is capped. Investors benefit from more stability and reliable distributions, but they won’t fully capture the rallies of tech-heavy indices. In essence, QYLD prioritizes income and smoother performance over aggressive capital appreciation.
Negatives
Limited Growth Potential
Since QYLD writes at-the-money calls, it essentially sells away most of the upside from Nasdaq-100 rallies. When tech stocks soar, QYLD captures very little of that growth.
NAV Decay Over Time
The fund’s net asset value (NAV) tends to drift lower over the long term because option income often comes at the cost of capital appreciation. In other words, you get high income but sacrifice long-term wealth growth.
High Fees
QYLD charges an expense ratio of 0.60%, which is steep compared to plain index ETFs like QQQ (0.20%) or VOO (0.03%).
Dividend Sustainability Concerns
Distributions are largely driven by option premiums, which depend on market volatility. In calm markets, premiums are smaller, and dividends can shrink. Some payouts may also come from return of capital, which isn’t true “income.”
Concentration Risk
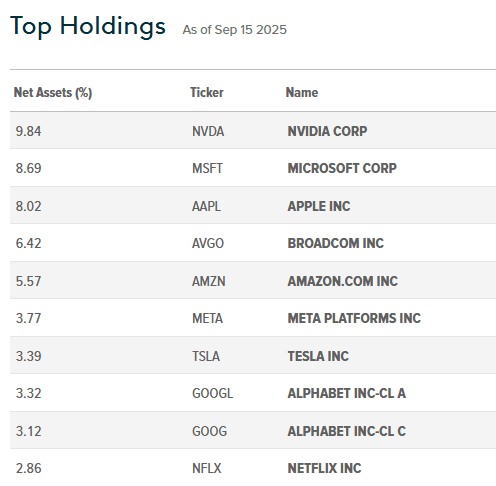
Like QQQ, QYLD is dominated by large tech companies such as Apple, Microsoft, Nvidia, and Amazon. While diversified within tech, it doesn’t provide broad sector exposure.
Performance QYLD
| ETF | Div Yld | |
|---|---|---|
| QYLD | 13.67% | – |
| QQQ | 0.71% |
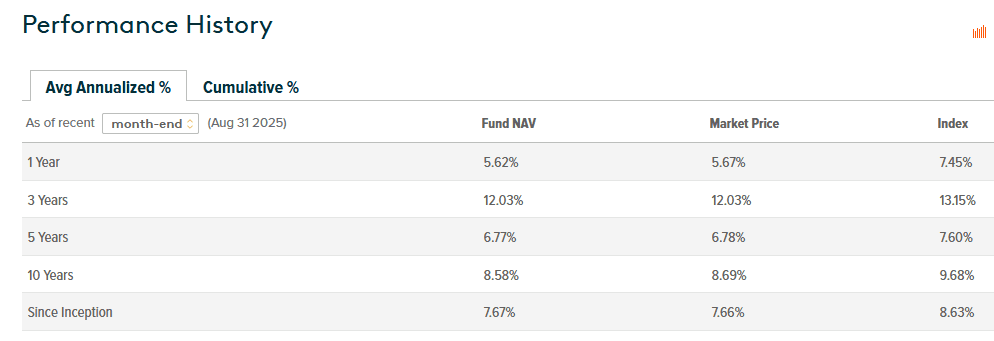
Over the past year, QYLD has delivered a total return of around 5.6%, reflecting modest gains supported primarily by its steady monthly income distributions. While its yield remains attractive, annual results can vary depending on market conditions and the premiums collected from selling options.
Looking at the medium term, performance has been uneven. The 3-year annualized return sits at 12.0%, boosted by periods of strong volatility, whereas the 5-year figure drops to 6.8%, showing how sensitive the strategy is to market cycles. QYLD tends to perform better in environments with heightened uncertainty where option premiums are larger.
Over longer horizons, QYLD has shown stable but moderate growth, with 8.6% annualized over 10 years and 7.7% since inception. This track record confirms its role as an income-driven product: consistent monthly cash flow with steady long-term returns, though without the explosive growth of pure equity strategies.
Is QYLD Sustainable? What is the risk of QYLD?
QYLD’s dividends come mainly from option premiums, which means payouts can vary with market volatility — often rising when uncertainty is higher. While this makes the income stream less predictable than traditional dividends, it also allows QYLD to maintain an attractive yield and steady monthly cash flow for income-focused investors. Over time, investors should expect less capital appreciation, since upside growth is traded for income, but for those prioritizing regular distributions and portfolio stability, QYLD can still be a reliable income-generating tool.
Is QYLD a monthly dividend
Yes, QYLD offers a monthly dividend distribution.
QYLD ETF Holdings
Practice example: covered call strategy
To better understand how QYLD’s strategy works, let’s look at a simple example. An investor owns 100 shares of Company A, priced at $30 each. Expecting the stock to stagnate or dip slightly, the investor sells a call option with:
- Strike price: $26
- Premium: $4
- Maturity: April
- Quantity: 100 shares
The investor collects $400 in option premiums (4 × 100). Two scenarios can occur:
| Scenario | Stock Price Outcome | Action | Result |
|---|---|---|---|
| Case 1 | Price rises above $30 (breakeven) | Buyer exercises the option → Seller must sell at $26 | • Shares sold below market value • $400 premium collected offsets loss • Effective sale price = $30 |
| Case 2 | Price falls below $30 (breakeven) | Buyer does not exercise | • Seller keeps 100 shares • $400 premium collected as extra income • Generates additional return despite price drop |