
For most of investing history, income and growth were considered opposite ends of a spectrum. You either owned slow-moving dividend payers that handed you cash every quarter, or you owned high-growth companies that reinvested every dollar and never paid you a cent.

That has changed dramatically. A new generation of high-income ETFs now promises something retail investors have never quite had before: significant monthly or weekly distributions derived directly from the volatility of the world’s most powerful technology companies. NVIDIA. Palantir. Meta. Microsoft. These are not dividend aristocrats. They are among the most volatile, fastest-growing companies on the planet — and that volatility is now being converted into income.
Whether you are a Canadian investor looking for passive income in your RRSP, or an American building monthly income from a technology-heavy portfolio, this new category of covered call ETFs and option income ETFs deserves serious attention. It also deserves serious scrutiny.
This article walks you through how these high-yield ETF strategies actually work, which products stand out, what the real risks look like, and how to integrate them into a diversified portfolio without falling into yield traps.
Why Traditional High-Yield ETFs Often Disappoint
Before understanding what makes the new generation different, it is worth understanding why so many traditional high-yield ETFs have disappointed their investors over the years.
The classic covered call ETF strategy involves holding a basket of stocks and systematically writing call options against that position. The premium collected gets distributed to investors as income. In a flat or slowly rising market, this works beautifully. In a prolonged technology-driven bull market, it becomes a mechanism for systematically handing away gains.
The stocks rally sharply. Your calls get exercised. Your portfolio exits positions at strike prices well below where the market ended up. Your distributions look attractive on paper, but your net asset value quietly deteriorates. Over time, this erodes the capital base generating your income in the first place — a process known as NAV erosion.
The second structural issue is return of capital misrepresentation. Many high-yield ETFs report distributions classified as return of capital rather than genuine investment income. These are not earnings. They are simply your own money being handed back to you in a different format, often creating tax consequences and giving investors a false sense of income generation.
Finally, there is volatility compression risk. Option premiums are directly tied to implied volatility. When markets grind steadily higher without sharp moves, implied volatility collapses and the premiums available for income shrink dramatically. A fund generating 20 percent yield in a volatile market may generate only 8 to 10 percent during calm periods — all while investors have budgeted around the higher income level.
| Problem | What It Means for Investors |
| NAV erosion | Capital base shrinks while yield % stays high |
| Return of capital | You are receiving your own money back, not earnings |
| Capped upside | Bull market gains are surrendered to option buyers |
| Volatility compression | Income drops when markets become calm |
What Changed? The Rise of the New Generation of Income ETFs
Something meaningful shifted around 2022 and 2023. Fund designers stopped asking how to generate income from stable dividend portfolios and started asking how to capture the extraordinary premium embedded in the options chains of the most volatile stocks in the world.
The insight was powerful: options premium is not distributed evenly. It is concentrated in companies with high implied volatility and active options markets. NVIDIA, with its extreme sensitivity to AI news and earnings surprises, generates options premium at a scale that a utility company simply cannot match. Palantir, with its binary AI narrative and enormous price swings, contains implied volatility that represents a genuine income opportunity for a fund willing to harvest it consistently.
This gave birth to the YieldMax ETF series, the REX FANG and AI income funds, the Roundhill 0DTE covered call strategies, and the Canadian Harvest Enhanced High Income series. These products are architecturally different from what came before, and understanding those differences is essential before investing in any of them.
The Best US High-Income ETFs With Growth Potential
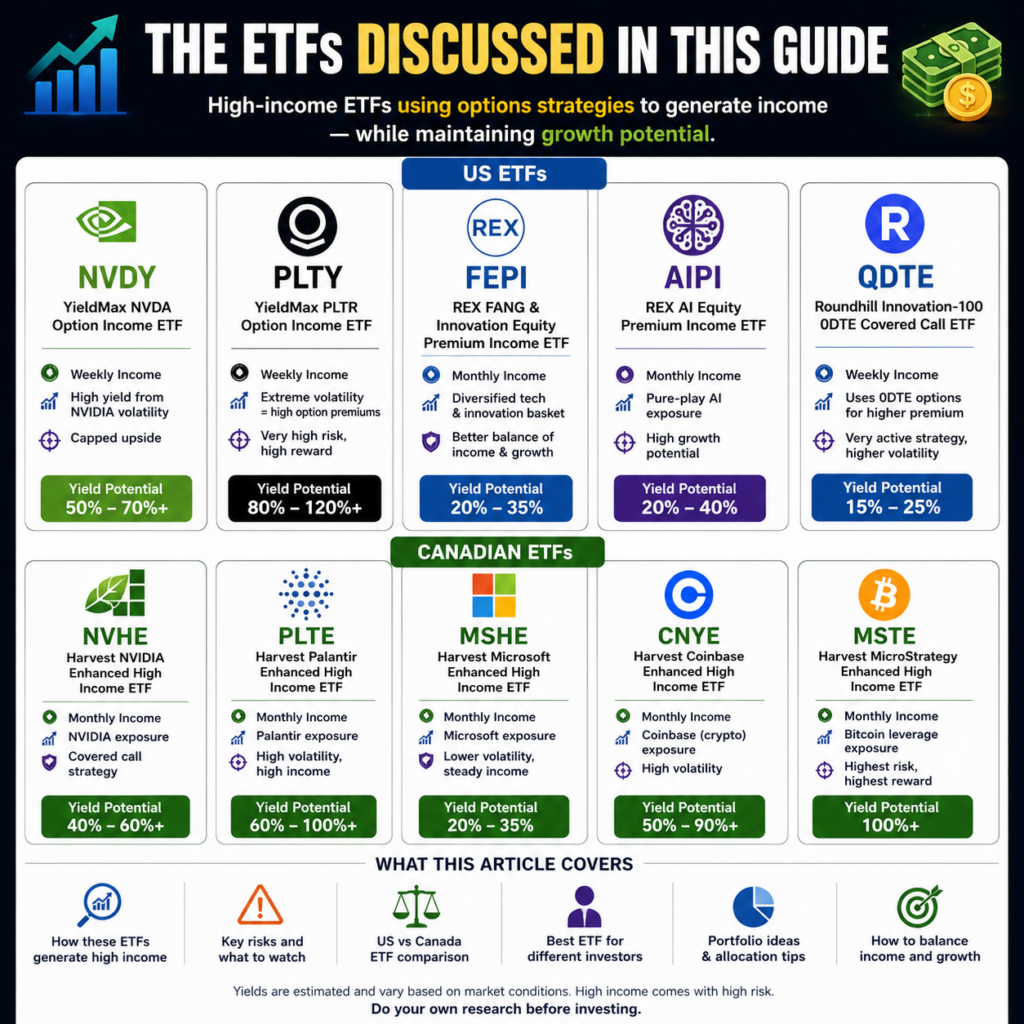
NVDY — The AI Income Machine
YieldMax NVDA Option Income Strategy ETF uses a synthetic covered call structure — replicating NVIDIA’s price exposure while simultaneously selling call options to generate income. It does not hold NVIDIA shares directly.
The income potential has been extraordinary, with annualized yields reaching 50 to 70 percent during AI-driven bull runs. The upside is meaningfully capped, however. When NVIDIA makes a 15 percent move following an earnings beat, NVDY captures only a fraction. The ideal investor already believes in NVIDIA’s long-term AI dominance but wants near-term income from that conviction.
| Metric | Details |
| Underlying | NVIDIA (synthetic) |
| Distribution | Weekly |
| Approx. yield | 50–70%+ |
| NAV erosion risk | High |
| Best for | Aggressive income investors |
PLTY — High-Volatility AI Growth Exposure
YieldMax Palantir Option Income Strategy ETF applies the same structure to one of the most volatile AI stocks in the market. The trailing distribution yield exceeds 126 percent — a figure that is both exciting and an immediate signal to think carefully.
A yield above 100 percent does not mean you will collect more than your investment every year indefinitely. It often reflects a NAV that has declined significantly while nominal distributions continued, distorting the ratio. For an investor with genuine conviction in Palantir’s AI platform story, PLTY can generate extraordinary cash flow. For anyone primarily seeking capital preservation, Palantir’s volatility profile makes it unsuitable as a core holding.
| Metric | Details |
| Underlying | Palantir (synthetic) |
| Distribution | Weekly |
| Approx. yield | 100–130%+ |
| NAV erosion risk | Very high |
| Best for | Aggressive speculative income investors |
FEPI — The Smarter Diversified Alternative
REX FANG and Innovation Equity Premium Income ETF builds a diversified basket of ten major technology companies and writes covered calls against the portfolio. This diversification matters more than it might initially seem. A regulatory action or earnings miss that devastates NVDY may leave FEPI far more resilient. The yield of approximately 25 to 30 percent annualized is lower than single-stock products but reflects a smoother, more durable income profile.
For investors who want AI and technology income without betting everything on one company’s options market, FEPI represents the more prudent structural choice.
| Metric | Details |
| Underlying | Diversified FANG basket |
| Distribution | Monthly |
| Approx. yield | 25–30% |
| NAV erosion risk | Moderate |
| Best for | Balanced income investors |
AIPI — Betting on the Future of AI Income
REX AI Equity Premium Income ETF concentrates its option-writing strategy around a curated basket of artificial intelligence leaders. The investment thesis is essentially a bet that AI volatility is not a temporary spike but a structural feature of the next decade of equity markets.
The fund’s annualized distribution yield has been in the range of 35 to 40 percent. The key risk, beyond single-theme concentration, is that AI volatility is ultimately driven by sentiment. If the AI narrative shifts from euphoric growth story to complex reality, implied volatility on these names may compress significantly, reducing the option premium available for distribution.
QDTE — The Weekly Income Revolution
Roundhill Innovation-100 0DTE Covered Call Strategy ETF writes options that expire the same day they are written — zero-days-to-expiration options — capturing the steepest part of the time-decay curve. The result is weekly distributions with an annualized yield above 40 percent.
The 0DTE structure resets constantly to reflect current market conditions, which is an advantage. The specific risk is that intraday volatility events can be extremely damaging — a sudden afternoon sell-off can create compounding losses in ways that longer-dated strategies can partially cushion.
US ETF Quick Comparison
| ETF | Underlying | Yield (approx.) | Distribution | Risk Level |
| NVDY | NVIDIA | 50–70% | Weekly | High |
| PLTY | Palantir | 100–130%+ | Weekly | Very high |
| FEPI | FANG basket | 25–30% | Monthly | Moderate |
| AIPI | AI basket | 35–40% | Monthly | Moderate-high |
| QDTE | Nasdaq-100 | 40–45% | Weekly | Moderate-high |
The Best Canadian Alternatives
For Canadian investors, currency exposure and foreign withholding taxes make US-listed products less efficient in registered accounts. Harvest ETFs has built a suite of Canadian-listed equivalents — listed on the TSX in Canadian dollars, monthly distributions, and eligible for TFSAs and RRSPs.
NVHE
Harvest NVIDIA Enhanced High Income Shares ETF holds NVIDIA shares directly and writes covered calls at approximately 33 percent coverage, combined with modest 25 percent leverage. The resulting yield of around 21 percent annualized is lower than the YieldMax equivalent but reflects a more capital-preserving approach. For Canadian investors who believe in NVIDIA’s long-term growth story and want meaningful monthly income in a registered account, NVHE is the most logical entry point into this category.
PLTE
Harvest Palantir Enhanced High Income Shares ETF mirrors the NVHE structure applied to Palantir stock. The distribution yield above 42 percent annualized makes PLTE one of the highest-yielding Canadian-listed ETFs available. The leverage component amplifies both gains and losses, and Palantir’s extreme valuation means this is a product for investors with genuine conviction and strong risk tolerance — not a conservative income choice.
MSHE
Harvest Microsoft Enhanced High Income Shares ETF applies the same structure to Microsoft, offering a fundamentally different risk profile. Microsoft’s Azure cloud growth, its deep OpenAI integration, and its enterprise software moat create a quality floor that pure-play AI momentum names cannot match. The yield of approximately 22 to 23 percent annualized is modest relative to PLTE, but the underlying business quality makes it the most defensible long-term holding in the Canadian lineup.
CNYE and MSTE
Harvest’s broader suite follows the same structural logic across multiple underlying stocks. MSTE, the MicroStrategy-linked product, shows yields above 100 percent annualized — a number that reflects distribution-to-compressed-NAV distortion rather than sustainable income generation, and should be approached with the same caution as MSTY in the US market.
Canadian vs. US Equivalents
| Canadian ETF | US Equivalent | Underlying | CAD Yield | Registered Eligible |
| NVHE | NVDY | NVIDIA | ~21% | Yes |
| PLTE | PLTY | Palantir | ~42% | Yes |
| MSHE | — | Microsoft | ~23% | Yes |
| MSTE | MSTY | MicroStrategy | ~105% | Yes |
The Dangerous Side of High-Yield ETFs

The Yield Trap
The most important danger is the yield trap. A yield trap occurs when a high headline yield attracts capital precisely at the moment when the conditions that made the yield possible are deteriorating. An investor who buys PLTY at 130 percent yield may collect substantial distributions while simultaneously watching NAV decline by 30 to 40 percent during a Palantir-specific drawdown. The net result is negative even after counting every distribution received.
Why High Yield Does Not Equal High Returns
This distinction between income received and total return is one that even financially literate investors routinely misunderstand. Suppose you invest $10,000 in a fund with a 60 percent annualized yield. Over twelve months you receive $6,000 in distributions. This sounds extraordinary. But if the fund’s NAV declined by 40 percent over the same period, your remaining position is worth approximately $6,000. Your total return is zero. You have paid yourself back your own capital in distribution form, hold a smaller position, and now generate less future income from a reduced base. This is NAV erosion’s compounding destruction in its clearest form.
Distribution Sustainability Risk
These funds have no contractual obligation to maintain specific distribution levels. When implied volatility declines, option premium shrinks and distributions are cut — often substantially and without warning. An investor who budgeted $1,500 per month in income from a YieldMax product may find themselves receiving $600 after a period of volatility compression.
How Bear Markets Actually Affect These Products
The 2022 Nasdaq bear market offers an instructive reference point. NVIDIA fell more than 65 percent from peak to trough during that cycle. An NVDY-equivalent investor would have experienced that full decline while receiving distributions that only partially cushioned the blow. The leverage in Harvest Enhanced products would have amplified the NAV decline further. These are equity products with options overlays. They carry full equity downside, modestly softened by option premium — but that premium is not large enough to prevent severe drawdowns in a genuine bear market.
Concentration Risk and the Post-Hype Collapse
Several YieldMax products have experienced a recognizable lifecycle: launch, extraordinary early distributions, retail excitement, NAV compression, distribution cuts, and disappointed investors who bought near the peak based on trailing yield figures. The most important protection against this pattern is investor education about what these products actually are — and that education begins with understanding that high yield is not a guarantee of high returns.
Which High-Income ETF Is Best For You?
| Investor Profile | Best US Option | Best Canadian Option | Max Suggested Allocation |
| Aggressive income seeker | PLTY | PLTE | Up to 10% |
| AI conviction + income | NVDY | NVHE | Up to 10% |
| Balanced income investor | FEPI | NVHE + MSHE | 5–15% total |
| Conservative income investor | QDTE | MSHE | 3–5% |
| Long-term durability | FEPI | MSHE | 5–10% |
| Highest risk / reward | PLTY | PLTE | No more than 5% |
FEPI is the most structurally sound choice for balanced investors — diversified, real underlying quality, and moderate yield without single-stock catastrophe risk. MSHE is the best long-term Canadian candidate, given Microsoft’s quality floor. PLTY and PLTE are the highest-yield, highest-risk options and should be understood as speculative satellite positions, never core holdings.
The Best Buying Opportunities
Option-income ETFs generally perform best when entered during periods of elevated but stabilizing volatility. When the VIX spikes during a correction, implied volatility across options markets rises sharply. Option sellers receive dramatically higher premiums. Buying NVDY or NVHE during a sharp NVIDIA correction — when implied volatility is elevated and the stock’s direction is uncertain — typically locks in significantly higher forward income rates than buying during a calm, grinding upward market.
The lesson is counterintuitive: the best time to buy these ETFs is often when they look most frightening. A 25 to 30 percent PLTY drawdown from peak may feel like a reason to wait. In option premium terms, it may be the optimal entry point.
| Market Condition | Performance Expectation |
| High volatility + rising AI stocks | Excellent income + NAV growth |
| High volatility + falling AI stocks | Strong income, poor NAV |
| Low volatility + slow bull market | Lower income, modest NAV gains |
| Bear market, AI sector selloff | Poor across the board |
| Post-correction recovery | Best entry opportunity |
How to Build a Portfolio Around These ETFs
A $100,000 balanced portfolio illustrates the core-satellite approach effectively.
| ETF | Allocation | Amount | Approx. Yield | Est. Annual Income |
| XEQT or VFV | 40% | $40,000 | 1.5% | $600 |
| QQQM or SCHD | 20% | $20,000 | 1–2% | $300 |
| FEPI | 15% | $15,000 | 28% | $4,200 |
| NVHE (CAD) | 10% | $10,000 | 21% | $2,100 |
| AIPI | 10% | $10,000 | 38% | $3,800 |
| Cash or bonds | 5% | $5,000 | — | — |
| Total | 100% | $100,000 | ~11% | ~$11,000 |
This generates approximately $917 per month while maintaining meaningful long-term growth exposure through conventional equity ETFs. The high-income ETF allocation is limited to 35 percent, reducing catastrophic risk from a concentrated AI sector correction.
The core-satellite model works particularly well here: a large core position in XEQT or QQQM generates long-term compound growth, while satellite positions in NVHE, FEPI, or AIPI generate current income and monetize the same underlying technology theme. The investor captures full growth upside in the core while extracting income from the volatility in the satellite.
Who Should Avoid These ETFs
Investors drawing down portfolios for living expenses and unable to tolerate NAV volatility should be extremely cautious. If you cannot replace capital after a 30 percent sector correction, these products create existential risk to your financial plan.
Investors who do not understand options mechanics — specifically what covered calls are, how NAV erosion works, and what return of capital means — should not hold these products without significant additional education. Buying MSTY because it shows 185 percent yield in a screener without understanding why that number exists is a path to real financial harm.
These products should not serve as the primary income source for anyone in or near retirement. The combination of NAV volatility, distribution variability, and leverage risk creates severe sequence-of-returns risk that bond ladders and dividend ETFs do not carry.
Final Thoughts
The new generation of AI-focused covered call ETFs and option income ETFs represents a genuine evolution in what is available to retail investors. The ability to collect meaningful monthly income from NVIDIA’s implied volatility, from Palantir’s price momentum, from the broad AI innovation complex — packaged in regulated, accessible ETFs — is remarkable by historical standards.
But financial innovation is not the same as financial improvement. These are tools, not miracles.
The underlying stock quality matters more than the distribution percentage. A fund built on NVIDIA’s genuine AI infrastructure dominance has a fundamentally different long-term risk profile than a fund built on a leveraged speculative asset, even if both show extraordinary yields today. Understanding volatility matters more than chasing yield. The entire income thesis for these products is built on volatility — and when that volatility normalizes, income shrinks. Proper allocation matters above all else. These products belong as satellite positions within diversified portfolios, in proportions that the overall portfolio can absorb if the worst-case scenario materializes.
The investors who will achieve the best outcomes here are those who use these products deliberately: to supplement conventional equity and income positions, not replace them. Used with clear eyes and realistic expectations, products like NVHE, FEPI, AIPI, and NVDY can add genuine value. Used carelessly, they will efficiently convert investor capital into the illusion of wealth — nominal distributions against a quietly eroding foundation.
Invest thoughtfully. Diversify relentlessly. And always ask not just what a product will pay you, but what it will cost you to receive that payment.
This article is for educational purposes only and does not constitute personalized investment advice. Past distribution yields do not guarantee future income. Always consult a qualified financial advisor before making investment decisions.