
Since January 1, 2026, the global stock market has been experiencing a significant sector rotation. After several years of undisputed dominance by technology — driven by mega-caps such as Apple, Nvidia, Microsoft, and Alphabet — investors have gradually shifted their capital toward more tangible, cyclical, or defensive sectors.
This shift is not accidental. It reflects a macroeconomic environment that is fundamentally different from 2021–2024: structurally high inflation, cautious central banks, rising geopolitical uncertainty, and record public debt levels across several G7 economies.

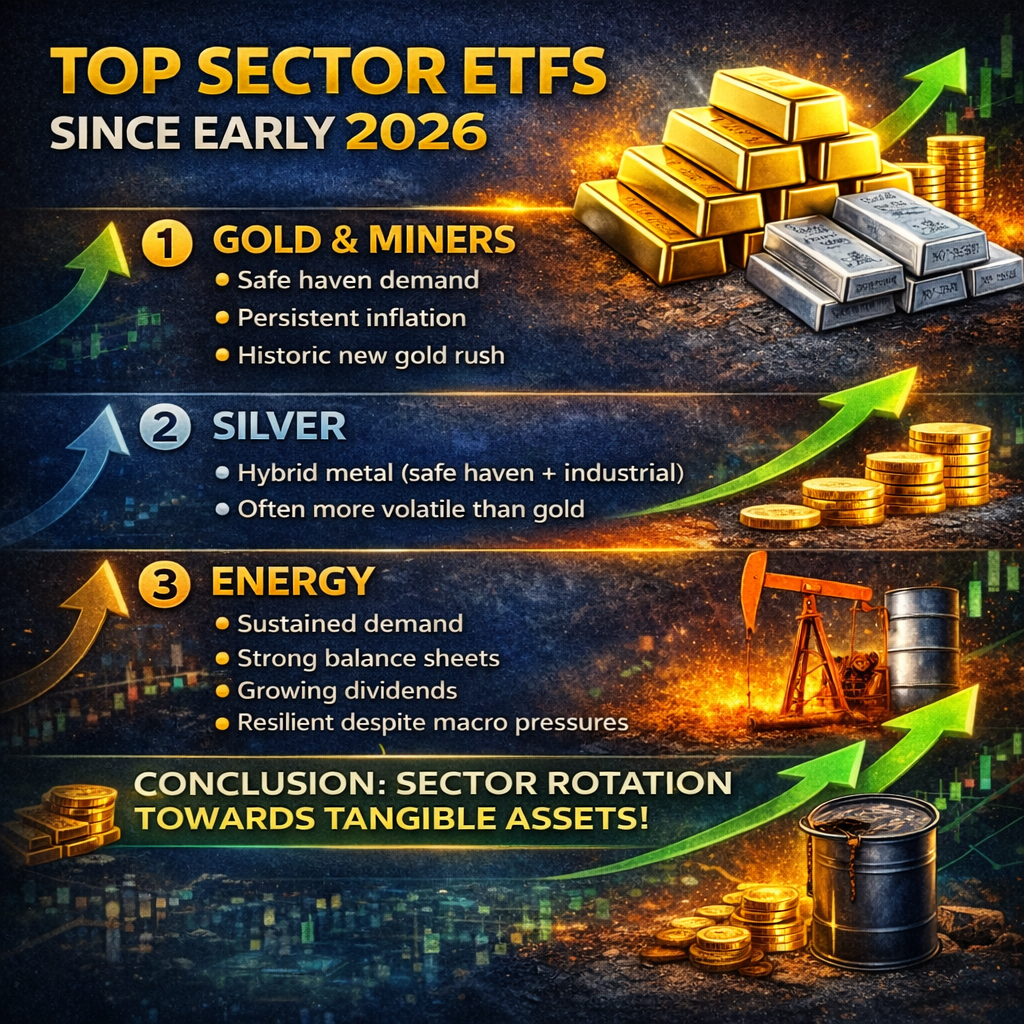
In this context, three major sector themes have clearly stood out since the beginning of the year:
- Gold and gold mining
- Silver
- Energy (oil and gas)
Let’s take a deeper look at why these sectors are leading and which Canadian ETFs have stood out year-to-date.
Executive summary
Gold and Mining: The Big Winners of 2026
Why Is Gold Outperforming in 2026?
Gold traditionally serves three key roles in a portfolio: a safe haven during uncertainty, a hedge against inflation, and a hedge against currency devaluation. In 2026, all three catalysts are present simultaneously — a rare combination that explains the magnitude of the rally.
Key drivers pushing gold to new all-time highs:
- More persistent inflation than expected: Despite central bank efforts, inflation remains above target in several developed economies, particularly due to energy and commodity pressures.
- Cautious central banks on rate cuts: The Fed and ECB have signaled a slower-than-expected pace of rate reductions, supporting gold’s appeal.
- Rising geopolitical tensions: Ongoing conflicts, global supply chain fragmentation, and gradual de-dollarization in some emerging economies are fueling institutional demand.
- Record central bank purchases: China, India, Turkey, and others continue accumulating gold reserves.
- Record public debt: Soaring deficits in the U.S. and eurozone raise long-term fiat currency concerns.
As a result, gold reached new highs in 2026, boosting mining company profits, as margins expand when gold prices rise while operating costs remain relatively stable in the short term.
Top Gold ETFs YTD
BetaPro Gold Miners 2x Daily Bull ETF (GDXU)
GDXU seeks to deliver 2x the daily performance of a gold miners index before fees. It uses derivatives to amplify daily price movements of gold mining equities. When gold stocks are in a strong, sustained uptrend, this leverage can significantly enhance short-term gains.
However, the leverage resets daily. Over multiple days, performance can diverge from exactly 2x due to compounding effects (beta slippage), particularly in volatile or sideways markets. Drawdowns can also be amplified just as quickly as gains. GDXU is therefore designed for short-term tactical trading and active portfolio management, not long-term buy-and-hold investing.
BMO Junior Gold Index ETF (ZJG)
ZJG provides exposure to junior gold mining companies, typically smaller-cap exploration and early-stage production firms. These companies often have higher growth potential but also greater operational and financing risk.
Juniors tend to exhibit strong operational leverage to gold prices. Because many operate with higher fixed costs and thinner margins, rising gold prices can lead to disproportionately large increases in profitability and share prices. This makes ZJG more volatile than large-cap mining ETFs, but potentially more rewarding during strong gold bull markets.
iShares S&P/TSX Global Gold Index ETF (XGD)
XGD tracks a diversified index of large, established gold producers, including companies such as Barrick Gold, Agnico Eagle, and Newmont. These firms typically have diversified assets, stronger balance sheets, and more stable production profiles.
Compared to junior-focused funds, XGD offers lower volatility while still capturing the upside of rising gold prices. It is often used as a core gold equity holding within a portfolio, providing balanced exposure to the gold mining sector with reduced single-company risk.
Physical Gold vs Mining Stocks
| Physical Gold | Gold Mining Stocks | |
| Volatility | Lower | Higher |
| Operational Risk | None | Operational, management, and geological risks |
| Leverage to Gold Price | 1:1 | Amplified (2x to 5x depending on the company) |
| Dividends | No | Yes (large producers) |
| Pure Protection | Excellent | Partial (correlated with equity markets) |
Physical gold typically exhibits lower volatility compared to gold mining equities because it reflects only the price movement of the metal itself. It carries no operational, management, geopolitical, or cost-inflation risks. There are no earnings reports, production disruptions, or balance sheet concerns. As a result, physical gold often acts as a portfolio stabilizer and a pure hedge against inflation, currency debasement, and systemic risk.
Gold mining stocks, on the other hand, provide leveraged exposure to the price of gold. When gold prices rise, mining company margins can expand disproportionately, leading to amplified equity returns. Many large producers also pay dividends, adding an income component that physical gold does not offer. However, mining equities carry operational risks (cost overruns, labor issues, reserve depletion), geopolitical exposure (mining jurisdictions), and are partially correlated with broader equity markets during risk-off events.
ETFs such as BMO Gold Bullion ETF (ZGLD) and iShares Gold Bullion ETF (CGL) provide direct exposure to physical gold held in vaults. These funds are designed to closely track the spot price of gold, minus fees, offering investors a convenient and liquid way to gain bullion exposure without storage or insurance concerns.
Silver: The Hybrid Metal
Silver is both a precious metal and an essential industrial metal (solar panels, electronics, EVs, medical applications). This dual nature allows silver to outperform gold when economic activity remains solid while uncertainty persists.
Industrial demand drivers:
- Solar panels (approx. 20 grams per panel)
- Electric vehicles (2–3x more silver than combustion vehicles)
- Electronics and semiconductors
Silver ETFs
BetaPro Silver 2x Daily Bull ETF (SLVU)
SLVU seeks to deliver twice the daily performance of silver futures before fees. It achieves this exposure through derivatives, primarily futures contracts, rather than holding physical silver. Because the leverage resets every day, performance over multiple days can differ materially from 2x the cumulative return of silver due to compounding effects, especially in volatile or sideways markets.
This structure makes SLVU extremely sensitive to short-term price movements. During strong, sustained uptrends, gains can be amplified significantly. However, sharp pullbacks or choppy price action can quickly erode returns. It is designed for active traders implementing short-term tactical strategies, not for buy-and-hold investors.
iShares Silver Bullion ETF (SVR)
SVR provides direct exposure to physical silver bullion stored in secure Canadian vaults. The fund is structured to closely track the spot price of silver, minus management fees and expenses.
Unlike leveraged ETFs or silver mining stocks, SVR does not introduce derivative leverage or operational mining risk. It offers a straightforward way to gain exposure to silver prices within a traditional brokerage account. This makes it suitable for long-term portfolio diversification, inflation hedging, or strategic precious metals allocation.
Canadian Silver Reserves ETR (MNS)
MNS is backed by allocated physical silver. It provides transparent, direct exposure to bullion prices without operational risk.
Silver vs Gold
Silver frequently amplifies gold’s performance during precious metals bull cycles. Several structural factors explain this dynamic:
- The silver market is smaller and less liquid, making price movements more sensitive to capital inflows.
- Speculative participation tends to be stronger in silver due to its higher volatility.
- Industrial demand adds an additional layer of structural support.
- Historically elevated gold/silver ratios often create catch-up potential for silver.
When both safe-haven demand and economic activity remain strong, silver can outperform gold significantly over a cycle.
Energy: Back in Force in 2026
After several years marked by ESG-related capital constraints, regulatory pressure, and volatile oil prices, the energy sector staged a powerful rebound in 2026. Underinvestment in new production capacity during the 2015–2022 period created structural supply tightness just as global demand stabilized, setting the stage for higher and more sustained commodity prices.
Several key catalysts explain the sector’s strength:
- Constrained global supply: OPEC+ has maintained strict production discipline, actively managing quotas to support crude prices. Years of reduced capital expenditures globally have limited spare capacity, making supply less responsive to demand shocks.
- Resilient global demand: Despite recession concerns, global oil consumption remains solid, supported by emerging markets, aviation recovery, petrochemical demand, and ongoing economic activity in Asia.
- Stronger balance sheets and shareholder returns: Canadian energy producers have shifted toward capital discipline. Rather than pursuing aggressive growth, companies are prioritizing free cash flow, debt reduction, dividends, and share buybacks—enhancing total shareholder returns.
- Geopolitical instability: Ongoing tensions in the Middle East, disruptions in key shipping routes, and broader geopolitical fragmentation have embedded a structural risk premium in oil prices.
Together, these factors have improved the quality of the sector compared to previous cycles, making energy equities more cash-flow driven and less expansion-dependent than in the past.
Leading Energy ETFs
iShares S&P/TSX Capped Energy Index ETF (XEG)
XEG is the benchmark Canadian energy ETF. It tracks the S&P/TSX Capped Energy Index and provides concentrated exposure to large-cap oil and gas producers such as Canadian Natural Resources, Suncor, and Cenovus.
Although the index is capped, the top holdings typically represent a significant portion of the portfolio, meaning performance is heavily driven by a handful of major producers. XEG is highly sensitive to movements in crude oil prices, particularly Western Canadian Select (WCS), and tends to amplify sector momentum during strong commodity cycles.
BMO Equal Weight Oil & Gas Index ETF (ZEO)
ZEO uses an equal-weight methodology, giving each constituent a similar allocation regardless of market capitalization. This structure reduces dependence on mega-cap producers and increases exposure to mid-sized companies.
Global X Equal Weight Canadian Oil & Gas Index ETF (NRGY)
NRGY follows a similar equal-weight approach focused exclusively on Canadian energy producers. It provides competitive fees and diversified exposure across upstream oil and gas companies.
Like ZEO, it reduces concentration risk compared to cap-weighted funds and allows smaller producers to contribute more meaningfully to returns.
While energy remains a cyclical sector, its structure has improved materially. Canadian producers now emphasize capital discipline, free cash flow generation, dividends, and share buybacks rather than aggressive expansion. This shift provides stronger balance sheets and offers partial downside support during commodity pullbacks.
Conclusion: The Real Lesson of 2026
Sector leadership changes over time. In 2026, tangible assets — precious metals and energy — are outperforming as investors respond to inflation, geopolitical risk, and public debt concerns.
YTD 2026 ranking:
- Gold & Gold Mining
- Silver
- Energy (Canadian Oil & Gas)
Sector rotation is real and may continue if macro conditions persist.
Disclaimer: This article is for informational purposes only and does not constitute investment advice. Past performance does not guarantee future results. Consult a licensed financial advisor before making investment decisions.