
In this post, we will go over 6 stocks that offer both attractive dividend yields and strong historical total returns. These stocks are ideal for long term investors looking for the best long-term dividend stocks. We will in analyze for each stock: the dividend yield, dividend growth, return on equity, level of debt and historical total returns.
Please always consult a financial advisor before making any investment decision.
Methodology
Below are the criteria used to select the best long term Dividend stocks:
- Have a minimum capitalization of 1 billion dollars;
- Had an annualized 3 year total return near or above 10%;
- offer a minimum dividend yield of 4%;
- Price earning ratio below 25;
- Payout ratio below 100%
- A high return on equity (above 10%)
- Low Debt to Equity ratio.
Focus on total return
The total return on a stock is the sum of the annual dividends paid while the stock is held and the capital gain (or loss) realized when it is sold. As long as the share has not been sold, the capital gain estimated according to the share price is virtual (unrealized).
The Dividend Yield, or dividend to share price ratio, can be misleading. Indeed, a very high dividend yield is usually due to a price decline in the stock price. In this scenario the investor risks having only a small capital gain or even suffering a capital loss, if he sells his share. The total return on his investment may be low or negative, while the dividend yield displayed will be high.
When one wishes to invest in a dividend-paying stock, it is essential to pay attention to its performance and growth potential. The most common mistake is to invest in stocks with high dividend yields. This strategy is risky. Here’s why :
• A stock can pay a high dividend yield, but is it sustainable? Some companies have a payout ratio that is close to and even exceeds 100%. They manage to post desirable dividend yields, but if we look at the growth prospects, it’s almost nil;
• Investors sometimes shun companies for lack of growth potential or actual risk of lower revenues in the future. These companies experience a drop in the price of their shares, and this causes the dividend yield to become abnormally high. Sooner or later, these businesses will have to cut their dividend.
Payout ratio
The dividend payout ratio is the amount of dividend distributed by a company divided by the total earnings. For example, a company makes a profit of $ 100 and pays $ 40 in dividends. Its payout ratio is 40%.
In the short term, the payment of dividends constitutes a drain on the company’s financial resources. At the time they are distributed, the share price decreases to reflect the loss of valuable cashflows. In the long term, the payment of dividends attracts shareholders and retains current shareholders. This has a positive effect on the share price. But on the other hand, an excessive levy on the resources of the company can penalize the capacity to finance future projects.
It is preferable to invest in a company, where the dividend payout ratio is low or medium. The reasoning is that these companies will have money set aside to invest in new projects and thus create growth;
How to interpret the PE Ratio
When the PE ratio is between 10 and 17, analysts consider generally that the stock is fairly priced. Below 10, it signals the undervaluation of the stock, or assumes future deficits for the company. Above 17, it tends to underline the overvaluation of the stock.
When the PE ratio is above 25, it is often synonymous with a speculative bubble or high expected profits. The PE ratio is very useful and relevant for comparing two companies with similar size and operating in the same sector of activity.
Top 10 Best Growth ETF in Canada!
15 Best Monthly Dividend Stocks in Canada for passive income
8 Best Canadian dividend stocks near their 52 weeks low
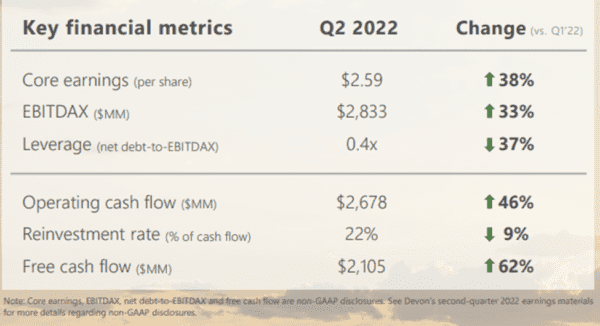
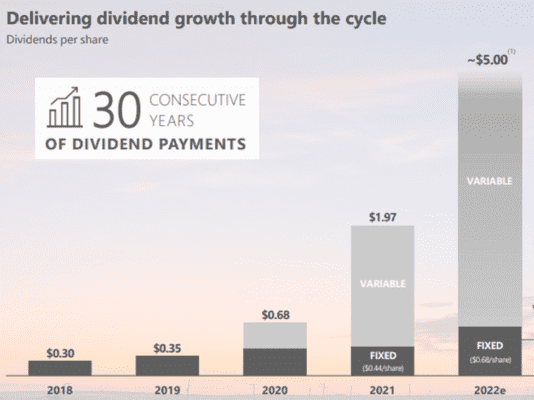
Devon Energy Corp
Devon Energy Corporation engages in the exploration, development, and production of oil, natural gas, and natural gas liquids in the United States.
+ The company has enough free cashflow to sustain its dividends. Its payout ratio is low;
+ Attractive dividend yield
+ Devon increased its dividends in each of the last 5 years;
+ PE ratio is not high which suggest the company is fairly valued;
-Devon is a energy play which means its short term performance is heavily dependent on the price of oil. The Beta is at 2.47 meaning DVN is much more volatile than the overall market.
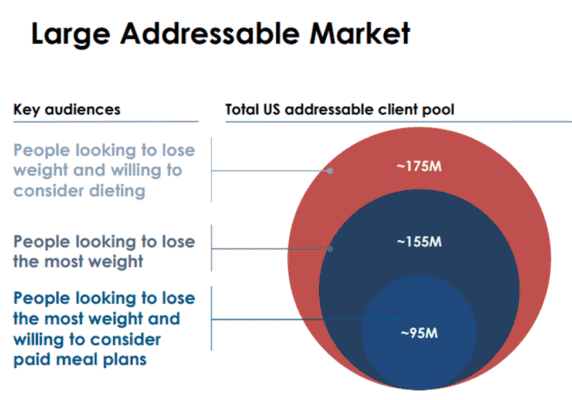
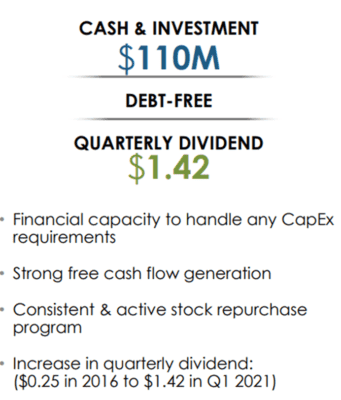
MED – Medifast Inc
Medifast, Inc manufactures and distributes weight loss, weight management, healthy living products in the United States and the Asia-Pacific.
+ Attractive dividend yield
+ Operates in a growing market and has a great business model (recurring revenue)
+ In the second quarter, revenues increased by 15% to $453M
+ Medifast increased its dividends by 39% in the past 5 years!
+ PE ratio is not high which suggest the company is fairly valued;
+Beta is 1.20, so it’s not a volatile stock even if it’s technically a small cap;
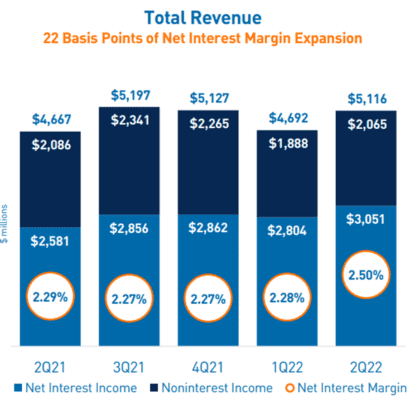
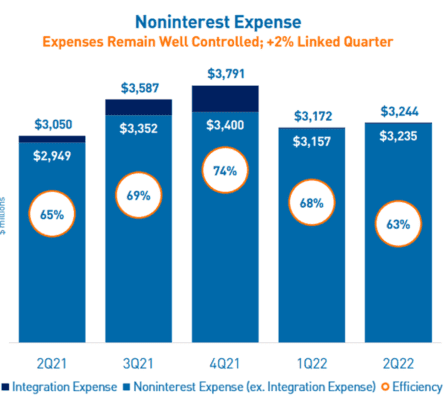
PNC – PNC Financial Services Group Inc
The PNC Financial Services Group, Inc. operates as a diversified financial services company in the United States. Segments: Retail Banking segment, Corporate & Institutional Banking and Asset Management Group. The company has 2,591 branches. It was founded in 1852 and is headquartered in Pittsburgh, Pennsylvania.
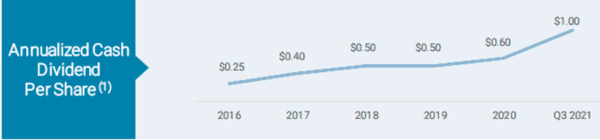
+ PNC increased its dividends by 17.76% in the past 5 years;
+ PNC has a low debt and payout ratio!
+ PE ratio is not high which suggest the company is fairly valued;
+ PNC Financial surpassed analyst expectations in Q2
+ Exposure to over 30 largest markets
+ Synergies from the BBVA acquisition allowed PNC to reduce expenses’ growth;
JEF – Jefferies Financial Group Inc
Jefferies Financial Group Inc. engages in the investment banking and capital markets, and asset management businesses. The company operates in Investment Banking and Capital Markets, Asset Management, Merchant Banking, and Corporate segments. Jeffries serves clients in the Americas, Europe, the Middle East, Africa, and Asia

+ JEF increased its dividends by 29% in the past 5 years!
+ Investment Banking is the most profitable segment for JEF. The company plans to reduce the size of its merchant banking portfolio as part of a restructuring aimed at focusing on its global investment banking business
+ Jefferies Financial Group Inc have a low payout ratio
+ PE ratio is not high which suggest the company is fairly valued;
T – Telus (or symbol TU for US investors)
TELUS Corporation, together with its subsidiaries, provides a range of telecommunications and information technology products and services in Canada. It operates through Wireless and Wireline segments. The company runs also Telus Health which provides digital solutions to insurance companies, physicians and hospitals.
+ Telus is a dividend aristocrat stock with 17 years of consecutive dividend increases!
+ The growth of Telus health will definitely help boost the company’s earning (recent of acquisition of LifeWorks $2.3B demonstrate the commitments to this segment)
+ Attractive dividend yield
+ Telus increased its dividends by 6.68% in the past 5 years;
+ Telus has a high payout ratio at 91%
+ PE ratio seems high is at 19. It’s higher than its rival Bell Canada (BCE). This being said, Telus remains attractive considering it offers both dividend and growth potential;
TROW – T. Rowe Price Group Inc
T. Rowe Price Group, Inc. provides investment services to individuals, institutional investors, retirement plans, financial intermediaries, and institutions.
+ T. Rowe increased its dividends by 14.87% in the past 5 years;
+ PE ratio is not high which suggest the company is fairly valued;
-The current market conditions are not favourable for T Rowe. Asset management companies tend to underperform during market corrections or decline, since most of their revenues are tied to the value of the asset they manage.